Dogecoin Teeters on Breakout Threshold—Can Meme Magic Ignite a Real Rally?

DOGE bulls sniff momentum as the asset flirts with key resistance levels. A clean breakout could trigger algorithmic traders to pile in—because nothing fuels crypto rallies like FOMO and automated buy orders. But let’s be real: if ’fundamentals’ mattered, we wouldn’t be betting on a Shiba Inu mascot. Watch the charts, hedge your bets, and maybe keep a sell order handy for when Elon tweets.
Dogecoin Price Turns Red
Dogecoin price started a fresh decline after it failed to clear $0.1640, unlike Bitcoin and like Ethereum. DOGE dipped below the $0.1620 and $0.1600 support levels.
The bears were able to push the price below the $0.1565 support level. It even traded close to the $0.1550 support. A low was formed at $0.1558 and the price recently corrected some losses. There was a minor move above the 50% Fib retracement level of the downward move from the $0.1635 swing high to the $0.1558 low.
Dogecoin price is now trading above the $0.1580 level and the 100-hourly simple moving average. Besides, there is a short-term bullish trend line forming with support at $0.1590 on the hourly chart of the DOGE/USD pair.
Immediate resistance on the upside is NEAR the $0.1620 level and the 76.4% Fib retracement level of the downward move from the $0.1635 swing high to the $0.1558 low. The first major resistance for the bulls could be near the $0.1640 level.
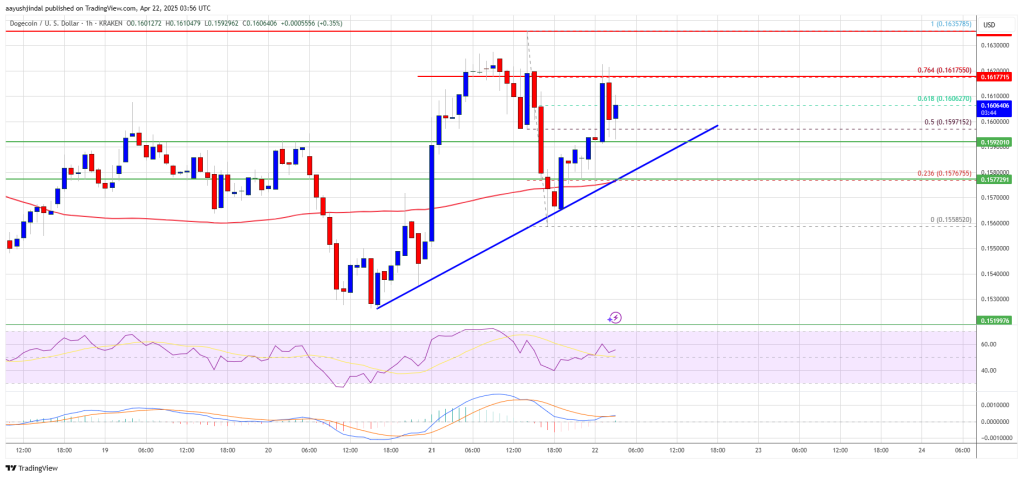
The next major resistance is near the $0.1650 level. A close above the $0.1650 resistance might send the price toward the $0.1720 resistance. Any more gains might send the price toward the $0.1780 level. The next major stop for the bulls might be $0.1800.
Another Decline In DOGE?
If DOGE’s price fails to climb above the $0.1620 level, it could start another decline. Initial support on the downside is near the $0.1590 level. The next major support is near the $0.1565 level.
The main support sits at $0.1550. If there is a downside break below the $0.1550 support, the price could decline further. In the stated case, the price might decline toward the $0.1500 level or even $0.1450 in the near term.
Technical Indicators
Hourly MACD – The MACD for DOGE/USD is now gaining momentum in the bullish zone.
Hourly RSI (Relative Strength Index) – The RSI for DOGE/USD is now above the 50 level.
Major Support Levels – $0.1590 and $0.1550.
Major Resistance Levels – $0.1620 and $0.1640.

Log in to Reply
Log in to comment your thoughtsComments
Related Articles
|Square
Get the BTCC app to start your crypto journey
Get started today Scan to join our 100M+ users