Bitcoin’s Upward Trajectory Shows Strong Momentum With Further Gains Likely

Bitcoin’s price action demonstrates sustained bullish momentum as it continues climbing in April 2025. Technical indicators suggest the current rally may have additional upside potential before encountering significant resistance levels. Market sentiment remains positive with increasing institutional interest and growing adoption metrics supporting the cryptocurrency’s valuation. The asset’s volatility profile has improved compared to previous cycles while maintaining its characteristic high-growth potential.
Bitcoin Price Eyes More Upsides
Bitcoin price remained stable above the $84,200 level and started a fresh increase. BTC was able to climb above the $85,500 and $86,200 resistance levels.
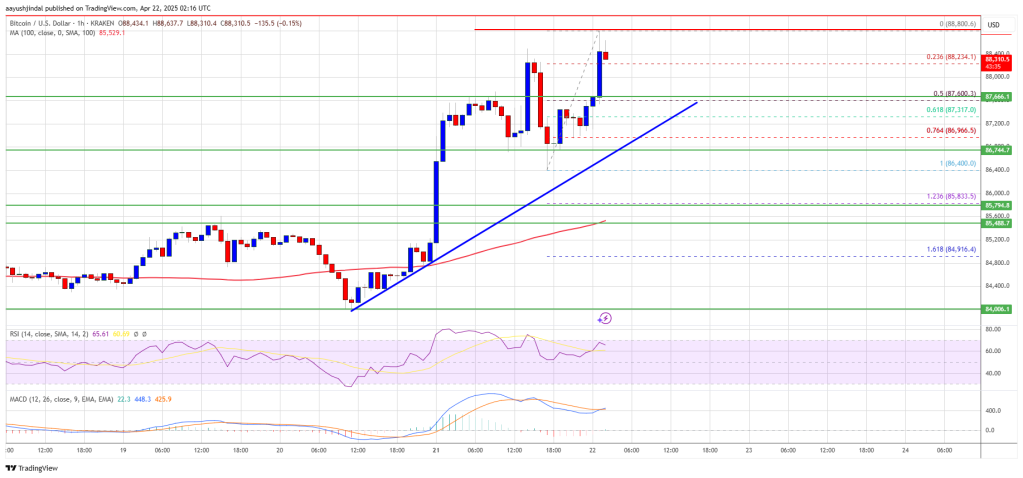
The bulls were able to pump the price above the $88,000 resistance. It even spiked and tested the $88,800 resistance zone. A high is formed near $88,800 and the price is consolidating gains above the 23.6% Fib retracement level of the upward move from the $86,400 swing low to the $88,800 high.
Bitcoin price is now trading above $87,500 and the 100 hourly Simple moving average. There is also a connecting bullish trend line forming with support at $87,300 on the hourly chart of the BTC/USD pair.
On the upside, immediate resistance is near the $88,600 level. The first key resistance is near the $88,800 level. The next key resistance could be $89,500. A close above the $89,500 resistance might send the price further higher. In the stated case, the price could rise and test the $90,500 resistance level. Any more gains might send the price toward the $92,000 level.
Downside Correction In BTC?
If Bitcoin fails to rise above the $88,800 resistance zone, it could start a downside correction. Immediate support on the downside is near the $88,000 level. The first major support is near the $87,600 level and the 50% Fib retracement level of the upward move from the $86,400 swing low to the $88,800 high.
The next support is now near the $86,800 zone. Any more losses might send the price toward the $86,400 support in the near term. The main support sits at $85,500.
Technical indicators:
Hourly MACD – The MACD is now gaining pace in the bullish zone.
Hourly RSI (Relative Strength Index) – The RSI for BTC/USD is now above the 50 level.
Major Support Levels – $88,000, followed by $87,600.
Major Resistance Levels – $88,800 and $89,500.
