XRP Bulls Hold Strong at $2.00 Support—Could a New Rally Be on the Horizon?

As of April 21, 2025, XRP has demonstrated resilience by maintaining its $2.00 support level despite market volatility. This bullish defense has sparked speculation among traders and analysts about a potential upward surge. The current price action suggests strong accumulation at this key psychological level, with indicators pointing to increasing buying pressure. Market sentiment is cautiously optimistic, as a breakout above immediate resistance could pave the way for a retest of previous highs. Technical analysts are closely watching volume trends and RSI divergence for confirmation of a sustained move. The broader altcoin market’s performance and regulatory developments may also play a crucial role in XRP’s next price movement.
XRP Price Eyes Fresh Increase
XRP price managed to stay above the $2.00 support and started a recovery wave, like Bitcoin and Ethereum. The price traded above the $2.020 and $2.050 levels to start a decent increase.
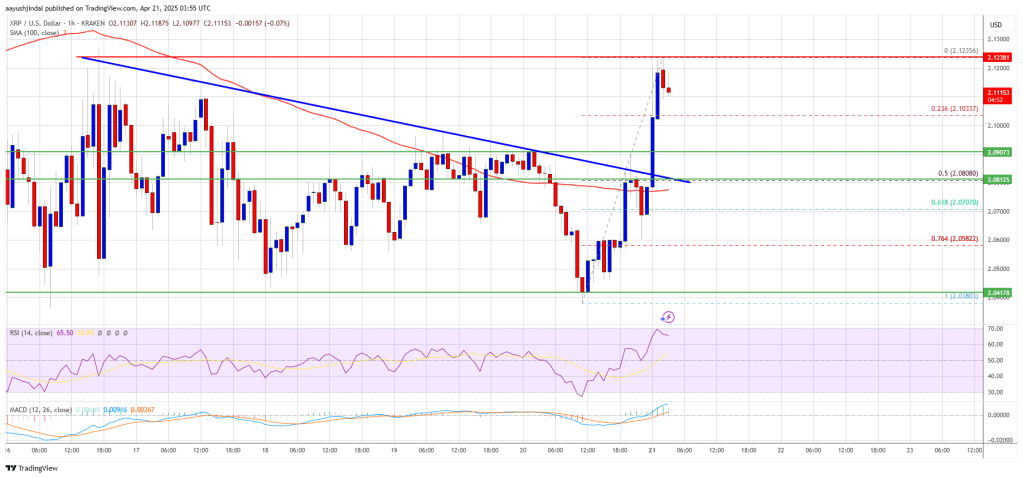
There was a break above a key bearish trend line with resistance at $2.080 on the hourly chart of the XRP/USD pair. The bulls were able to pump the price above the $2.10 level. A high was formed at $2.1235 and the price is now consolidating above the 23.6% Fib retracement level of the upward move from the $2.038 swing low to the $2.123 high.
The price is now trading above $2.10 and the 100-hourly Simple Moving Average. On the upside, the price might face resistance NEAR the $2.120 level. The first major resistance is near the $2.150 level.
The next resistance is $2.1850. A clear move above the $2.1850 resistance might send the price toward the $2.250 resistance. Any more gains might send the price toward the $2.320 resistance or even $2.350 in the near term. The next major hurdle for the bulls might be $2.50.
Another Decline?
If XRP fails to clear the $2.120 resistance zone, it could start another decline. Initial support on the downside is near the $2.10 level. The next major support is near the $2.080 level and the 50% Fib retracement level of the upward move from the $2.038 swing low to the $2.123 high.
If there is a downside break and a close below the $2.080 level, the price might continue to decline toward the $2.050 support. The next major support sits near the $2.00 zone.
Technical Indicators
Hourly MACD – The MACD for XRP/USD is now gaining pace in the bullish zone.
Hourly RSI (Relative Strength Index) – The RSI for XRP/USD is now above the 50 level.
Major Support Levels – $2.080 and $2.050.
Major Resistance Levels – $2.120 and $2.150.
