Bitcoin Faces Bearish Pressure: Analyst Suggests Falling Wedge Pattern May Signal Downside Risk to $67K

A prominent crypto analyst has identified a concerning technical formation in Bitcoin’s price action, warning that the current falling wedge pattern could be a strategic trap set by large holders. This setup historically precedes significant breakdowns, with the analyst projecting a potential decline toward the $67,000 support level. Market participants should monitor volume trends and whale wallet activity closely, as this pattern often coincides with distribution phases before sharp corrections. The analysis comes amid mixed signals in derivatives markets, where open interest remains elevated despite recent spot price weakness.
Bitcoin’s Falling Wedge That Might Not Be Bullish After All
Xanrox’s main argument centers on the widespread belief that falling wedges are bullish reversal patterns. Although this is often true when the wedge forms at the start of a trend, the current wedge is forming at the end of a broader trend, which is a different scenario altogether.
The daily candlestick timeframe chart shows the Bitcoin price moving inside a clean wedge structure while trading well below the 20, 50, 100, and 200 daily moving averages. This setup, according to Xanrox, paints the picture of a clear downtrend rather than a setup for a reversal.
The bearish outlook is not just about chart patterns; it’s also about market psychology and the mechanics of liquidity. Such a setup is likely being exploited by whales in institutions and banks with enough liquidity to influence price action.
These whales need retail buyers to create enough volume for them to offload or accumulate positions. By painting the illusion of a breakout, they can push retail participants into a false sense of opportunity, only to reverse the market and trigger stop losses across the board.
This outlook plays into the growing notion that Bitcoin is increasingly becoming more of an asset among institutions, primarily due to the rise of Spot Bitcoin ETFs.
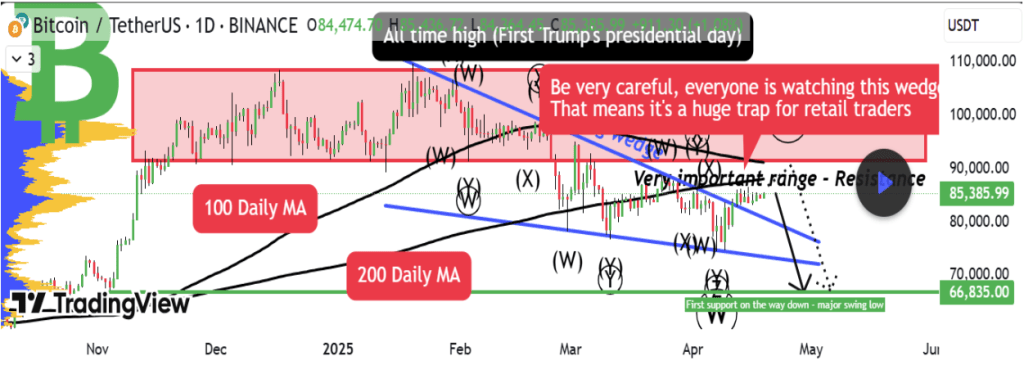
Chart Image From TradingView: Xanrox
20% Price Move For Bitcoin This Week
Xanrox predicted a 20% move for Bitcoin this week. A 20% move to the upside from the current $85,000 range would see Bitcoin trading back above $100,000 and somewhere around $102,000. However, this predicted 20% move isn’t an upside move but a downside move. Particularly, the analyst identified $67,000 as the level Bitcoin is most likely to test in the coming weeks.
The $67,000 price level is the primary target if the current wedge fails as expected, as it is the major support on the way down if $75,000 is broken.
Even if the predicted 20% downside move fails to materialize this new week, there is still the possibility of the move taking place in the coming weeks. The analyst suggests Bitcoin may attempt to retest the upper zone between $108,000 and $91,000 before heading lower.
At the time of writing, Bitcoin was trading at $84,280.
Featured image from Pexels, chart from TradingView
