Solana Price at Critical Juncture: Key Levels at $129 Support and $144 Resistance Dictate Market Direction

As of April 20, 2025, Solana (SOL) finds itself at a pivotal moment in its price trajectory. The cryptocurrency is currently testing crucial technical levels, with $129 acting as a strong support zone and $144 serving as a formidable resistance barrier. Market participants are closely monitoring these thresholds, as a decisive breakout or breakdown could signal the next significant price movement. The current consolidation phase reflects a balance between bullish and bearish forces, with traders awaiting confirmation of the next trend. Technical analysts emphasize the importance of volume and momentum indicators in determining whether SOL will attempt another assault on its all-time high (ATH) or face a deeper correction. This standoff between buyers and sellers is characteristic of mid-term market structure formations, often preceding volatile price action.
Levels That Will Define Next Solana Breakout
According to a post on social media platform X by crypto analyst Ali Martinez, Solana’s current trading range between $129 and $144 is very important to how it goes from here. Particularly, Martinez noted that the most important support for the Solana price is at $129, while the key resistance to watch sits at $144.
This commentary aligns closely with the data shown in a chart shared by the analyst, sourced from Glassnode’s UTXO Realized Price Distribution (URPD): ATH-Partitioned model.
The volume bars shown in the URPD data below indicate that Solana’s price is boxed in between dense clusters of buying and selling activity. The tallest concentration is currently around the $129 to $144 region.
The chart highlights that roughly 5.75% of all the current realized volume for SOL occurred near the $129 price point, making this level a strong support zone. Interestingly, its importance was reinforced on April 17, when Solana’s price rebounded sharply after briefly dipping to this level.
Similarly, the $144 level also holds about 5% of the volume, acting as a resistance ceiling in the short term. This price zone previously rejected bullish attempts in the final week of March, confirming it as a short-term ceiling for upward momentum.
Together, these two levels form a tightly contested range, and a breakout beyond either boundary will likely dictate whether Solana enters a new bullish leg or retraces further.
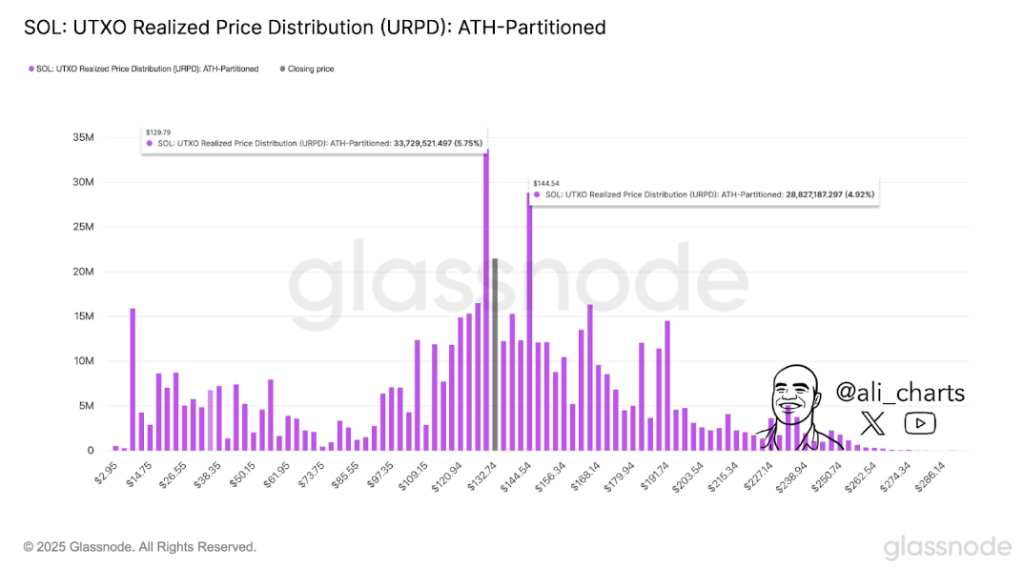
Image From X: Ali_Charts
The UTXO Realized Price Distribution (URPD): ATH-Partitioned Model
The UTXO Realized Price Distribution (URPD): ATH-Partitioned is an advanced on-chain metric that maps out where current coin holders acquired their tokens in relation to the all-time high (ATH). When a price level shows a high concentration of realized volume, it implies that a significant number of tokens were bought at that level.
These clusters tend to act as psychological support or resistance, since holders may be more inclined to defend breakeven zones (support) or exit at previous loss zones (resistance), depending on market sentiment.
In terms of market sentiment, current market sentiment is gradually turning bullish for Solana, and the recent break above $135 puts the $144 level in focus, at least in the short term. The price could reach there this new week, or a drawdown in sentiment could bring the $129 into focus as the level to hold.
At the time of writing, Solana was trading at $139, up by 3.6% in the past 24 hours.
Featured image from Mudrex, chart from TradingView

Log in to Reply
Log in to comment your thoughtsComments
Related Articles
|Square
Get the BTCC app to start your crypto journey
Get started today Scan to join our 100M+ users