Bitcoin Encounters Triple Resistance Zone Amid Persistent Price Rejection

As of April 20, 2025, Bitcoin continues to face significant technical headwinds as it struggles to break through a confluence of resistance levels. The premier cryptocurrency has experienced repeated price rejections at this critical juncture, indicating strong selling pressure from both institutional and retail traders. Market analysts point to three key resistance barriers: the psychological $70,000 level, the 50-day moving average, and a descending trendline from the recent all-time high. This triple resistance formation creates a formidable challenge for bulls attempting to regain control of the market. Trading volume patterns suggest weakening momentum, with the Relative Strength Index (RSI) hovering near neutral territory. The current technical setup raises important questions about Bitcoin’s near-term trajectory, particularly as the halving cycle progresses and miner economics evolve. Traders are closely monitoring these resistance levels for either a decisive breakout or potential reversal signals that could dictate medium-term price action.
Bitcoin Multiple Barriers: 200-Day EMA, 200-Day MA, And Diagonal Trendline In Focus
Since hitting a new all-time high in late January, Bitcoin has slipped into heavy correction, losing over 22% of its market price. The majority of the price loss has been linked to international trade tariff crises, which have forced investors to seek relief in less risky assets.
However, a pause in new tariffs and an onset in global negotiations soon accompanied a price rebound seen in early April. Albeit, Bitcoin is now struggling to break out of the $84,000-$86,000, forming a tight consolidation range.
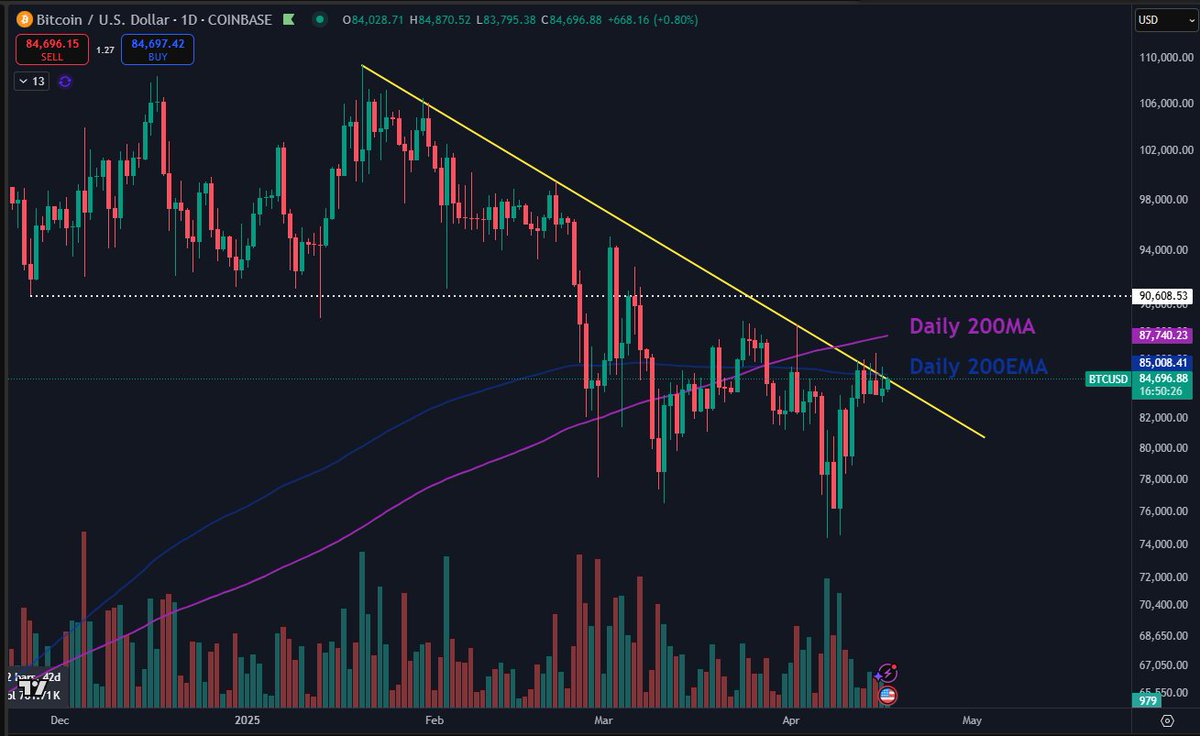
In performing a technical analysis on the current BTC market, Daan Crypto has identified the three resistance factors that have been active in the specified price zone.
The first price opposition is a diagonal downtrend line formed by Bitcoin’s consistent lower lows and lower highs amidst the price correction in the past three months. To establish any intent of a trend reversal, Bitcoin bulls must force a convincing price breakout above this long-standing diagonal resistance.
Other critical indicators are the 200-day Exponential Moving Average (EMA) and 200-day Simple Moving Average (MA), both of which provide an average of the past 200 days’ prices, with the EMA giving more weight to recent prices.
The 200-day EMA is important in spotting medium-to-long-term trend changes as it reacts faster to any price change than the 200-day MA, which is a classic long-term indicator. However, Bitcoin must move above both indicators to break out of its consolidation and perhaps experience a full price recovery.
Bitcoin Ultimate Resistance At $90,000-$91,000
Despite Bitcoin’s struggles in the $84,000-$86,000 price zone, Daan Crypto has warned that the asset’s ultimate test of a price reversal is at the $90,000-$91,000 price range, which served as a key support in the earlier phase of the bull cycle.
A successful reclaim of this range would place Bitcoin back into the bullish trading zone, signaling a potential resumption of the broader bull market. At press time, BTC continues to trade at $84,868 following a 0.13% gain in the past day. Meanwhile, the daily trading volume is down by 42.34% and valued at $12.52 billion.
