BNB Faces Critical Resistance at $600 as Bulls Push for Breakout

As of April 17, 2025, Binance Coin (BNB) continues to test the psychologically significant $600 resistance level, which has repeatedly acted as a strong barrier against upward momentum. Market analysts observe that despite multiple attempts by bullish traders to breach this ceiling, the $600 mark remains a formidable technical and psychological resistance zone. The asset’s price action suggests accumulation near this level, with trading volume patterns indicating potential FSA (Fakeout/Squeeze/Accumulation) behavior. Should BNB successfully overcome this resistance, it could pave the way for a retest of its ATH (All-Time High), though failure may trigger profit-taking from short-term holders.
BNB Price Faces Resistance
After struggling to clear the $595 resistance, BNB price started a fresh decline. There was a move below the $590 and $585 levels, like Ethereum and Bitcoin.
A low was formed at $576 and the price is now attempting to recover. There was a move above the $580 level. The price climbed above the 23.6% Fib retracement level of the downward move from the $594 swing high to the $576 low.
The price is now trading below $585 and the 100-hourly simple moving average. On the upside, the price could face resistance near the $585 level. There is also a connecting bearish trend line forming with resistance at $585 on the hourly chart of the BNB/USD pair.
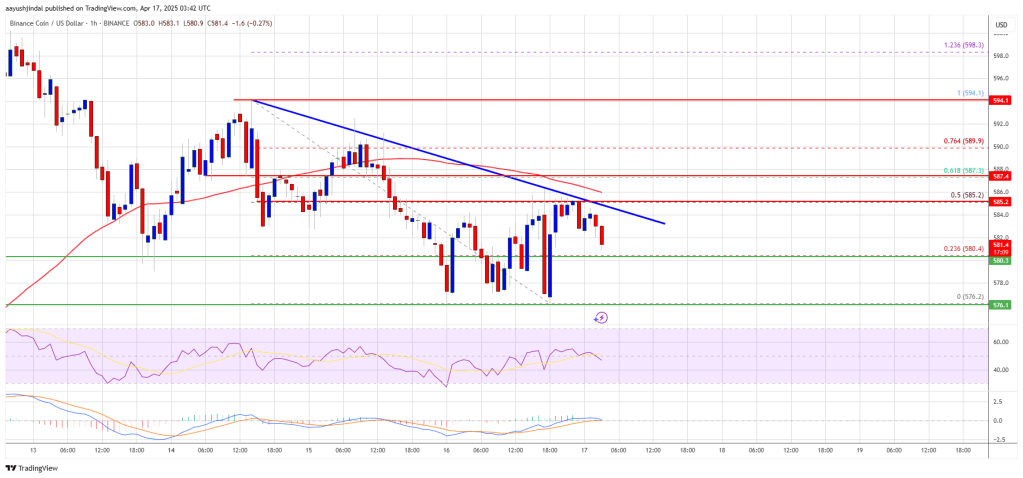
The next resistance sits near the $588 level and the 61.8% Fib retracement level of the downward move from the $594 swing high to the $576 low. A clear move above the $588 zone could send the price higher. In the stated case, BNB price could test $595. A close above the $595 resistance might set the pace for a larger move toward the $600 resistance. Any more gains might call for a test of the $620 level in the near term.
Another Decline?
If BNB fails to clear the $585 resistance, it could start another decline. Initial support on the downside is near the $580 level. The next major support is near the $575 level.
The main support sits at $562. If there is a downside break below the $562 support, the price could drop toward the $550 support. Any more losses could initiate a larger decline toward the $535 level.
Technical Indicators
Hourly MACD – The MACD for BNB/USD is losing pace in the bullish zone.
Hourly RSI (Relative Strength Index) – The RSI for BNB/USD is currently below the 50 level.
Major Support Levels – $580 and $575.
Major Resistance Levels – $585 and $595.

Log in to Reply
Log in to comment your thoughtsComments
Related Articles
|Square
Get the BTCC app to start your crypto journey
Get started today Scan to join our 100M+ users