Bitcoin Exhibits Consolidation Patterns—Is an Upside Breakout Imminent?

As of April 17, 2025, Bitcoin’s price action remains confined within a defined range, reflecting a period of consolidation. Market analysts are closely monitoring key technical indicators, including support and resistance levels, for signs of an impending bullish breakout. The current sideways movement suggests accumulation, potentially setting the stage for a significant upward trajectory. Traders are advised to watch for volume spikes and breakout confirmations to validate the next directional move. This phase could present strategic entry points for investors anticipating a resumption of the broader uptrend.
Bitcoin Price Eyes Fresh Increase
Bitcoin price struggled near the $86,500 zone and started a fresh decline. BTC declined below the $85,500 and $85,000 levels to enter a short-term bearish zone.
The price tested the $83,200 support. A low was formed at $83,171 and the price recently corrected some losses. There was a move above the $83,800 level. The price surpassed the 50% Fib retracement level of the downward move from the $86,401 swing high to the $83,171 low.
Bitcoin price is now trading below $85,000 and the 100 hourly Simple moving average. On the upside, immediate resistance is near the $84,750 level. There is also a connecting bearish trend line forming with resistance at $84,800 on the hourly chart of the BTC/USD pair.
The first key resistance is near the $85,150 level or the 61.8% Fib retracement level of the downward move from the $86,401 swing high to the $83,171 low. The next key resistance could be $85,500.
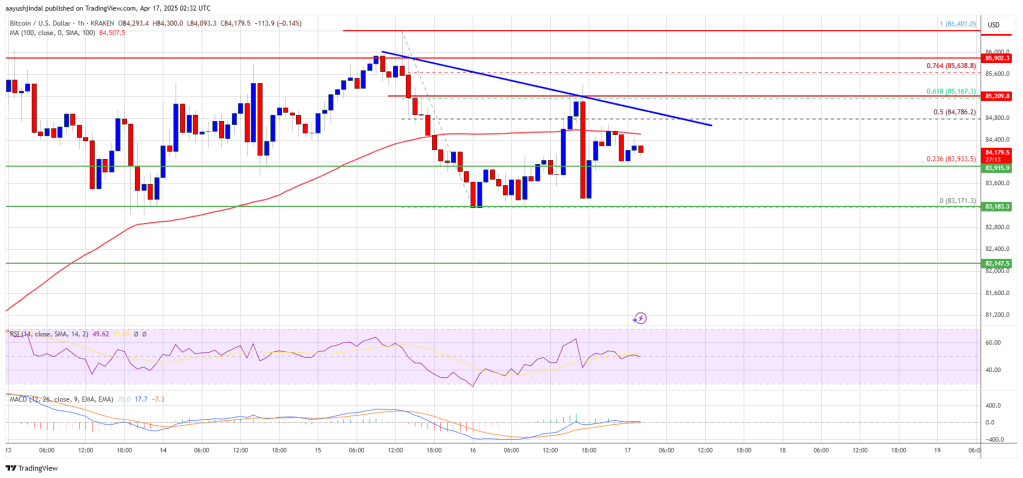
A close above the $85,500 resistance might send the price further higher. In the stated case, the price could rise and test the $85,800 resistance level. Any more gains might send the price toward the $86,400 level.
Another Decline In BTC?
If Bitcoin fails to rise above the $85,000 resistance zone, it could start another decline. Immediate support on the downside is near the $83,900 level. The first major support is near the $83,200 level.
The next support is now near the $82,200 zone. Any more losses might send the price toward the $81,500 support in the near term. The main support sits at $80,800.
Technical indicators:
Hourly MACD – The MACD is now losing pace in the bearish zone.
Hourly RSI (Relative Strength Index) – The RSI for BTC/USD is now near the 50 level.
Major Support Levels – $83,200, followed by $82,200.
Major Resistance Levels – $84,750 and $85,150.

Log in to Reply
Log in to comment your thoughtsComments
Related Articles
|Square
Get the BTCC app to start your crypto journey
Get started today Scan to join our 100M+ users