Bitcoin Surges as Analysts Forecast Major Bullish Rally: Key Price Targets Revealed

Bitcoin’s price action is aligning with prominent analyst predictions, signaling a potential bullish breakout. Market participants are closely monitoring key resistance levels as BTC shows strong upward momentum. Experts suggest that if current trends hold, Bitcoin could reach new yearly highs, with several technical indicators supporting the optimistic outlook. Traders are advised to watch for volume confirmation and potential retest scenarios before the next leg up. This development comes amid growing institutional interest and positive macroeconomic tailwinds for digital assets.
$120,000 Bitcoin Price Forecast In Motion
Kaduna, a crypto analyst on X (formerly Twitter), has released a follow-up analysis on his previous bullish prediction of Bitcoin, highlighting that it is playing out as expected. On April 11, the analyst predicted that Bitcoin was preparing for a massive push above $120,000.
He outlined a thesis that the 90-day suspension of President Trump’s Tariffs would act as a powerful macroeconomic catalyst for Bitcoin. Kaduna argued that the market may start “frontrunning” about a month early, culminating in a mini bull market during a 55-day “exit window” between April 3 and June 3 2025.
Accompanying this bullish analysis was a detailed chart comparing Bitcoin’s price movements through candlesticks with a blue overlay, believed to represent a macroeconomic indicator such as global M2. The blue line in the chart projects a steady climb during this window, offering a clear visual target above $120,000. Kaduna had stated that if his prediction played out, he would exit most positions by the end of the window.
Just days after his bullish forecast, Bitcoin has begun mirroring the projected path. Kaduna revealed in a follow-up candlestick chart that Bitcoin is breaking above the local resistance at $84,000 with strong volume support, aligning with the predicted overlay. This early strength suggests that the frontrunning behaviour the crypto expert projected earlier is now playing out in real time.
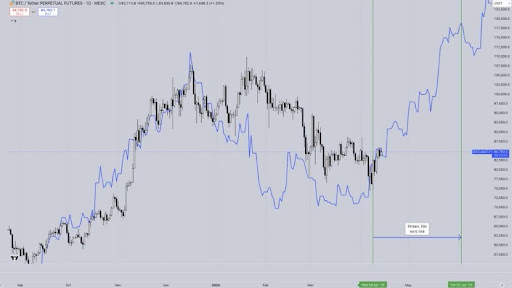
The blue line suggests a potential move toward the $120,000 – $125,000 range over the next month and a half, setting a clear upside target if momentum continues. Bitcoin’s price action is also unfolding right on cue within the 55-day window, validating the analyst’s bullish thesis.
Both the overlay and Bitcoin’s prices are trending upwards, signaling that the market is indeed reacting to the macroeconomic tariff catalyst. If this trajectory holds, it would mark a significant validation of the analyst’s macro-technical analysis approach.
Update On The Bitcoin Price Action
Following its crash below $80,000, the Bitcoin price seems to be on a path to recovery. CoinMarketCap’s data reveals that Bitcoin is currently trading at $83,395, marking a significant 7.16% increase over the past week.
The cryptocurrency had broken the resistance level at $84,000 earlier this week. However, it retraced sold gains and is now trading at its present market value. Given its fluctuating price and unstable market, crypto analysts like Tony Severino have revealed that he is neither bullish nor bearish on Bitcoin. Instead, he seems to be taking a wait-and-see approach, closely monitoring how the market responds to ongoing volatility driven by the US Trade war and tariff implementation.

Log in to Reply
Log in to comment your thoughtsComments
Related Articles
|Square
Get the BTCC app to start your crypto journey
Get started today Scan to join our 100M+ users