Ethereum Forms Complex iH&S Structure, Why $18,000 Is The Possible Target

Ethereum (ETH) is showing signs of a bullish breakout, forming a complex Inverse Head and Shoulder (iH&S) pattern on the weekly timeframe. This key technical formation suggests that the Ethereum price is on track for a massive rally toward a bullish target of $18,000.
Ethereum Forms Inverse Head & Shoulder Pattern
The Ethereum price has been in a long consolidation period, experiencing a crash amid the ongoing market turmoil. Despite recording massive declines that have pushed its value significantly below all-time highs, crypto analyst Gert van Lagen on X (formerly Twitter) predicts that ETH could still reach a price target of $18,000.
Notably, Ethereum recently bounced off the $1,800 – $2,000 support range, which previously served as resistance during the ‘Head’ phase of the iH&S pattern. With this crucial retest confirmed, ETH may be entering the final stage of its reversal, set up to new all-time highs.
Lagen’s $18,000 bullish target is more than 8X Ethereum’s current price, underscoring the sheer magnitude of this projection. Lagen has identified the formation of the iH&S structure on the Ethereum chart, supporting his ambitious prediction with this renowned bullish chart pattern.
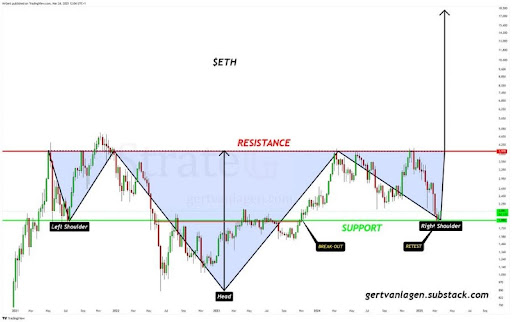
The Inverse Head and Shoulder is a classic bullish reversal structure, often signaling the end of a downtrend and the beginning of a strong and new uptrend. Considering the Ethereum’s price has been in a downturn, the formation of the iH&S chart pattern suggests that this prolonged decline may be finally coming to an end.
In the analyst’s chart, this left shoulder of the iH&S structure began forming from 2021 to 2022, experiencing a price peak before a pullback. From 2022 to 2023, a deeper decline occurred, marking the cycle low and the formation of the ‘Head.’ Finally, the right shoulder of the technical pattern was formed between 2024 to 2024, recording a higher low that aligned with the left shoulder.
Lagen’s price chart highlights that the most critical level to watch is the neckline of the iH&S structure, which is approximately $3,978 and acts as the primary resistance area.
How An $18,000 ETH Target Is Possible
Still looking at Lagen’s Ethereum price chart, the analyst suggests that if ETH can surpass the $3,978 resistance level with strong volume, it could validate the Inverse Head and Shoulder pattern and open the door for a rally toward $18,000. Conversely, if Ethereum fails to break above this resistance level, a prolonged consolidation or significant pullback may occur before its next breakout attempt.
Lagen predicts that a rejection at the resistance area could see the Ethereum price drop to $1,888 — an important support level which could prevent further declines. A drop to this support would represent a potential 52% dip from the main resistance level and an 8.52% decline from ETH’s current market value of $2,055.


Log in to Reply
Log in to comment your thoughtsComments
Related Articles
|Square
Get the BTCC app to start your crypto journey
Get started today Scan to join our 100M+ users