XRP’s $26 Price Target Holds Strong: Technical Analysis Confirms Bullish Trajectory

XRP defies market skepticism as technical patterns signal potential explosion to $26
The Chart Doesn't Lie
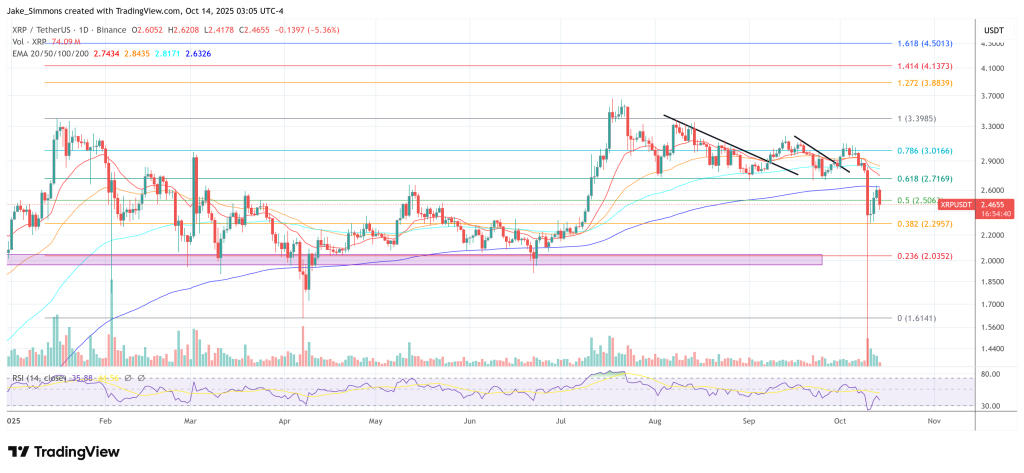
Weekly RSI readings maintain bullish divergence while Fibonacci extensions align perfectly with the $26 target. Resistance levels have crumbled one after another, leaving clear air for the next leg up.
Institutional Accumulation Accelerates
Whale wallets continue loading XRP bags despite regulatory uncertainty. Trading volume spikes suggest smart money positioning for the coming breakout—proving once again that Wall Street always follows the charts, eventually.
The Technical Foundation
Multiple time frame analysis confirms the setup remains valid. The 20-week moving average provides dynamic support while descending volume patterns indicate weakening selling pressure. When the fundamentals confuse you, the charts rarely do.
Because nothing says 'sound investment' like chasing a price target set by someone who probably wears a lambo necklace to their day job.
XRP Bull Run To $26 Still Possible?
On the current monthly candle, XRP is trading at $2.4477 with 17 days and 10 hours left in the period after printing an open at $2.8467, high at $3.1037, and low at $1.5800, down 14.0% month-to-date. The rejection zone is precise: a horizontal line marks the 1.000 Fibonacci retracement at $3.3170, which aligns with the 2018 cycle peak and has capped the last several tops in 2025. Just below, the chart includes a 0.888 retracement band (approximately $2.96) that has acted as near-term resistance during this three-month range between roughly $2.10–$3.30.
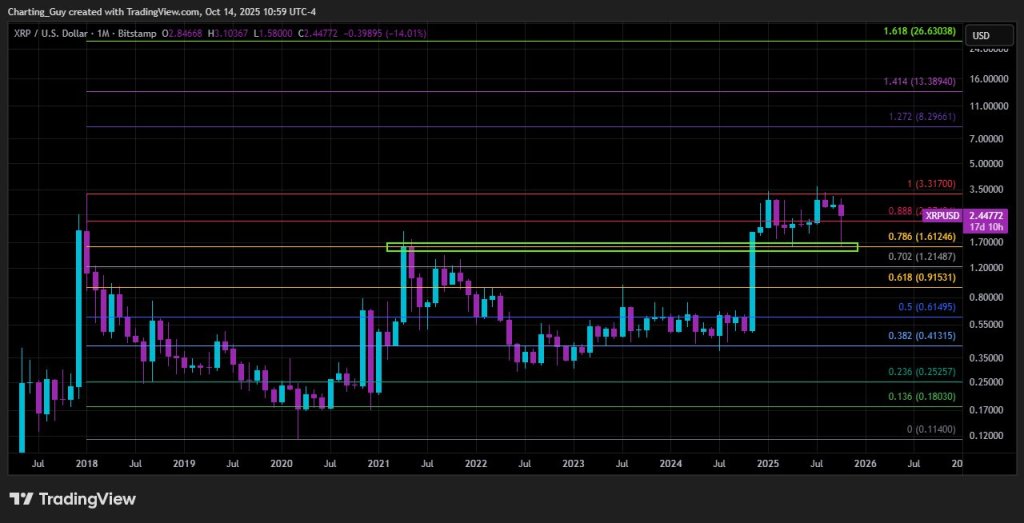
Under price, confluence is building at the former breakout shelf from the 2021 surge. A lime-green box highlights the $1.60–$1.80 area, overlapping directly with the 0.786 retracement at $1.6125 and the top of the 2021 congestion. This band caught last week’s DEEP wick to $1.58 and, in prior months, has served as a staging area for rebounds. The next staircase of support below is marked by the 0.702 at $1.2149, the 0.618 at $0.9153, and the 0.500 at $0.6149, delineating a clear hierarchy should the market see further volatility.
The bullish extension framework in Charting Guy’s layout is unambiguous. Above the all-time high at $3.3170, the chart plots successive Fibonacci expansion targets at 1.272 = $8.2961, 1.414 = $13.3894, and 1.618 = $26.6304. Those levels map a classic measured-move pathway for a trend continuation once price achieves a decisive, high-timeframe close through the prior peak. In other words, the cycle roadmap remains intact so long as the monthly structure continues to hold above the 0.786 stack and eventually flips the ATH into support.
Market Structure Remains Supportive
The analyst couples that chart with a broader market read. “So many [are] caught up in day-to-day price action,” he posted on X, adding that TOTAL2, TOTAL3, and top altcoins (ETH, XRP, SOL) each “have ONE more key fib to get over… their prior ATH. Once that happens with strength, altseason really gets going. BTC.D tanks & shitcoins finally catch a bid.” In his XRP view, that “one more key fib” is the $3.3170 threshold.
Technically, the setup is binary and well-defined on the monthly timeframe: continued defense of $1.60–$1.80 keeps the uptrend’s higher-low structure intact, while a sustained break and close above $3.3170 WOULD confirm the next leg toward the extension grid at $8.30, $13.39, and—at the cycle’s ambitious outer bound—the 1.618 marker near $26.63. For now, XRP remains range-bound beneath ATH but supported by the same zone that powered its last breakout, exactly as Charting Guy’s chart depicts.
At press time, XRP traded at $2.4655.