XRP Primed for Major Breakout – Bulls Ready to Seize Control?

XRP stands at the precipice of a potentially explosive move upward as technical patterns tighten and bullish momentum builds.
The Setup
Trading patterns show XRP consolidating near critical resistance levels – the kind of compression that typically precedes significant price movements. Market sentiment shifts as accumulation patterns emerge among institutional players.
Technical Indicators Flash Green
Key moving averages align in bullish formation while trading volume suggests growing institutional interest. The cryptocurrency maintains strong support levels despite recent market volatility.
Regulatory Clarity Fuels Optimism
Recent regulatory developments remove uncertainty that previously hampered XRP's performance. Market participants now position for potential upside as legal overhangs dissipate.
Institutional Money Returns
Whale accumulation patterns indicate smart money positioning for a breakout. Trading desks report increased XRP interest from hedge funds and family offices – the same players who typically front-run retail investors.
Market Psychology Shifts
Fear of missing out begins to creep into trader sentiment as technical setups improve. Short positions get squeezed while long-term holders increase their stakes.
The cryptocurrency that once moved markets now follows – but technical alignment suggests XRP might soon reclaim its trend-setting status. Because nothing says 'financial revolution' like watching hedge funds outperform your portfolio yet again.
XRP Price Set To Surge?
XRP price found support and started a strong recovery wave above $2.220, like Bitcoin and Ethereum. The price was able to climb above the $2.320 and $2.40 levels to enter a positive zone.
The bulls were able to push the price above the 61.8% Fib retracement level of the downward move from the $3.05 swing high to the $1.40 swing low. However, the bears are still active NEAR the $2.60 and $2.620 levels. Besides, there is a key bearish trend line forming with resistance at $2.60 on the hourly chart of the XRP/USD pair.
The price is now trading above $2.50 and the 100-hourly Simple Moving Average. If there is a fresh upward move, the price might face resistance near the $2.550 level.
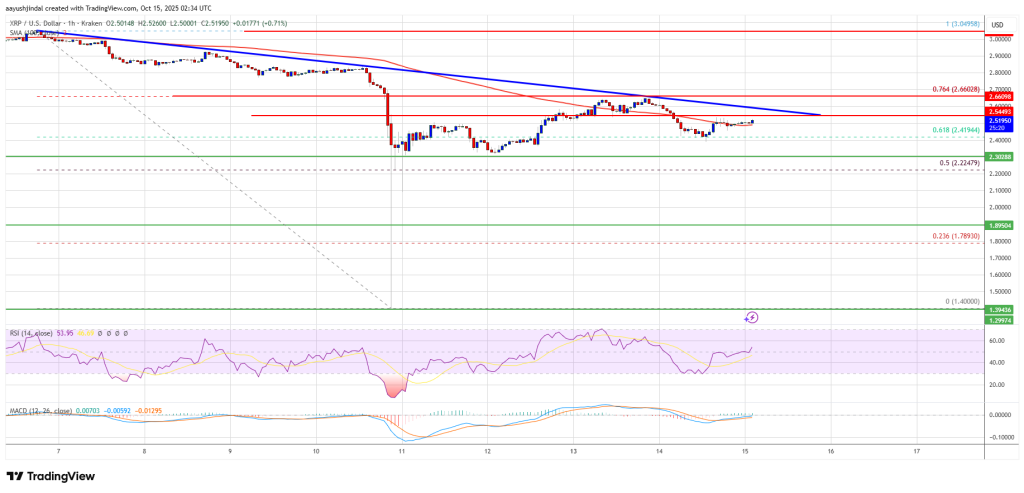
The first major resistance is near the $2.60 level and the trend line. The main hurdle could be near the 76.4% Fib retracement level of the downward MOVE from the $3.05 swing high to the $1.40 swing low at $2.660. A clear move above the $2.660 resistance might send the price toward the $2.720 resistance. Any more gains might send the price toward the $2.750 resistance. The next major hurdle for the bulls might be near $2.80.
Another Drop?
If XRP fails to clear the $2.60 resistance zone, it could start a fresh decline. Initial support on the downside is near the $2.50 level. The next major support is near the $2.420 level.
If there is a downside break and a close below the $2.420 level, the price might continue to decline toward $2.320. The next major support sits near the $2.250 zone, below which the price could continue lower toward $2.20.
Technical Indicators
Hourly MACD – The MACD for XRP/USD is now gaining pace in the bullish zone.
Hourly RSI (Relative Strength Index) – The RSI for XRP/USD is now above the 50 level.
Major Support Levels – $2.50 and $2.420.
Major Resistance Levels – $2.60 and $2.660.
