Bitcoin’s Powerful Rebound - Is This Recovery Sparking the Next Major Bull Run?

Bitcoin stages dramatic comeback as bullish signals flash green across crypto markets.
The Recovery Accelerates
After recent volatility shook out weak hands, Bitcoin's resilience surprises traditional finance skeptics—the same experts who've been predicting its demise since 2017. Price action suggests institutional money flowing back in, bypassing traditional market jitters that typically tank conventional assets.
Technical Breakout Confirmed
Key resistance levels crumble as buying pressure intensifies. The rally cuts through previous resistance zones like they're not even there. Trading volume spikes while short positions get liquidated—classic bull market behavior that makes Wall Street's 2% annual returns look downright pathetic.
Market Sentiment Shifts
Fear transforms into greed as investors pile back in. The recovery triggers fresh momentum that could propel Bitcoin toward new heights, leaving traditional finance scrambling to explain how digital gold outperforms their carefully managed portfolios yet again.
Will this be the launchpad for the next parabolic move, or just another fakeout in crypto's endless drama? One thing's certain—while bankers debate spreadsheets, Bitcoin keeps printing money for believers.
Bitcoin Price Starts Recovery
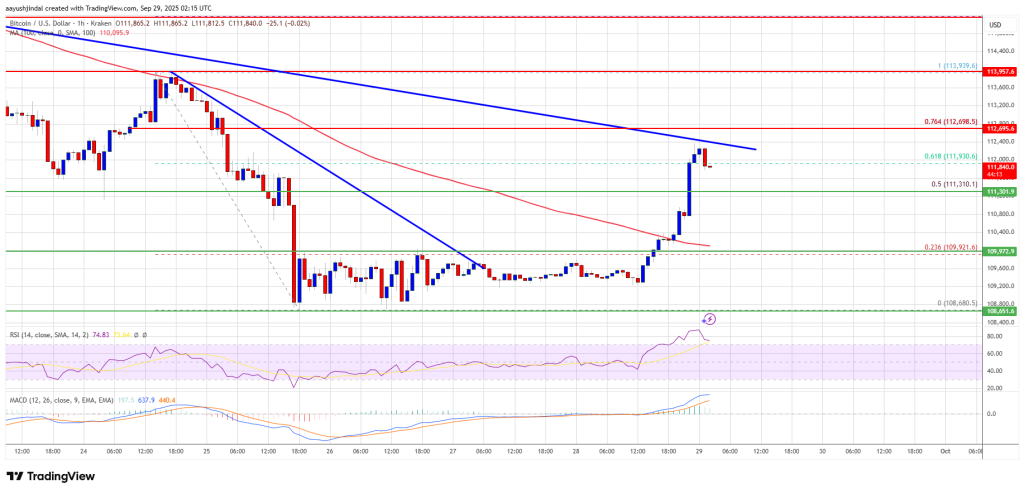
Bitcoin price managed to stay above the $108,500 zone and started a recovery wave. BTC settled above the $109,500 resistance zone to start the current move.
There was a clear MOVE above the 50% Fib retracement level of the downward wave from the $113,940 swing high to the $108,680 low. Besides, there was a break above a connecting bearish trend line with resistance at $109,600 on the hourly chart of the BTC/USD pair.
The bulls even pushed the price above $112,000 before the bears appeared. Bitcoin is now trading above $111,500 and the 100 hourly Simple moving average.
Immediate resistance on the upside is near the $112,400 level. The first key resistance is near the $112,500 level and another trend line. The next resistance could be $113,700 or the 76.4% Fib retracement level of the downward wave from the $113,940 swing high to the $108,680 low.
A close above the $112,700 resistance might send the price further higher. In the stated case, the price could rise and test the $113,500 resistance. Any more gains might send the price toward the $114,500 level. The next barrier for the bulls could be $115,00.
Another Drop In BTC?
If bitcoin fails to rise above the $112,500 resistance zone, it could start a fresh decline. Immediate support is near the $111,300 level. The first major support is near the $110,500 level.
The next support is now near the $109,500 zone. Any more losses might send the price toward the $108,800 support in the near term. The main support sits at $107,500, below which BTC might struggle to recover in the short term.
Technical indicators:
Hourly MACD – The MACD is now gaining pace in the bullish zone.
Hourly RSI (Relative Strength Index) – The RSI for BTC/USD is now above the 50 level.
Major Support Levels – $111,300, followed by $110,500.
Major Resistance Levels – $112,500 and $112,700.
