Bitcoin Forms Bearish Evening Star Pattern - Will Price Really Drop Below $100,000?

Bitcoin's weekly chart flashes a classic reversal signal that's got traders watching every tick.
The Technical Setup
That evening star pattern isn't just candlewick folklore - it's a three-part formation that signals potential momentum shift. First comes the bullish candle, then the indecisive doji, finally the bearish confirmation. Textbook stuff, if textbooks traded at 3 AM.
Market Psychology at Play
Traders are eyeing that $100,000 level like it's the last lifeboat on the Titanic. The pattern suggests exhaustion among bulls who pushed Bitcoin to recent highs. Now the question becomes whether institutional money sees this as a buying opportunity or exit signal.
Broader Context Matters
Remember when technical patterns actually predicted things? Neither do we - not in a market where Elon Musk's tweets move needles more than Fibonacci retracements. The real test comes when liquidity meets conviction at key support levels.
Whether this pattern holds or breaks might depend more on macro conditions than chart geometry. But watching Wall Street try to apply traditional technical analysis to crypto never gets old - it's like watching your grandfather discover emojis.
Bitcoin Price Forms Bearish Pattern On Weekly Chart
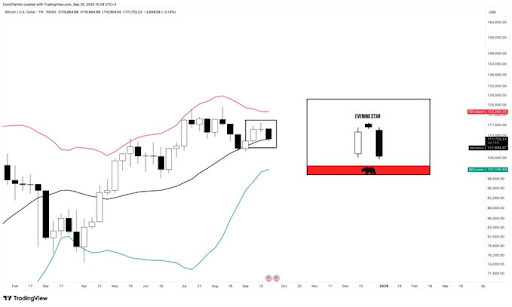
Severino revealed in an X post that the bitcoin price is potentially forming an Evening Star pattern on the weekly chart, something he is wary of. He noted that this pattern is forming right at the Bollinger Band basis line, at around $111,600, during the tightest BB squeeze in BTC’s history.
The market expert had earlier revealed that the Bitcoin price’s weekly Bollinger Bands are officially the tightest in the entire history of BTCUSD price action. Essentially, BTC is currently trading within a tight range, indicating low volatility. Severino’s accompanying chart shows that the upper BB is at around $122,000, the basis BB is at $111,600, while the lower BB is at $101,000.
Meanwhile, the Evening Star pattern suggests that the bears are taking control from the bulls, putting the bitcoin price at risk of a further downtrend. With the Bollinger bands being this tight, Severino may be cautious of how this could lead to a BTC decline to the lower BB basis. Crypto analyst Bob Loukas confirmed that the bears are in control and indicated that BTC could still drop below $100,000.
He noted that the Bitcoin price is looking to print its Weekly Cycle Low, although he opined that BTC is holding up well despite the current downtrend. The analyst declared that a rally to $118,000 will confirm the start of a new cycle.
Until then, the bears will remain in control. His accompanying chart showed that the flagship crypto could risk dropping below $100,000 during this period when the bears are in control. However, in the long run, Loukas still expects the Bitcoin price to rally to as high as $140,000.
BTC Needs To Reclaim $116,300
Crypto analyst Ali Martinez also warned that the Bitcoin price needs to reclaim $116,300 or risk dropping as low as $94,334 based on the Pricing Bands. He had earlier stated that $107,200 is the crucial support for Bitcoin. The analyst claimed that a drop below that support level WOULD put $100,000 or even $93,000 in play.
Meanwhile, crypto analyst Titan of Crypto noted that the Bitcoin price has broken below the trendline at $110,000. He remarked that confirmation is still needed and that the lagging span must follow to validate this bearish move. However, the analyst is one of those who doesn’t believe that BTC has topped, noting that the market is in a period of fear and that this has never marked the cycle top.
At the time of writing, the Bitcoin price is trading at around $109,600, up in the last 24 hours, according to data from CoinMarketCap.
