SUI Retests Ascending Triangle Support After 8% Plunge – Bounce Back or Breakdown Imminent?

SUI tests critical chart pattern support as bears push prices down 8% in latest crypto shakeout.
Technical Crossroads
The digital asset now faces its ultimate technical test at the ascending triangle's baseline. Traders watch closely to see if this level becomes a launchpad or collapse zone.
Market Psychology at Play
Every retest either strengthens support or reveals underlying weakness. This 8% drop either shakes out weak hands or signals deeper trouble ahead.
Breaking Point
Chart patterns don't lie—but they do trap both bulls and bears. The next candle determines whether this becomes a 'buy the dip' opportunity or another 'should've sold' moment in crypto's endless drama.
SUI Hits Two-Month Low
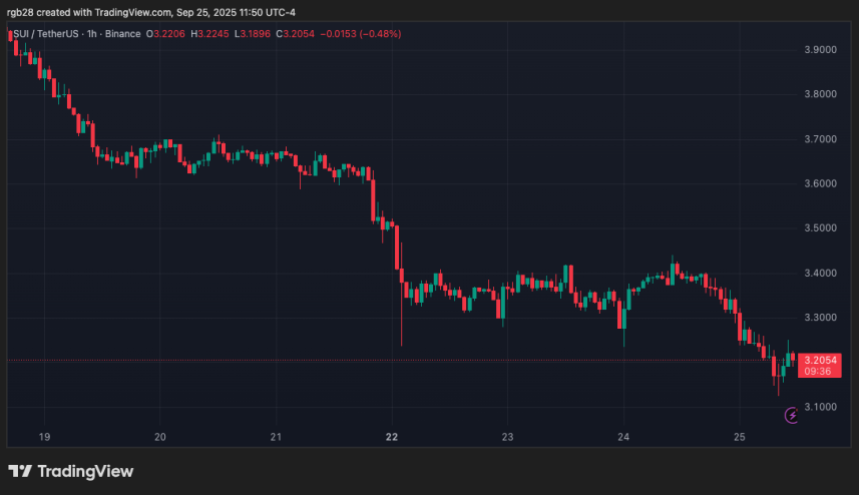
On Thursday, SUI is retesting the local range lows after an 8% daily drop from the $3.40 area to a key support level. The recent market pullbacks have momentarily halted most bullish rallies, sending leading cryptocurrencies like ethereum (ETH) to an eight-week low of $3,800.
Now, SUI’s rally, which was fueled by institutional interest, Digital Asset Treasuries (DATs), and positive developments for the network, has declined over 21% in the weekly timeframe.
The cryptocurrency has seen a strong three-month rally following its early Q3 breakout to its multi-month high of $4.44. The altcoin has hovered between the $3.10-$4.00 levels over the past three months, attempting to break out of this range multiple times.
Last week, SUI’s price retested this area for the third time during this period, but has since been rejected from the range highs after failing to hold the $3.80 mark as support.
Market watcher Daan crypto Trades highlighted that the cryptocurrency has been “stuck” inside the $3.10-$4.30 range since May, briefly losing the support area during the June pullback.
According to the trader, the five-month consolidation should eventually lead to a big price move out of the range. “As we approach the range low/support, it’s back on my radar for a potential range play,” he noted, adding that it WOULD need a strong bounce from this area to hold the macro range.
On the contrary, Daan suggested that “If it sits there and doesn’t do anything, then that’s a red flag,” as it would risk losing the crucial multi-month support and retracing toward the June lows.
Price Retests Make-Or-Break Level
Amid the retracement, sui is also retesting another crucial support. As multiple analysts pointed out, the cryptocurrency is trading within a textbook ascending triangle pattern on a higher timeframe.
Notably, the price has been compressing within the pattern’s upper and lower boundaries since early Q2. Throughout the multi-month consolidation, each time the altcoin has bounced from the ascending support, it has retested the flat upper trendline.
Ali Martinez highlighted that a successful breakout from the bullish formation’s resistance line around the $4 barrier would set the stage for a retest of its all-time high (ATH) level of $5.35 and an overall 75% rally toward the $7 area.
Similarly, analyst Sjuul from AltCryptoGems affirmed that “it’s really time to pay attention” to the bullish formation, as the price compression continues and a break from the pattern seems imminent.
Per the post, SUI’s price must hold the triangle’s rising lower trendline to be able to attempt to break out of the pattern again. Failing to maintain this key support, currently located around the $3.10 area, could invalidate the setup and lead to a retest of the $2.40-$2.90 zone.
As of this writing, SUI is trading at $3.15, a nearly 10% decline in the monthly timeframe.