Bitcoin Price Faces Renewed Pressure – Are Bears About to Trigger a Deeper Correction?

Bitcoin's resilience gets tested once more as selling pressure mounts across crypto markets.
Technical Breakdown: Where Support Levels Matter Most
Key psychological levels are crumbling faster than traditional finance institutions' credibility. The $60K support zone—once considered solid ground—now shows concerning weakness. Trading volumes spike during downticks while buyers remain hesitant.
Market Psychology: Fear Versus Greed
Whale wallets move coins to exchanges at rates not seen since last quarter's slump. Retail investors follow like lemmings—because nothing says 'sound investment strategy' like panic-selling during volatility. Meanwhile, institutional players quietly accumulate positions, because apparently someone still believes in this 'digital gold' narrative.
Macro Factors: The Hidden Pressure Cooker
Global liquidity conditions tighten just as crypto faces its seasonal September blues. Federal Reserve policies continue to haunt risk assets, proving that decentralized finance isn't quite as decoupled from traditional systems as proponents claim. The irony? Bitcoin was supposed to be the hedge against exactly this scenario.
Bottom Line: This isn't 2018's catastrophic bear market—but it's certainly not the easy ride bulls enjoyed during last year's rally. Whether this dip becomes a buying opportunity or the start of something deeper depends entirely on whether Bitcoin can prove its fundamental value beyond speculative trading. Because let's be honest—if we wanted unpredictable price action tied to macroeconomic whims, we could just trade forex like normal people.
Bitcoin Price Stuck Below Resistance
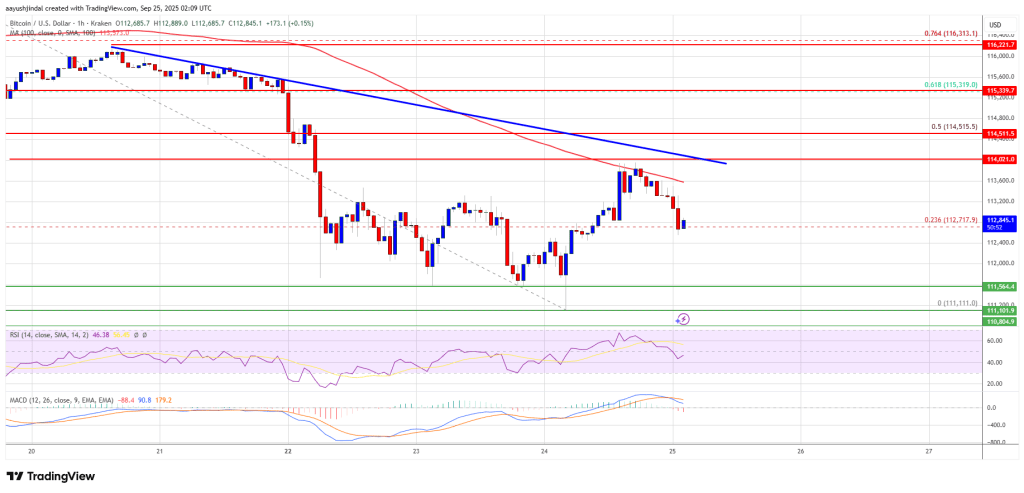
Bitcoin price failed to start a recovery wave and stayed below $115,000. BTC declined below the $113,500 and $113,000 support levels to MOVE further into a bearish zone.
The decline gained pace below the $112,500 level. A low was formed at $111,111 and the price is now consolidating losses. There was a minor move above the 23.6% Fib retracement level of the recent decline from the $117,920 swing high to the $111,111 low.
Bitcoin is now trading below $113,500 and the 100 hourly Simple moving average. Besides, there is a bearish trend line forming with resistance at $114,000 on the hourly chart of the BTC/USD pair.
Immediate resistance on the upside is NEAR the $113,500 level. The first key resistance is near the $114,000 level and the trend line. The next resistance could be $114,500 or the 50% Fib retracement level of the recent decline from the $117,920 swing high to the $111,111 low.
A close above the $114,500 resistance might send the price further higher. In the stated case, the price could rise and test the $115,500 resistance. Any more gains might send the price toward the $116,500 level. The next barrier for the bulls could be $117,250.
Another Decline In BTC?
If Bitcoin fails to rise above the $114,000 resistance zone, it could start a fresh decline. Immediate support is near the $112,000 level. The first major support is near the $111,250 level.
The next support is now near the $110,500 zone. Any more losses might send the price toward the $108,800 support in the near term. The main support sits at $107,500, below which BTC might gain bearish momentum.
Technical indicators:
Hourly MACD – The MACD is now gaining pace in the bearish zone.
Hourly RSI (Relative Strength Index) – The RSI for BTC/USD is now below the 50 level.
Major Support Levels – $112,000, followed by $111,250.
Major Resistance Levels – $113,500 and $114,000.
