Wedge Breakout Or False Alarm? Ethereum Faces Its Biggest Support Test Yet

Ethereum teeters on the edge as technical patterns signal a critical juncture for the world's second-largest cryptocurrency.
The Wedge Breakdown
Chart analysts spot a descending wedge formation tightening like a coiled spring. Every trader watches the support level that's held through multiple tests—until now. Break this floor and we're looking at a potential freefall. Hold it and Ethereum could rocket toward resistance levels not seen in months.
Market Psychology at Play
Traders split between those seeing a classic breakout setup and others warning of a bull trap. The volume tells the real story—spikes on down days suggest smart money positioning for a breakdown. Retail investors keep buying the dip, convinced institutional adoption will save the day.
The Institutional Wildcard
BlackRock's ETH ETF application gathers dust at the SEC while crypto natives shrug. Who needs traditional finance's stamp of approval when decentralized protocols process more volume than some national stock exchanges? Still, the old guard's hesitation keeps a ceiling on mainstream momentum.
Technical Versus Fundamental
Fundamentalists point to Ethereum's burning mechanism and layer-2 adoption as long-term bullish signals. Technicians counter that charts don't care about network upgrades when liquidity's thin. Both sides agree: this support test will separate diamond hands from weak ones.
Meanwhile, traditional finance experts who dismissed crypto as a 'fad' in 2020 now scramble to understand smart contracts—proving once again that Wall Street's always late to the party but still expects the best seat.
ETH Breaks Rising Wedge: Key Retest In Play
According to a recent post by crypto analyst The Boss on X, Ethereum’s weekly chart was previously showing a rising wedge formation. This technical pattern is often viewed with caution as it can signal a potential bearish reversal. However, in a surprising and bullish development, ethereum broke out of this pattern to the upside, suggesting a strong underlying momentum.
Following this breakout, the price has now pulled back to perform a crucial re-test of the very level it just surpassed. This re-testing of the breakout point is a classic MOVE in technical analysis, where the previous resistance level is now being tested as new support.
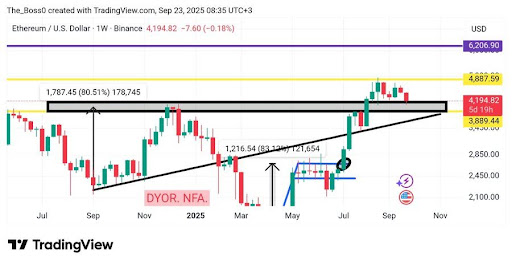
The analyst highlights that if ETH successfully holds this key re-test level, it will open the door for a continued move higher. Meanwhile, the next potential resistance area, indicated on the analyst’s chart, is situated at the $4,887 price level.
ATH Targets Intact While Price Stays Above Support
Crypto Candy, in a recent update, highlighted Ethereum’s sudden move back into the weekly support zone between $3,900 and $4,100. This zone has proven to be a crucial area for ETH, serving as a strong foundation for buyers to maintain the current bullish outlook. The fact that Ethereum is still holding above this level suggests that market sentiment remains positive, with price aiming for higher targets.
According to the analyst, as long as ETH maintains its position above the $3,900–$4,100 support zone, the overall trajectory points toward retesting its all-time high levels. While this zone serves as a make-or-break area, it could determine Ethereum’s next big move. Holding here keeps the bullish case intact and strengthens the probability of another significant rally in the weeks ahead.
However, crypto Candy also warned of a critical risk. If Ethereum fails to defend this support and closes below $3,800, the entire outlook could shift dramatically. Such a move would invalidate the bullish structure and potentially invite strong selling pressure, opening the door for a deeper correction. Thus, the coming sessions remain crucial as ETH battles to keep its footing above this vital support zone.
