XRP Price Analysis: Golden Ratio Saves the Day – What’s Next for 2025?

- Why is the $2.35 Golden Ratio Level Critical for XRP?
- Short-Term Correction: Is the Worst Over?
- Can XRP Rally 22% From Here?
- The Death Cross Threat: How Real Is the Danger?
- XRP/BTC Pair: A Hidden Opportunity?
- FAQ: Your XRP Questions Answered
Why is the $2.35 Golden Ratio Level Critical for XRP?
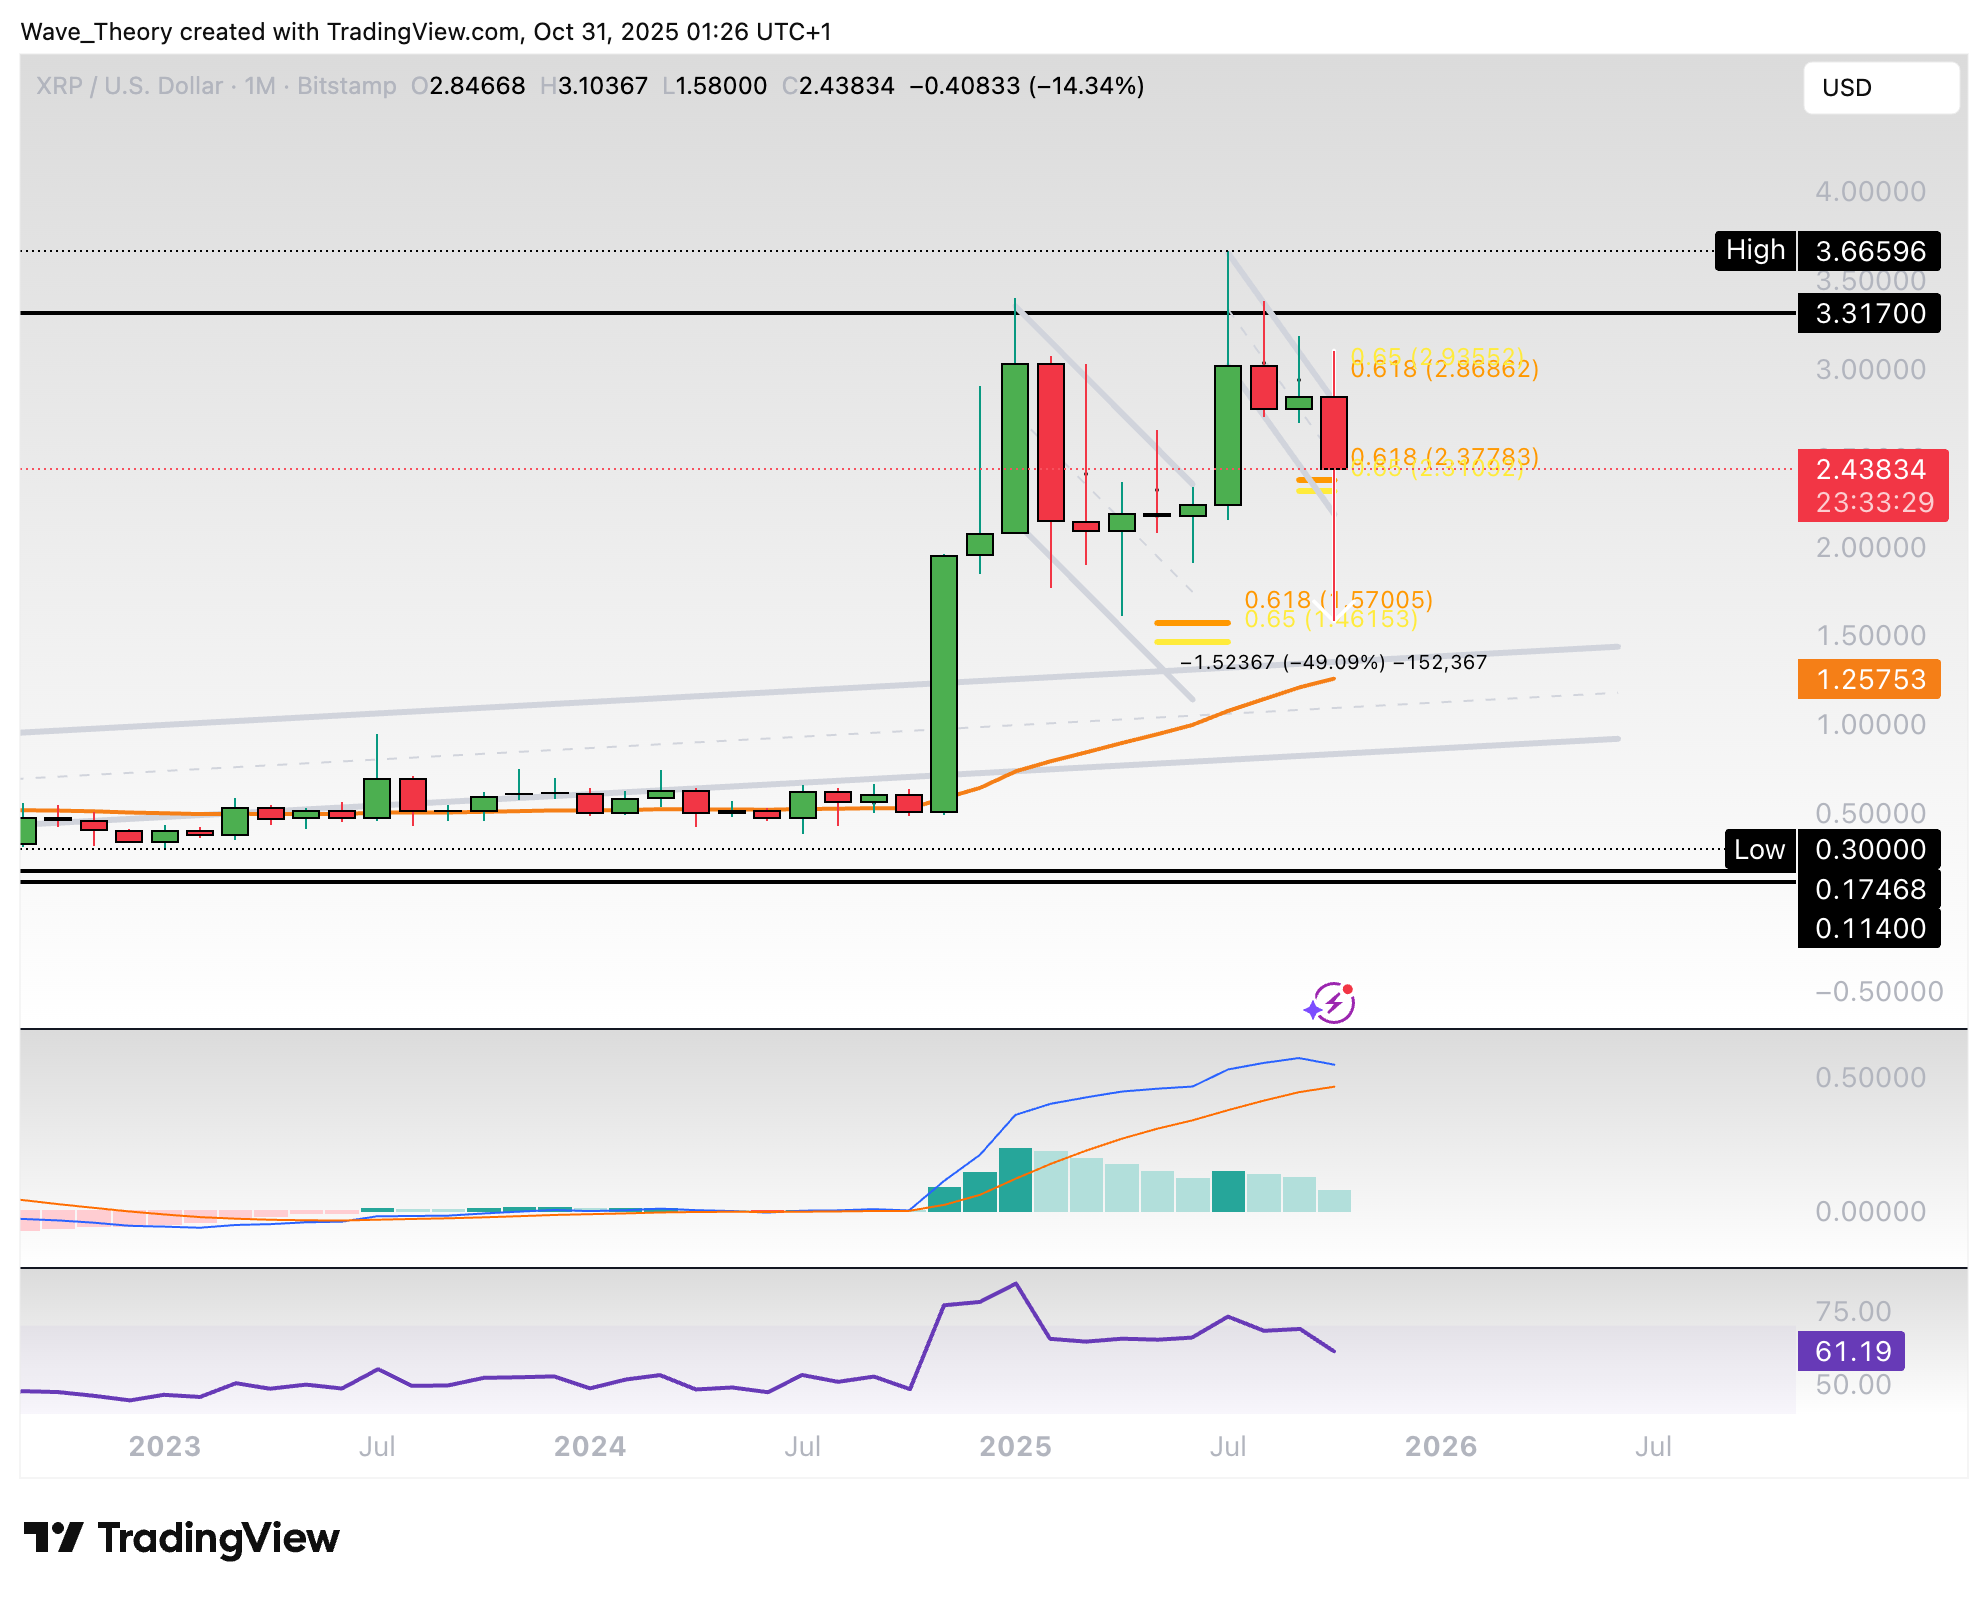
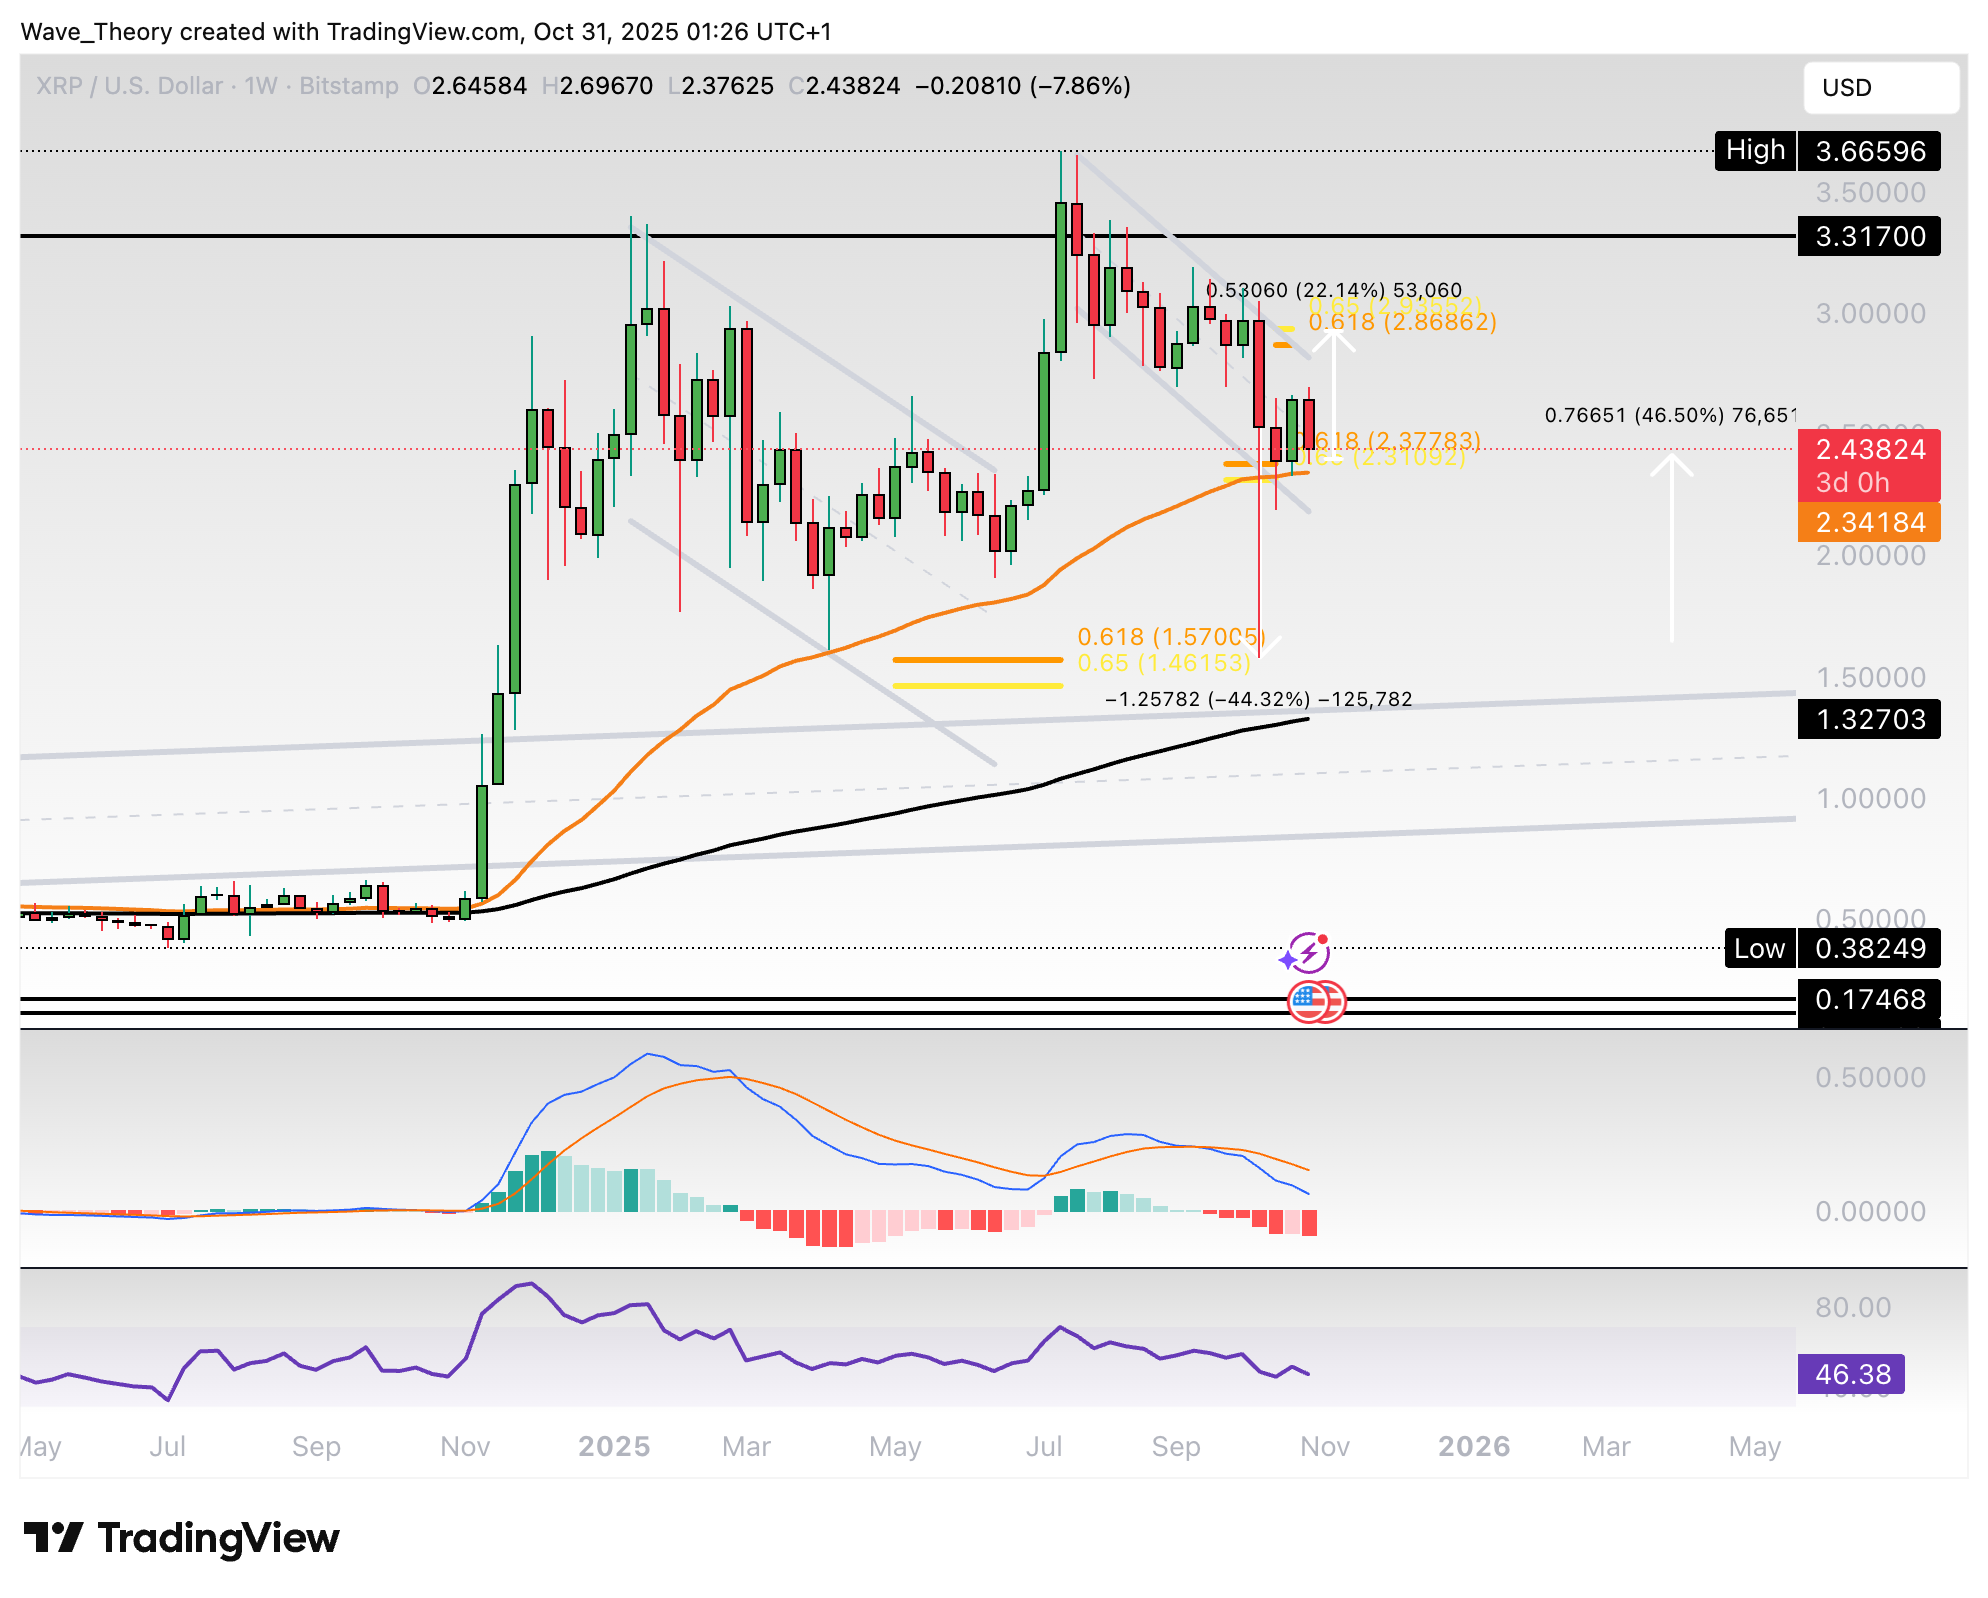
XRP’s price has found a lifeline at the Golden Ratio support level of $2.35, a key Fibonacci retracement zone. Historically, this level has acted as both support and resistance, making it a make-or-break point for the next trend. If bulls defend this zone, we could see a rebound toward $2.88. However, a breakdown might trigger a deeper correction to $1.55, where another Fibonacci support lies. The 50-week Exponential Moving Average (EMA) also converges here, adding further significance to this price level.
Short-Term Correction: Is the Worst Over?
XRP experienced a brutal 49% drop this month, shaking out weak hands before bouncing from $1.55. The MACD histogram shows bearish momentum fading, while the RSI remains neutral—classic signs of a market in limbo. On the 4-hour chart, a "death cross" (50 EMA below 200 EMA) suggests short-term bearish pressure, but remember, these crosses often precede reversals. As one BTCC analyst noted, "The market loves to fake out traders when sentiment is extreme."
Can XRP Rally 22% From Here?
The weekly chart reveals conflicting signals: a bullish Golden Cross (50 EMA above 200 EMA) clashes with bearish MACD line crossovers. If $2.35 holds, a 22% climb to $2.88 seems plausible. But failure to break that resistance could mean retesting $1.55 or even the 200-week EMA at $1.33. Interestingly, the last time XRP danced around these Fibonacci levels in late 2024, it led to a 60% rally—history doesn’t repeat, but it often rhymes.
The Death Cross Threat: How Real Is the Danger?
Daily charts show EMAs inching toward a death cross, typically a bearish omen. However, the MACD histogram’s upward tilt hints at weakening selling pressure. XRP recently got rejected at the 50-day EMA ($2.66), reinforcing $2.35 as a pivotal battleground. "These technical patterns work until they don’t," quipped a veteran trader on BTCC’s platform. "The real question is whether institutional money flows back into altcoins this quarter."
XRP/BTC Pair: A Hidden Opportunity?
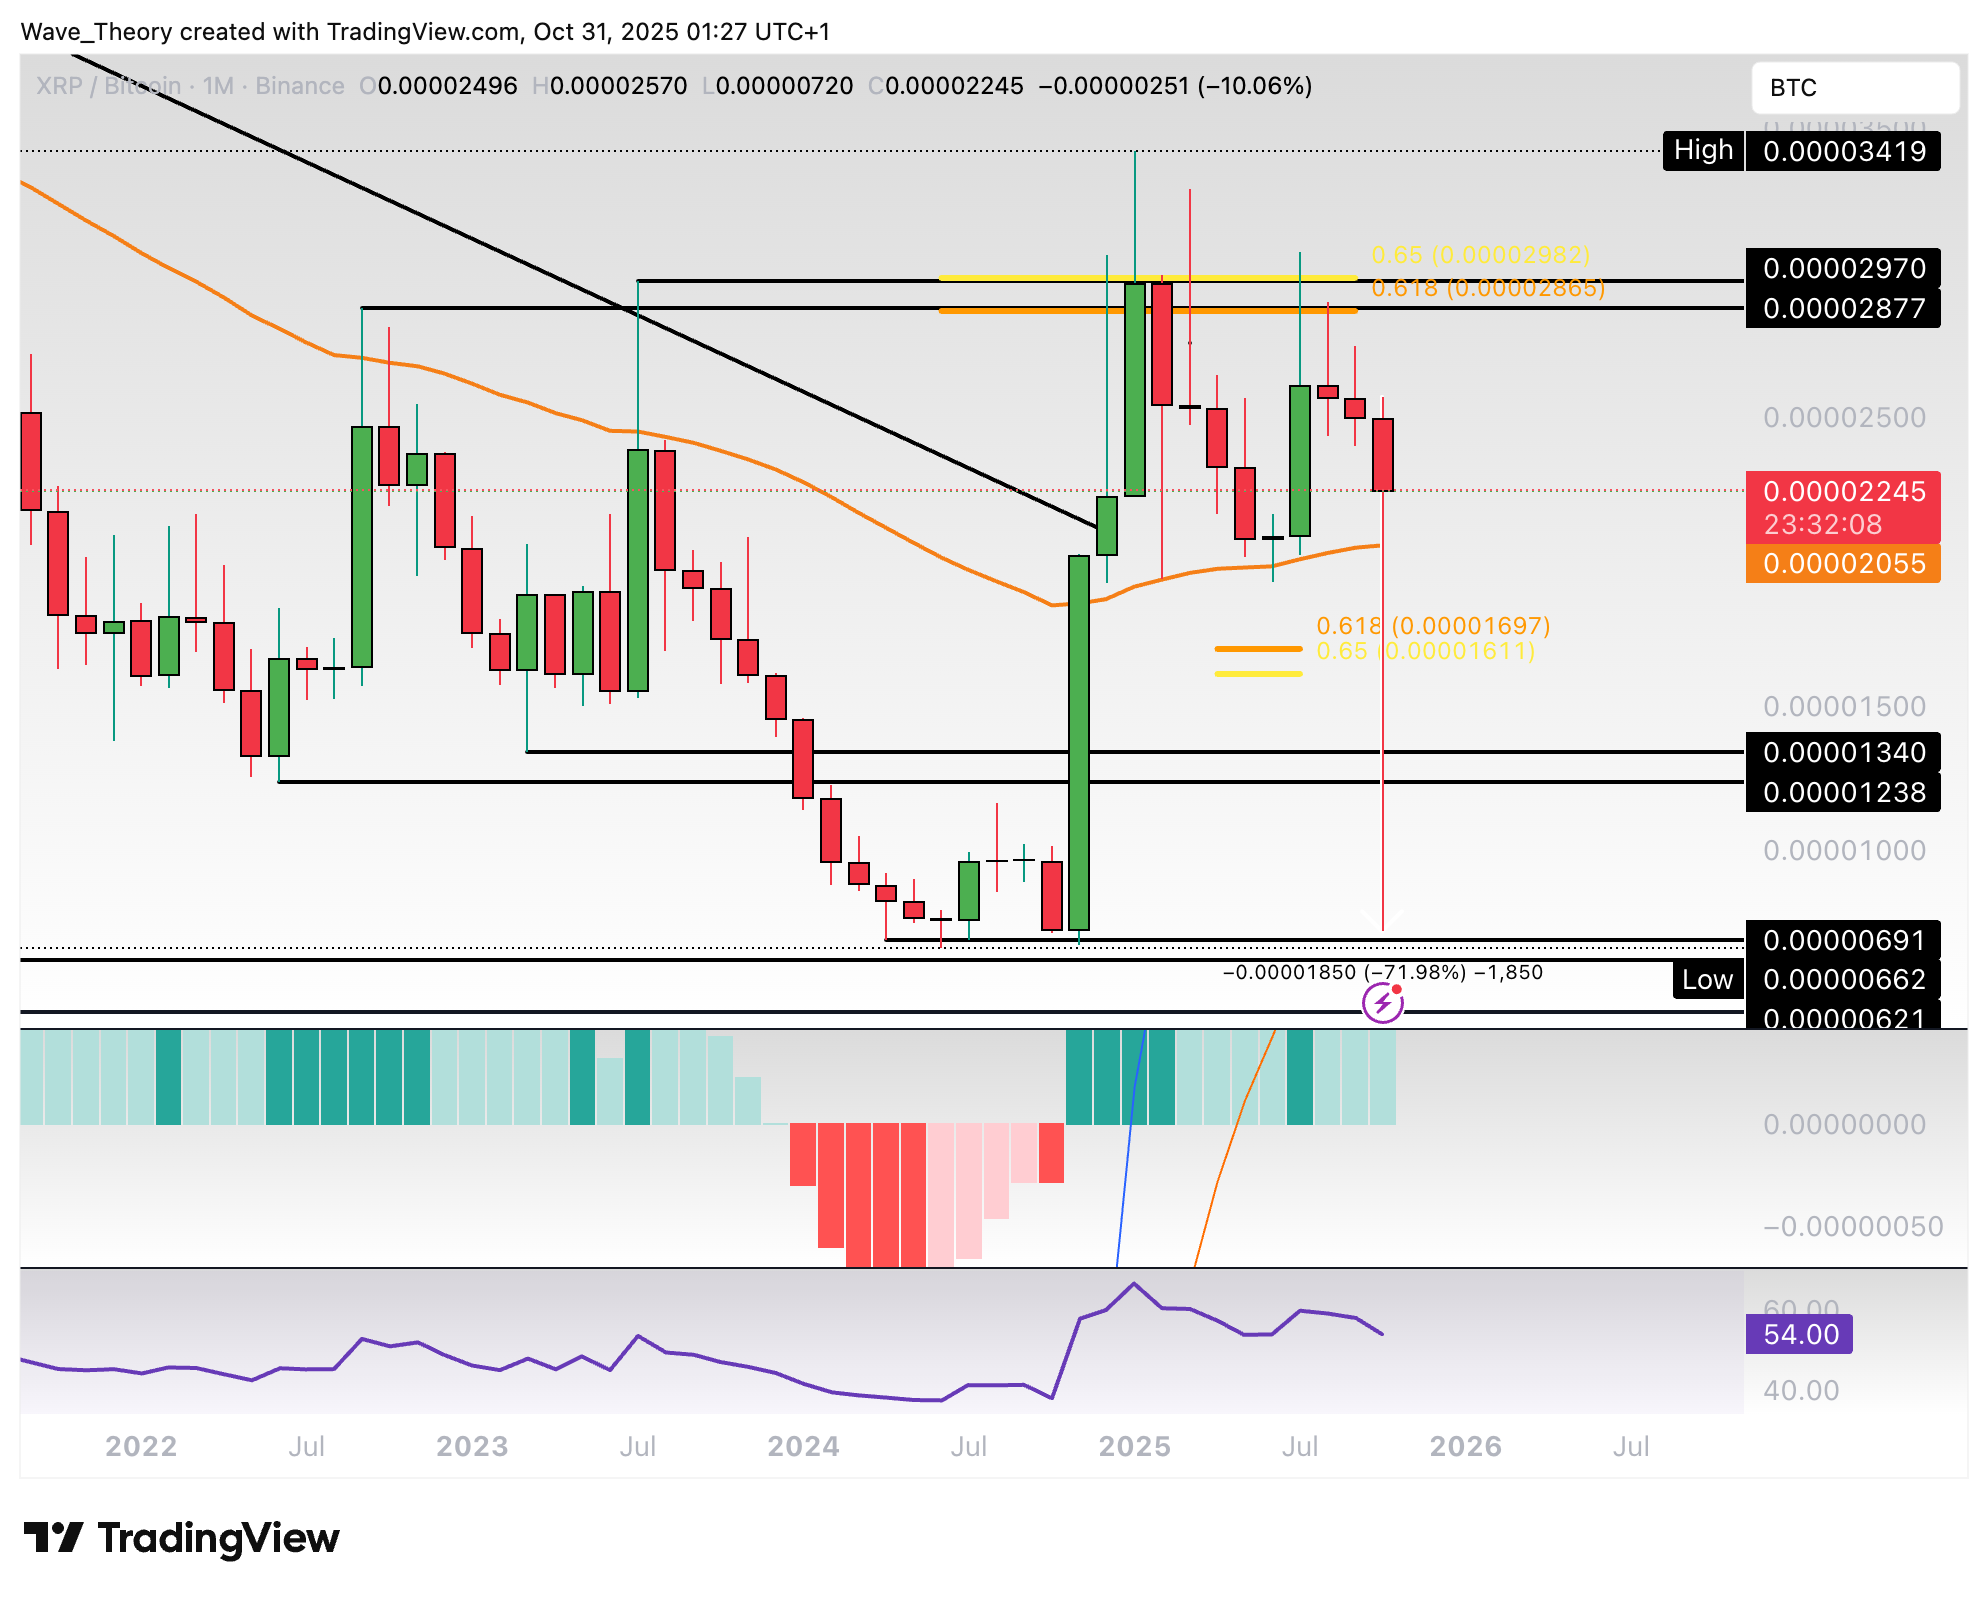
Against Bitcoin, XRP is testing the 50-month EMA at 0.00002 BTC. A hold above this level could spark a rally to 0.000029 BTC (another Golden Ratio resistance). The monthly MACD lines remain bullish, but the histogram’s three-month downtrend warrants caution. For long-term holders, this might represent an accumulation zone before the next halving cycle.
FAQ: Your XRP Questions Answered
What’s the most important level to watch for XRP?
The $2.35 Golden Ratio support is critical. A daily close below could trigger a drop to $1.55, while holding above it may fuel a 22% bounce.
Is the death cross on 4H charts a sell signal?
Not necessarily. Death crosses often lag price action. Watch for follow-through selling or a quick reversal, which WOULD invalidate the bearish signal.
When might XRP see its next major rally?
If Bitcoin’s dominance weakens and altcoin season resumes, XRP could benefit. The 50-week EMA has historically been a launchpad for major moves.
