Bitcoin Price Prediction: Crypto Bear Market Signals Weaken BTC Momentum

Bitcoin's bull run hits a wall—bearish whispers are growing louder.
Technical indicators that once screamed 'buy' are flashing amber. Momentum's fading, and the charts are telling a story of exhaustion. It's not a crash, not yet, but the relentless climb is losing its steam.
The Bear's Shadow Lengthens
Key support levels are getting tested like never before. Each bounce feels weaker than the last, and the trading volume? It's drying up—a classic sign of conviction wavering. The smart money isn't panicking, but it's definitely watching the exits.
What's Killing the Vibe?
It's a perfect storm of macro jitters and crypto-specific fatigue. Global liquidity's tightening, and the 'number go up' machine is sputtering. Even the most ardent crypto bros are starting to check their portfolio less often—never a good sign.
Remember, in traditional finance, a 'correction' is just a polite term for 'we told you this was overvalued, but you didn't listen.'
Where Does BTC Go From Here?
The path forward is murky. A consolidation phase seems inevitable—a period of choppy, sideways action that shakes out weak hands. The next major move hinges on whether institutional buyers step back in or decide to wait for a deeper discount.
One thing's clear: the easy money's been made. The next leg requires real catalysts, not just hype. Buckle up.
Why Bitcoin’s Technical Indicators Are Flashing Warning Signs
On Binance and other platforms, traders rely heavily on tools like moving averages, support and resistance zones, and RSI to track price momentum. As of this week, 25 technical indicators signal bearish trends, while only 6 remain bullish – a clear divergence that hints at further downside.
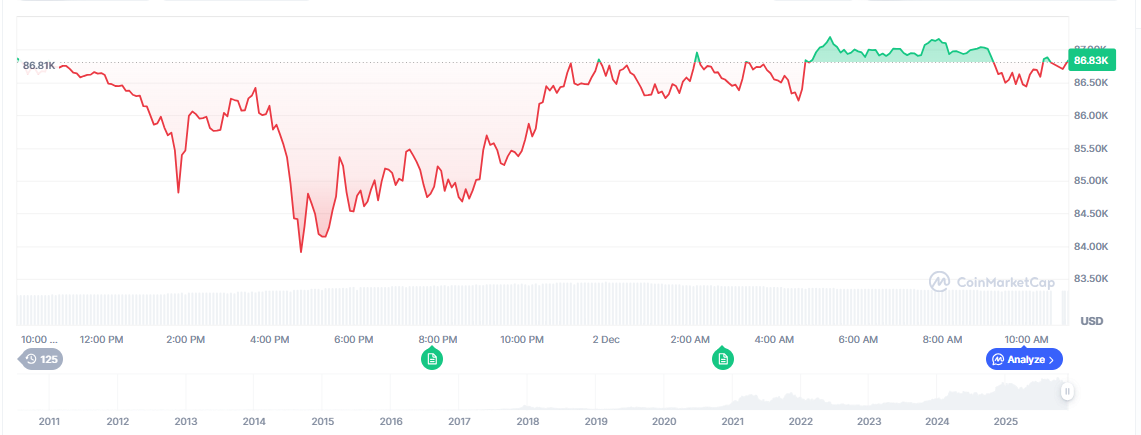
Key support zones, previously holding firm around $88,000, are now showing signs of erosion. If the price breaks below current support, it could slip into the $84K–$82K range.
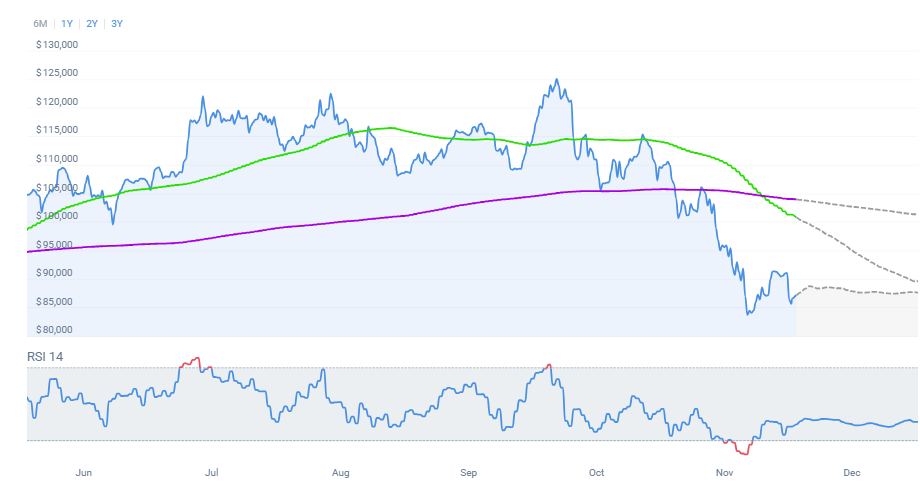
Traders are also watching the 50-day and 200-day moving averages. With BTC now hovering NEAR both, a confirmed break below the 200-day line may signal a deeper pullback.
The Relative Strength Index (RSI) has also been declining steadily, suggesting selling pressure is still present. Fibonacci retracement levels point to possible stabilization near $84,200 – but only if volume picks up and bullish momentum returns.
How to Read Bitcoin Price Charts Right Now
Candlestick analysis reveals a growing number of red-bodied candles closing with long upper wicks – a sign that bulls are losing control near the top of recent ranges. Each failed retest of resistance just under $88,000 creates more uncertainty.
Intraday charts show wicks appearing around $87,000, with low-volume green candles lacking follow-through.
This hints that any positive price action is short-lived. Longer timeframes, such as the daily and weekly charts, also show weakening momentum. If upcoming candles close below the previous lows, traders may interpret this as a continuation of the bear trend.
Until a breakout above the 100-day average or a reversal signal emerges, the bearish structure remains intact.
Macro & Sentiment Factors Influencing BTC Forecasts
Bitcoin’s future is not shaped by charts alone. Macroeconomic factors, including global interest rate policy and crypto regulation updates, weigh heavily on short-term outlooks.
At the moment, investor confidence is being held back by speculation around stricter U.S. compliance rules and delays in ETF approvals.
On-chain activity has also shown signs of cooling. Fewer active addresses, lower transaction volumes, and stagnant miner inflows indicate a lull in usage. Add in negative sentiment cycles on crypto social media, and the pressure on BTC remains high.
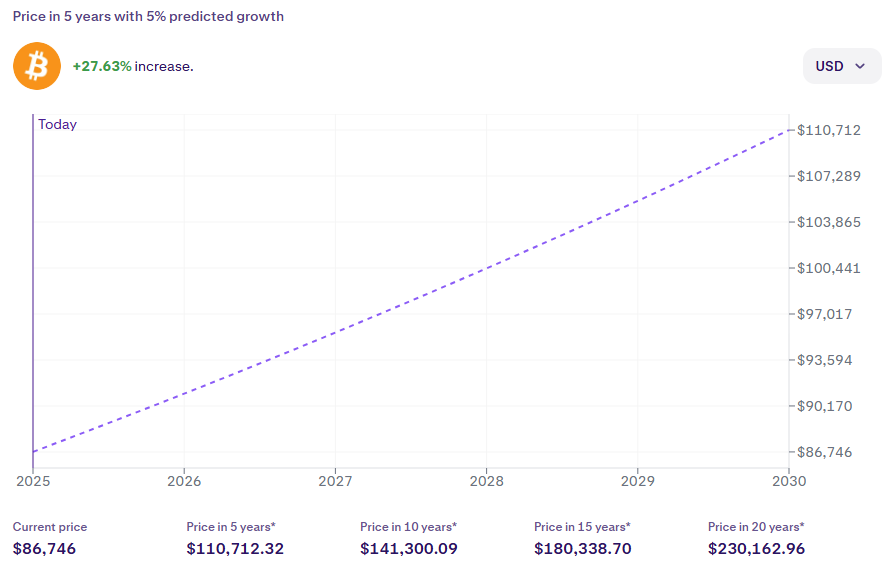
Still, long-term models remain cautiously optimistic. Predictions estimate $91,083.30 in 2026, rising to $110,712.32 by 2030, assuming broader adoption and favorable market cycles. But for now, the weight of short-term fear is tilting the needle toward the bears.
Bitcoin Hyper Emerges as a Fallback as BTC Wavers

With Bitcoin struggling to regain momentum, some traders are reallocating funds into high-upside tokens like Bitcoin Hyper, which is gaining attention for its explosive early-stage growth after the Bitcoin price prediction.
Currently valued at just $28.8 million, Bitcoin Hyper presents a fraction-of-a-percent market cap compared to BTC – a setup that attracts speculators in search of 10x–100x returns.
As capital flows shift during bear phases, presale projects often see renewed momentum due to low entry points and fixed early-stage pricing.
The growing interest in Bitcoin Hyper comes not just from price speculation, but from its design as a “Bitcoin alternative” with a different token supply model, liquidity locks, and community-driven incentives.
Many early movers are treating it as a high-leverage hedge while BTC continues to underperform expectations.
Buy Bitcoin Hyper Here
The post Bitcoin price prediction – Crypto Bear Market Signals Weaken BTC Momentum appeared first on icobench.com.
