Bitcoin Bloodbath: Over $1B Liquidated in Epic Leverage Flushout

Bitcoin just gave over-leveraged traders a billion-dollar reality check.
The Great Flushout
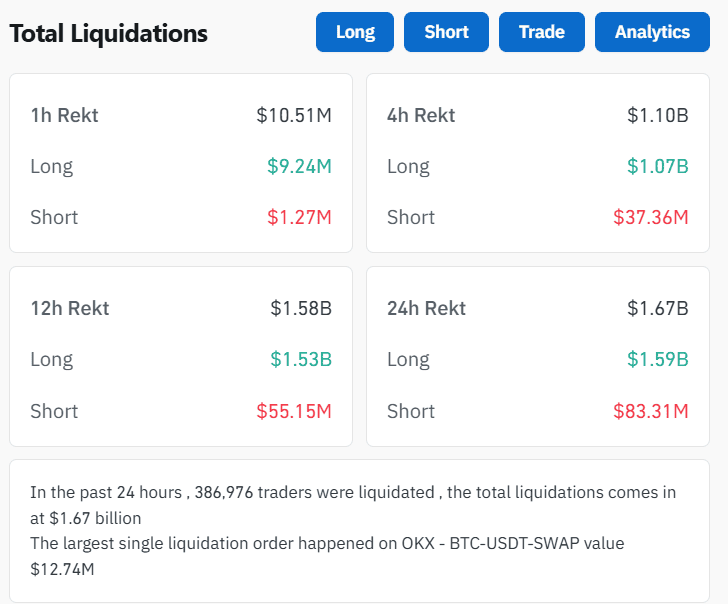
Liquidations hit staggering proportions as the market purged speculative excess. Exactly $1,000,000,000 vanished from leveraged positions in a single cleansing event that reshuffled the deck.
Margin calls echoed across exchanges while perpetual swap funding rates normalized—classic signs of market health restoration. This isn't a crash; it's a necessary reset that separates disciplined holders from reckless gamblers.
Smart money saw this coming from miles away. When everyone's leveraged to the tits, even minor volatility triggers cascading margin calls. The system works exactly as designed—punishing greed and rewarding patience.
Another day, another reminder that crypto markets eat overconfident traders for breakfast. The billion-dollar question: who learned their lesson versus who's already re-leveraging?
So will Bitcoin’s bullish rally continue?
While long term structures are not threatened, short term signals are mixed. Let’s dive in.
Bitcoin daily chart technical analysis
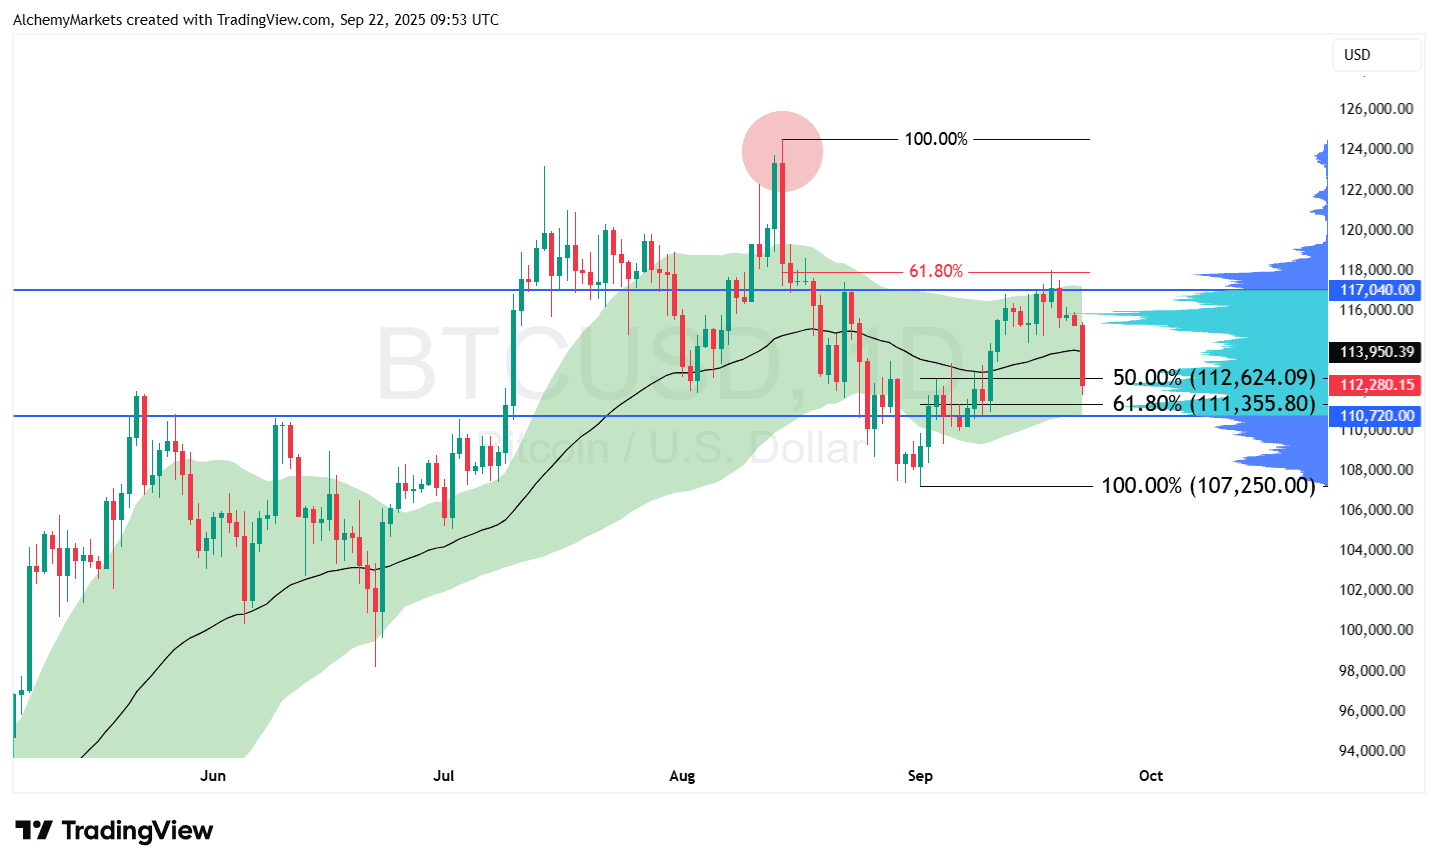
Bitcoin rejected at the 61.8% bearish Fibonacci retracement, forming a lower high. That’s a bearish warning. But so far, the price hasn’t printed a clean lower low — so the structure hasn’t fully rolled over.
The daily 50-EMA band (±1 stdev) is holding up as dynamic support. Historically this band has performed as a decent safety net.
If Bitcoin holds above $110,720 (lower stdev of 50-EMA), bulls have room to push towards the 50 EMA near $113,955, and maybe even to the value area high at $117,040.
If the band gives way, BTC likely slides to retest $107,250, the August low. That WOULD confirm the late-August breakdown as a trend shift.
BTC is sitting right at two critical Fib retracements, both overlapping with high-volume nodes on the anchored volume profile (set from the August 14th peak):
-
50% retracement: $112,624.
-
61.8% retracement: $111,356.
These zones could generate a bullish reaction due to their historical volume and fibonacci significance, but beyond that, we have $110,720 — which is the bottom of the 50-EMA band and the value area low.
Lose that area, and bitcoin could see deeper corrections towards even the $97K.
The bottom line
Yes — $1.59B in long liquidations confirms it.
Not yet. BTC needs to defend the Fib + EMA confluence around $111–$112k.
-
Bullish = defend support, target 113.9k → 117k.
-
Bearish = crack 110.7k, target 107.2k.
This flushout may have flushed out weak hands, but whether it marks a bottom depends entirely on how Bitcoin reacts at these nearby supports. The critical deciding factor is that Bitcoin holds the bottom of the green bands on the daily timeframe, and that aligns with the value area low of $110,720.
