Crypto Carnage: $630M Wiped Out in Liquidations as Metaplanet Scoops Up 5,419 BTC Amid Market Bloodbath

Crypto markets just got rocked—hard. Over $630 million evaporated in liquidations as prices tanked across the board. Traders got wrecked while institutions stayed hungry.
Metaplanet's Massive Bitcoin Bet
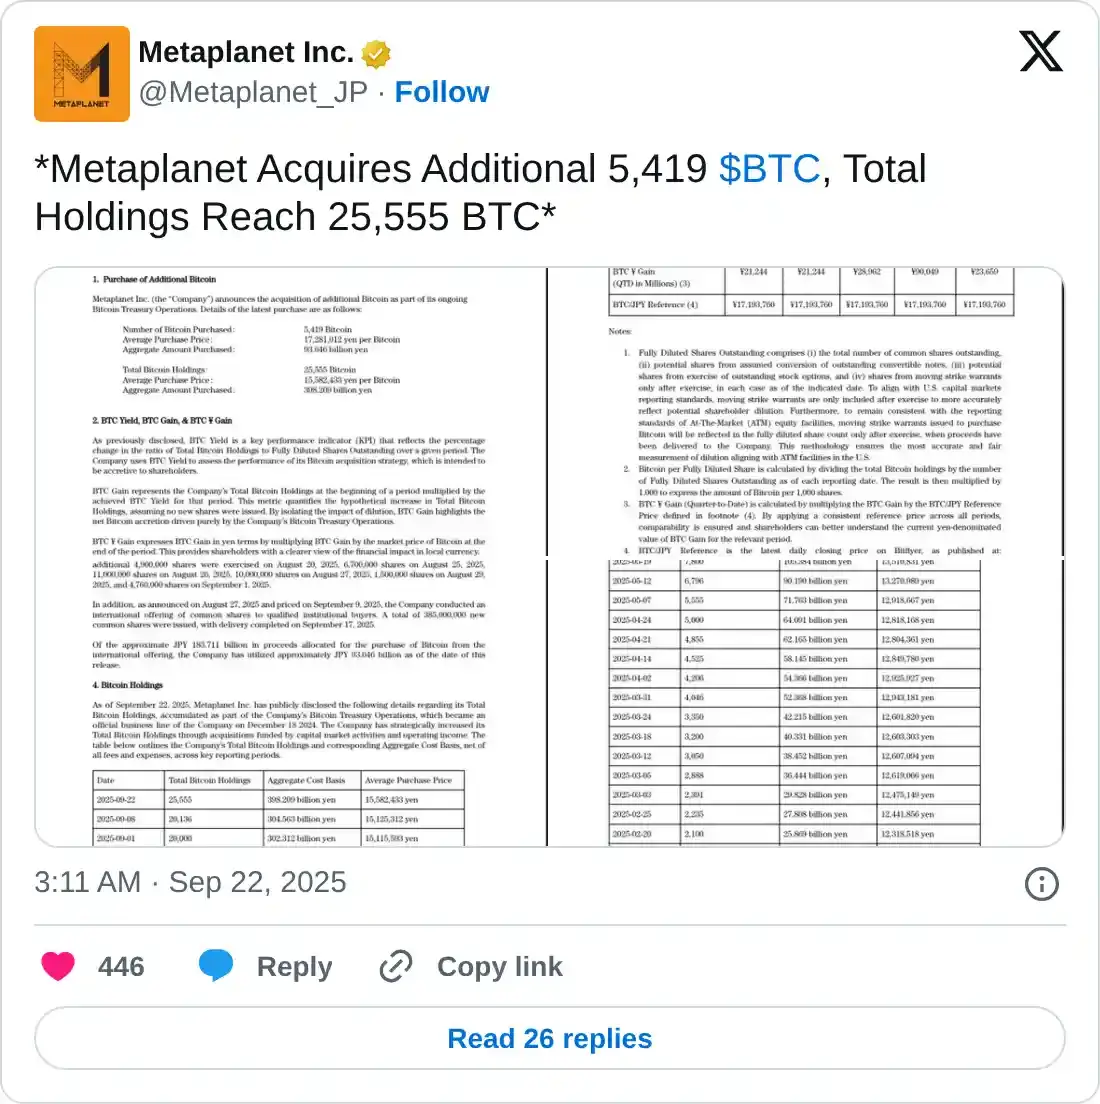
Not everyone's panicking. Japanese investment firm Metaplanet just loaded up—adding another 5,419 BTC to its treasury. That’s a serious vote of confidence while everyone else is sweating.
Smart money moves while weak hands fold. Classic crypto—where fortunes vanish in minutes and the bold stack sats while traditional finance still tries to short innovation. Guess who’s winning?
Over 218,000 traders were liquidated in the last 24 hours
The week started with a negative tone for the cryptocurrency market, with major crypto such as Bitcoin (BTC) falling below $115,000 during the early Asian trading session on Monday. Altcoins, such as Ethereum (ETH), Ripple (XRP), and Solana (SOL), experienced a pullback, while meme coins suffered deeper losses.
This sudden pullback sparked a wave of liquidations across the market, with over 218,000 traders liquidating positions worth more than $630 million in the last 24 hours, according to Coinglass data. Notably, 89% were long positions, underscoring the market’s overly bullish positioning. The largest single liquidation occurred on Binance, where a BTCUSD position worth $12.66 million was liquidated.
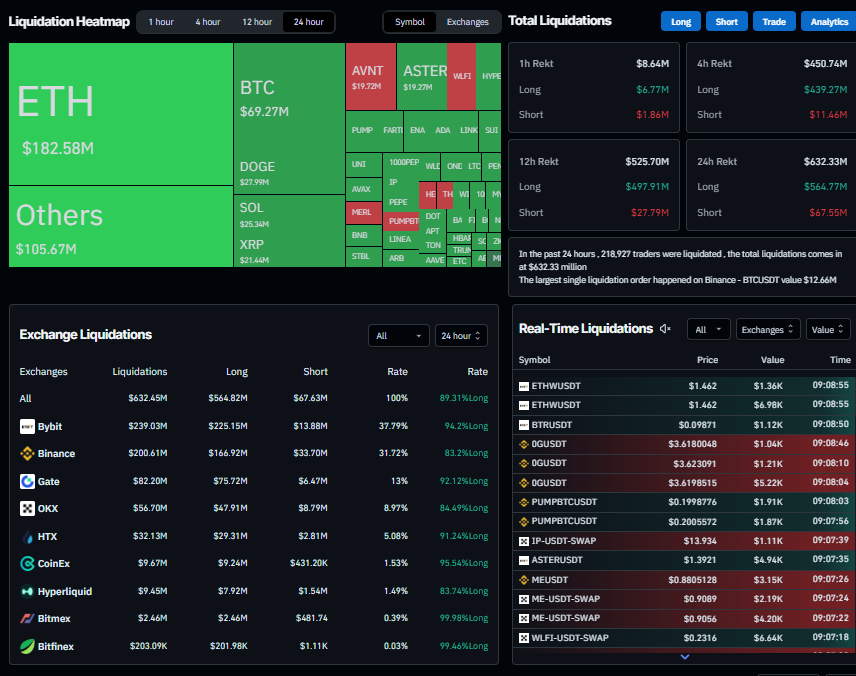
Liquidation Heatmap chart. Source: Coinglass
Metaplanet adds 5,419 BTC to its treasury
Despite this price drop, Bitcoin institutional demand started the week on a positive note. Japanese investment firm Metaplanet announced on Monday that it has purchased an additional 5,419 BTC, bringing the total holding to 25,555 BTC.
However, traders should still be cautious as the BTC daily chart below shows that it hovers around key support at $114,009, its 50-day Exponential Moving Average (EMA). A firm close below this support zone could extend further losses on BTC and the broader crypto market.
Additionally, the Relative Strength Index (RSI) on the daily chart is slipping below its neutral level of 50, indicating early bearish momentum. The Moving Average Convergence Divergence (MACD) is also converging and is about to flip to a bearish crossover, further supporting the bearish view.
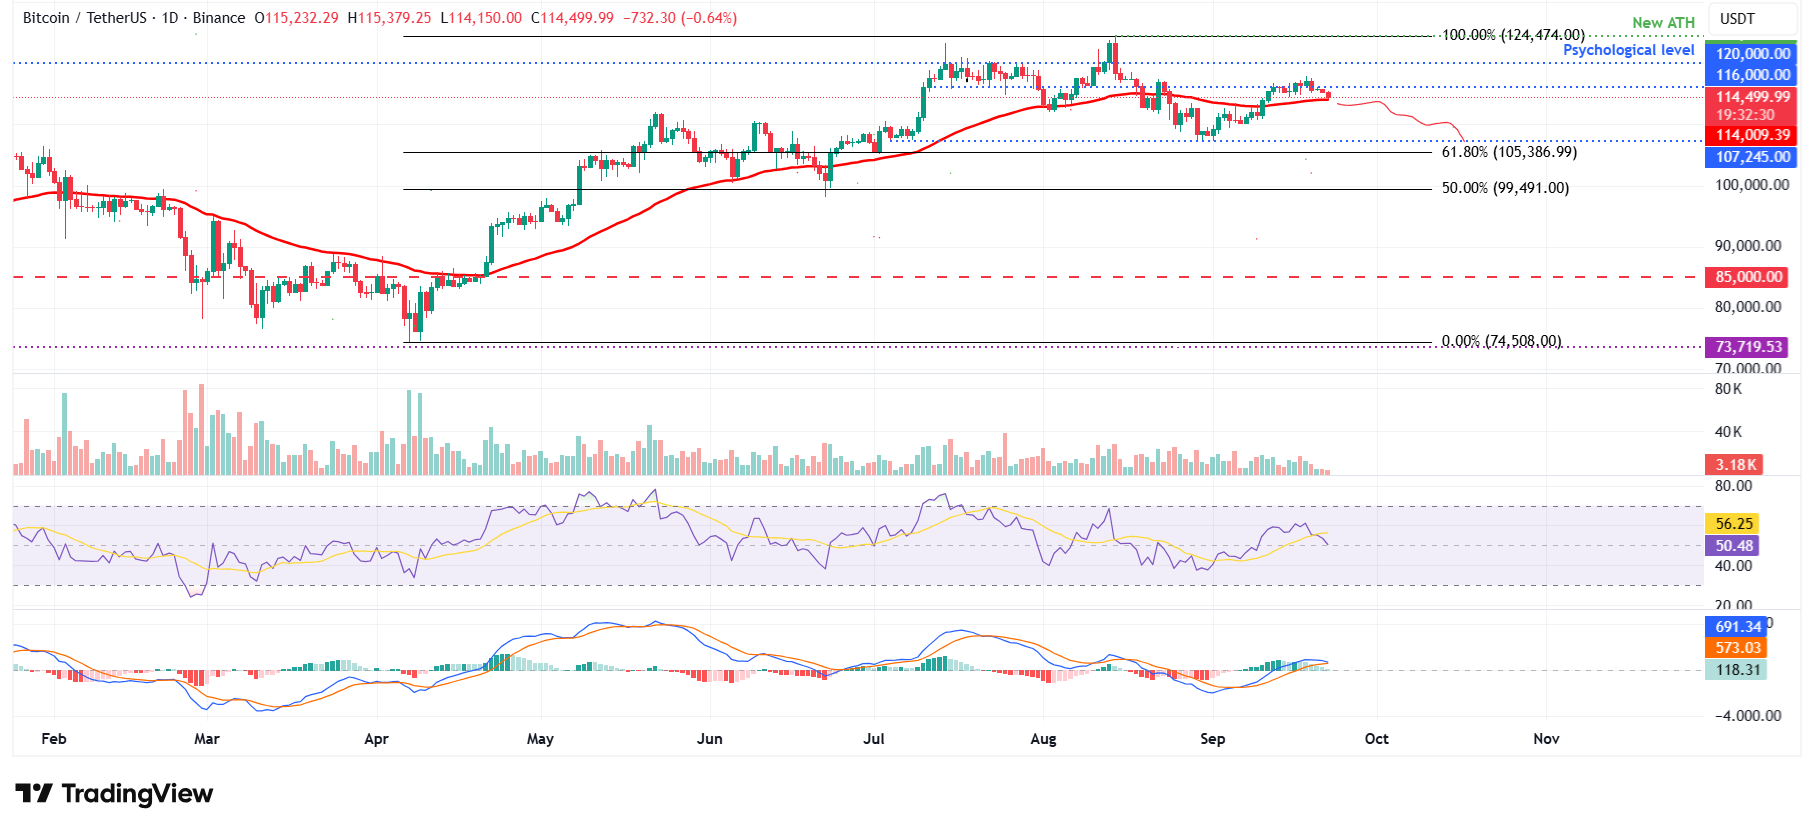
BTC/USDT daily chart
