SKY Price Forecast: Record Revenue Ignites Bullish Surge Potential

SKY just shattered revenue records—and the charts are screaming bullish.
Breaking Through Resistance
Skyrocketing fundamentals meet technical momentum as SKY posts unprecedented financial performance. The numbers don't lie—this isn't just another pump story.
Market Momentum Building
Traders are positioning for what could be the next major breakout play. When revenue hits these levels, price typically follows—though Wall Street analysts will probably still call it 'speculative' while quietly loading their bags.
The crypto winter thaw continues, and SKY's heating up faster than most. Time to see if the charts back up the hype.
Record high quarterly revenues, token upgrade deadline sparks demand for SKY
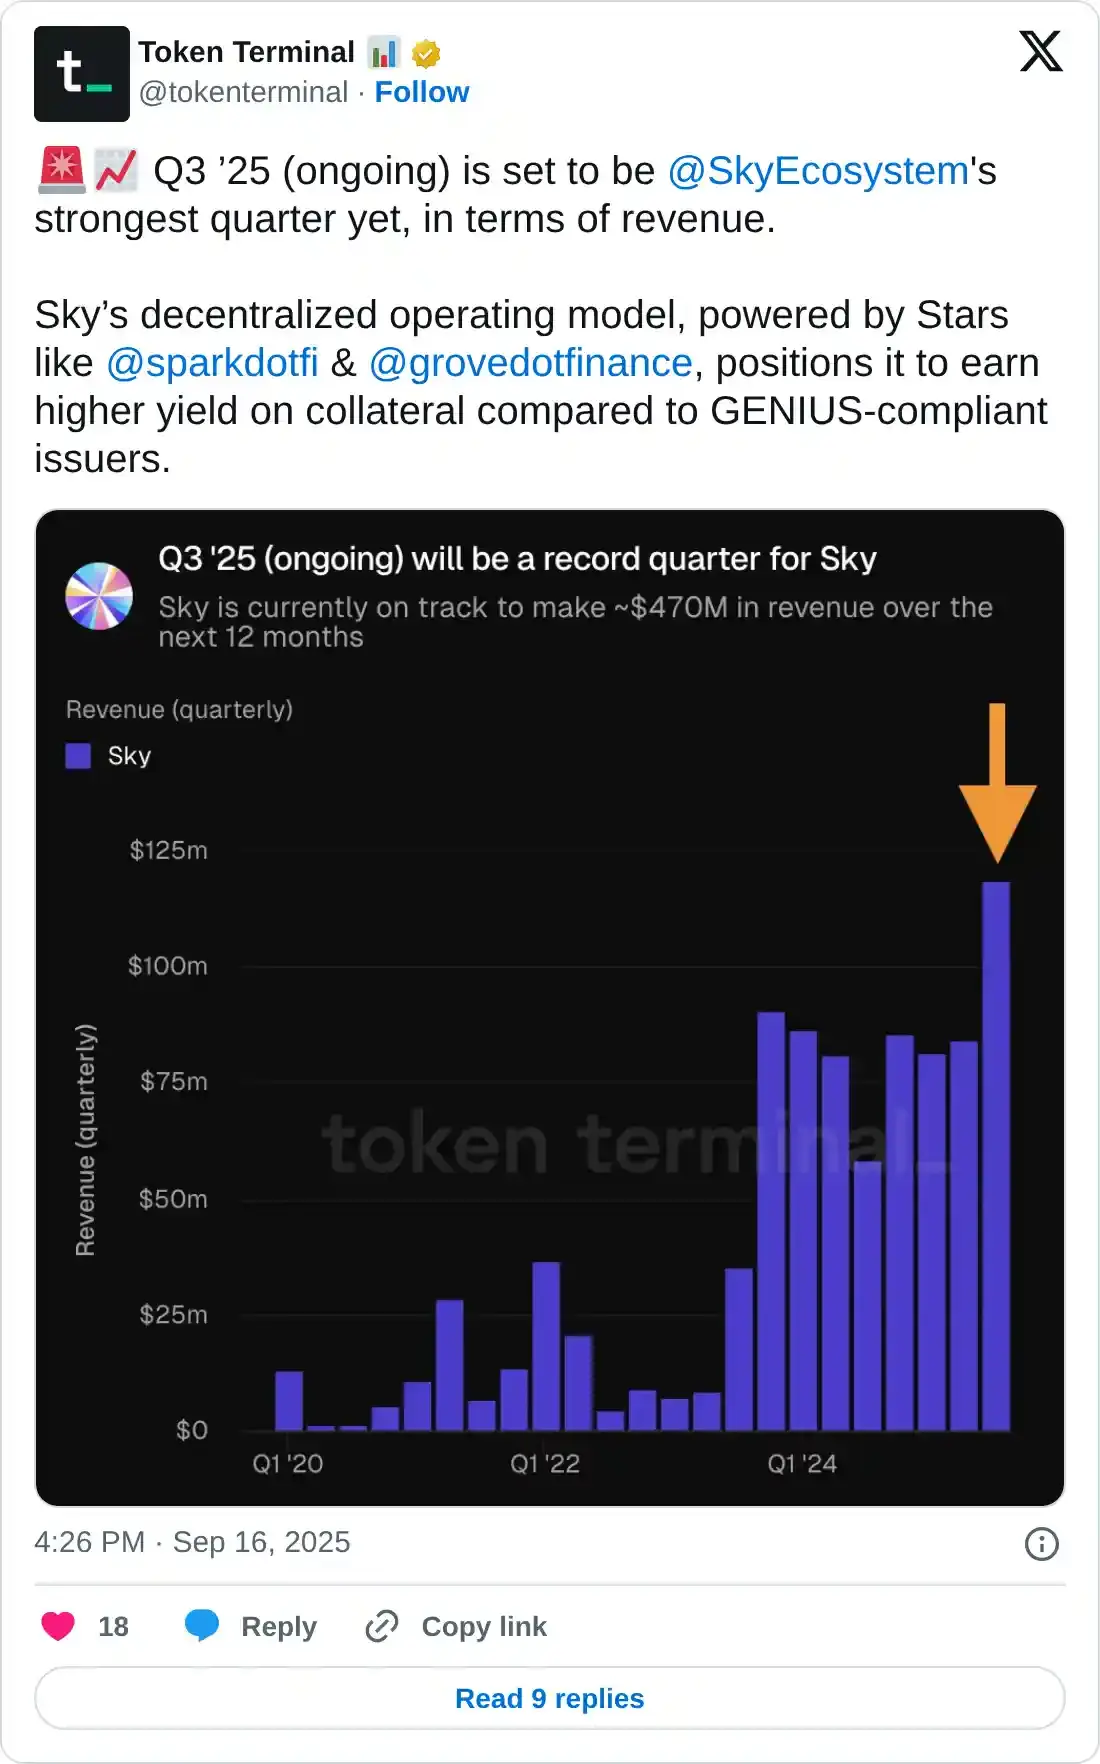
Token Terminal, an on-chain analytics platform, shared that the quarterly revenues of Sky protocol have surpassed the $100 million milestone so far in Q3. This will mark the strongest quarter based on revenue, driven by top performers such as Spark.Fi and Grove.Finance. If the Sky protocol holds steady growth, it is projected to make almost $470 million in revenue over the next 12 months.
Adding to the demand surge, the deadline to convert the previously held MKR to SKY at no extra cost is on Thursday. However, a community voting on Thursday could impose penalty fees of roughly 1%, which WOULD reduce the amount of SKY received for each converted MKR, taking effect on Monday. The delayed upgrade penalty would continue to increase by 1% every three months until it reaches 100% by 2050.
Currently, 78.13% of MKR tokens have been upgraded to SKY, representing a 7.67% increase over the last 24 hours.
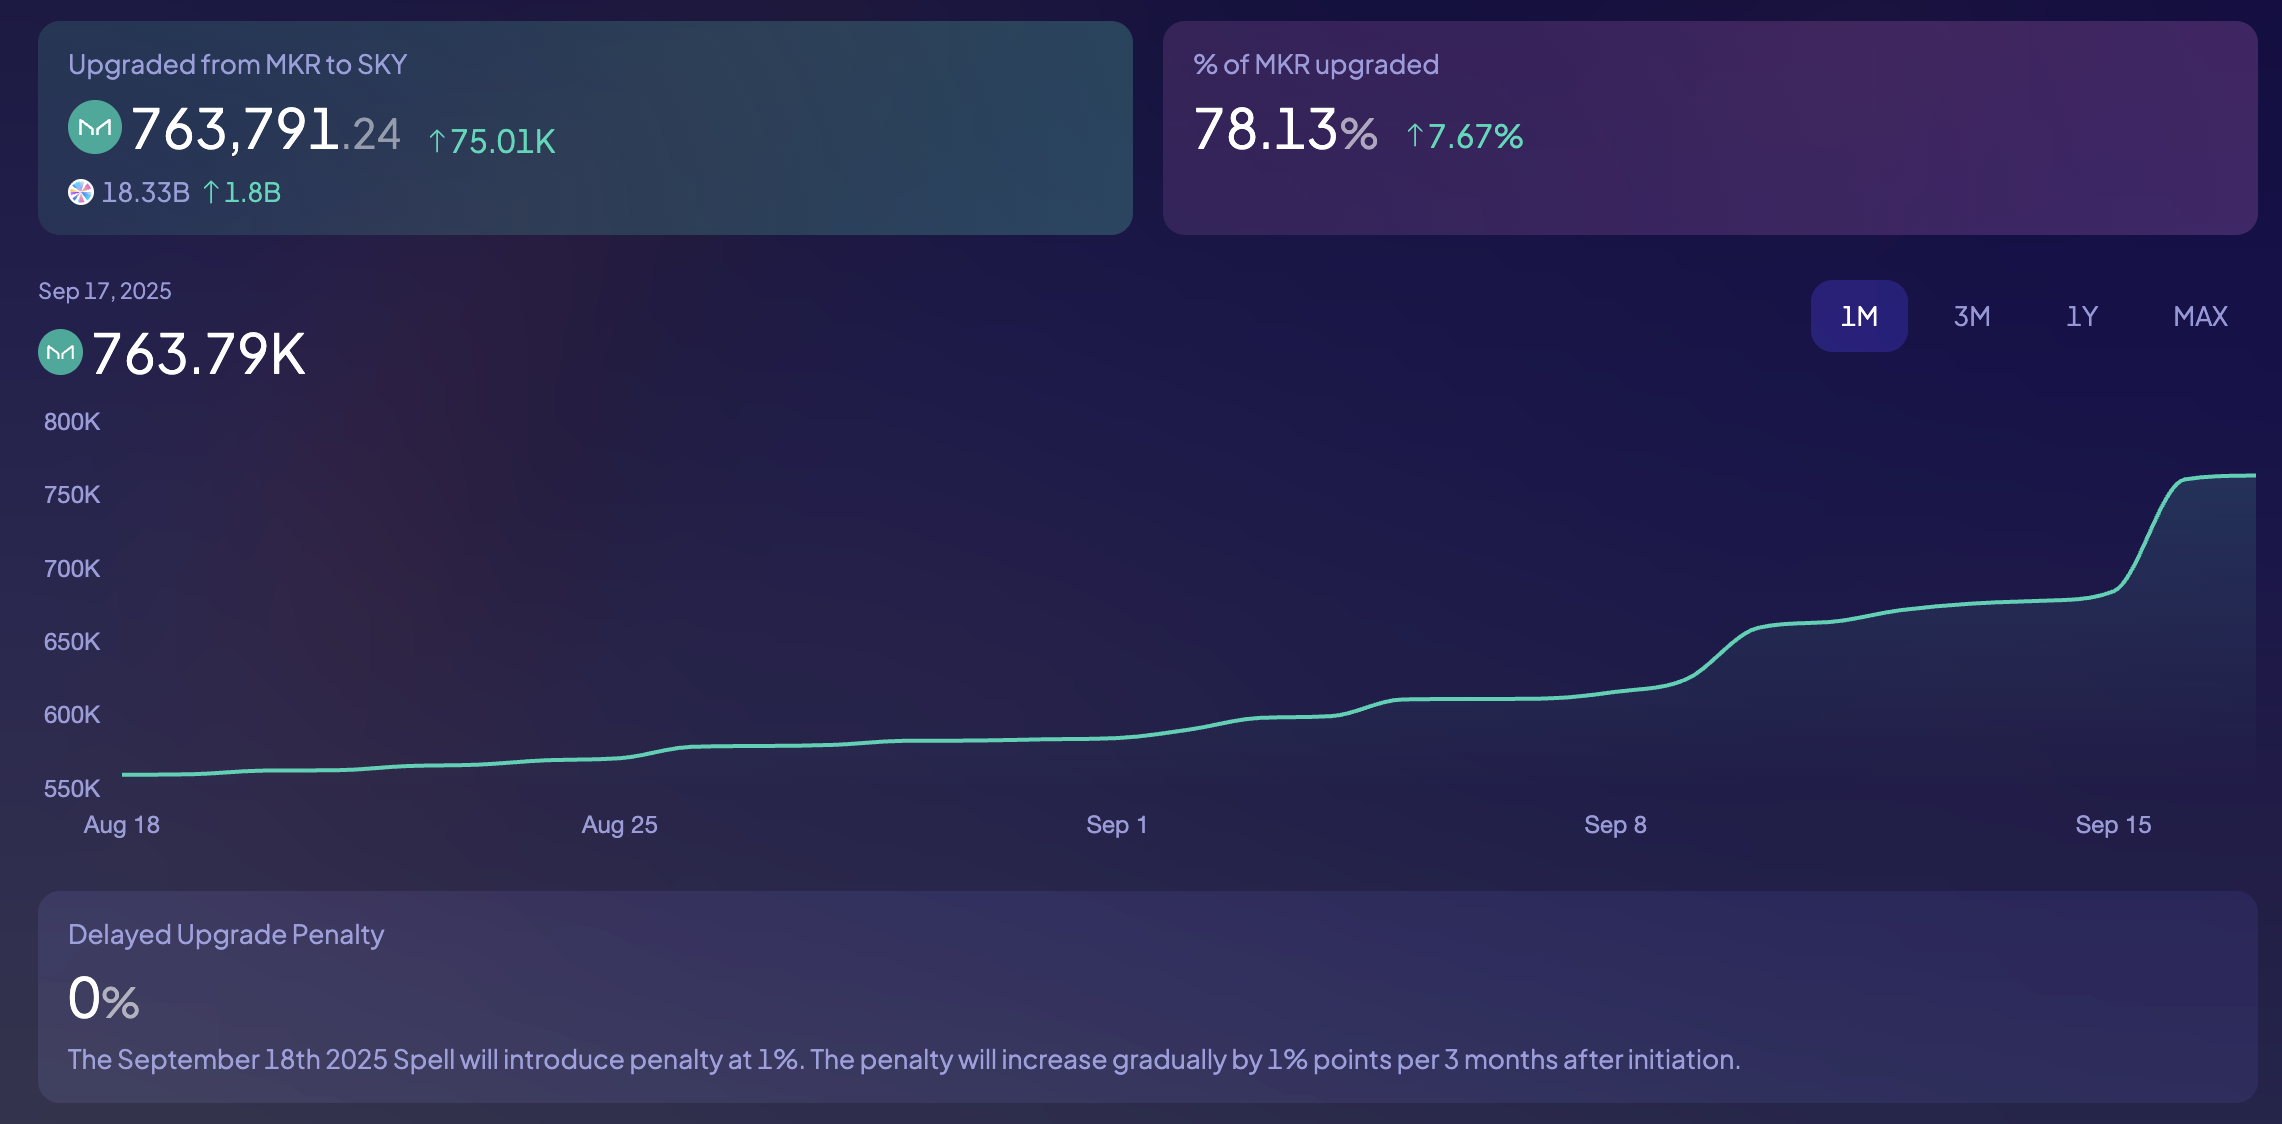
MKR to SKY upgrade. Source: Sky ecosystem
SKY recovery run gains bullish momentum
Sky adds over 5% gains so far on Wednesday, building on the 1.64% rise from Tuesday. The short-term recovery from the 200-day EMA challenges the R1 pivot level at $0.08213, which is acting as the immediate resistance.
A decisive close above this level could flash the R2 pivot level at $0.10002 as the next potential target on the bullish radar.
SKY’s bounce back from the 200-day EMA marks a positive shift in momentum indicators on the daily chart. The Relative Strength Index (RSI) at 59 rises from the halfway line, suggesting an increase in buying pressure with more space to grow before reaching overbought conditions. Additionally, the Moving Average Convergence Divergence (MACD) and its signal line enter the positive territory above the zero line, which indicates a recovery in bullish momentum.
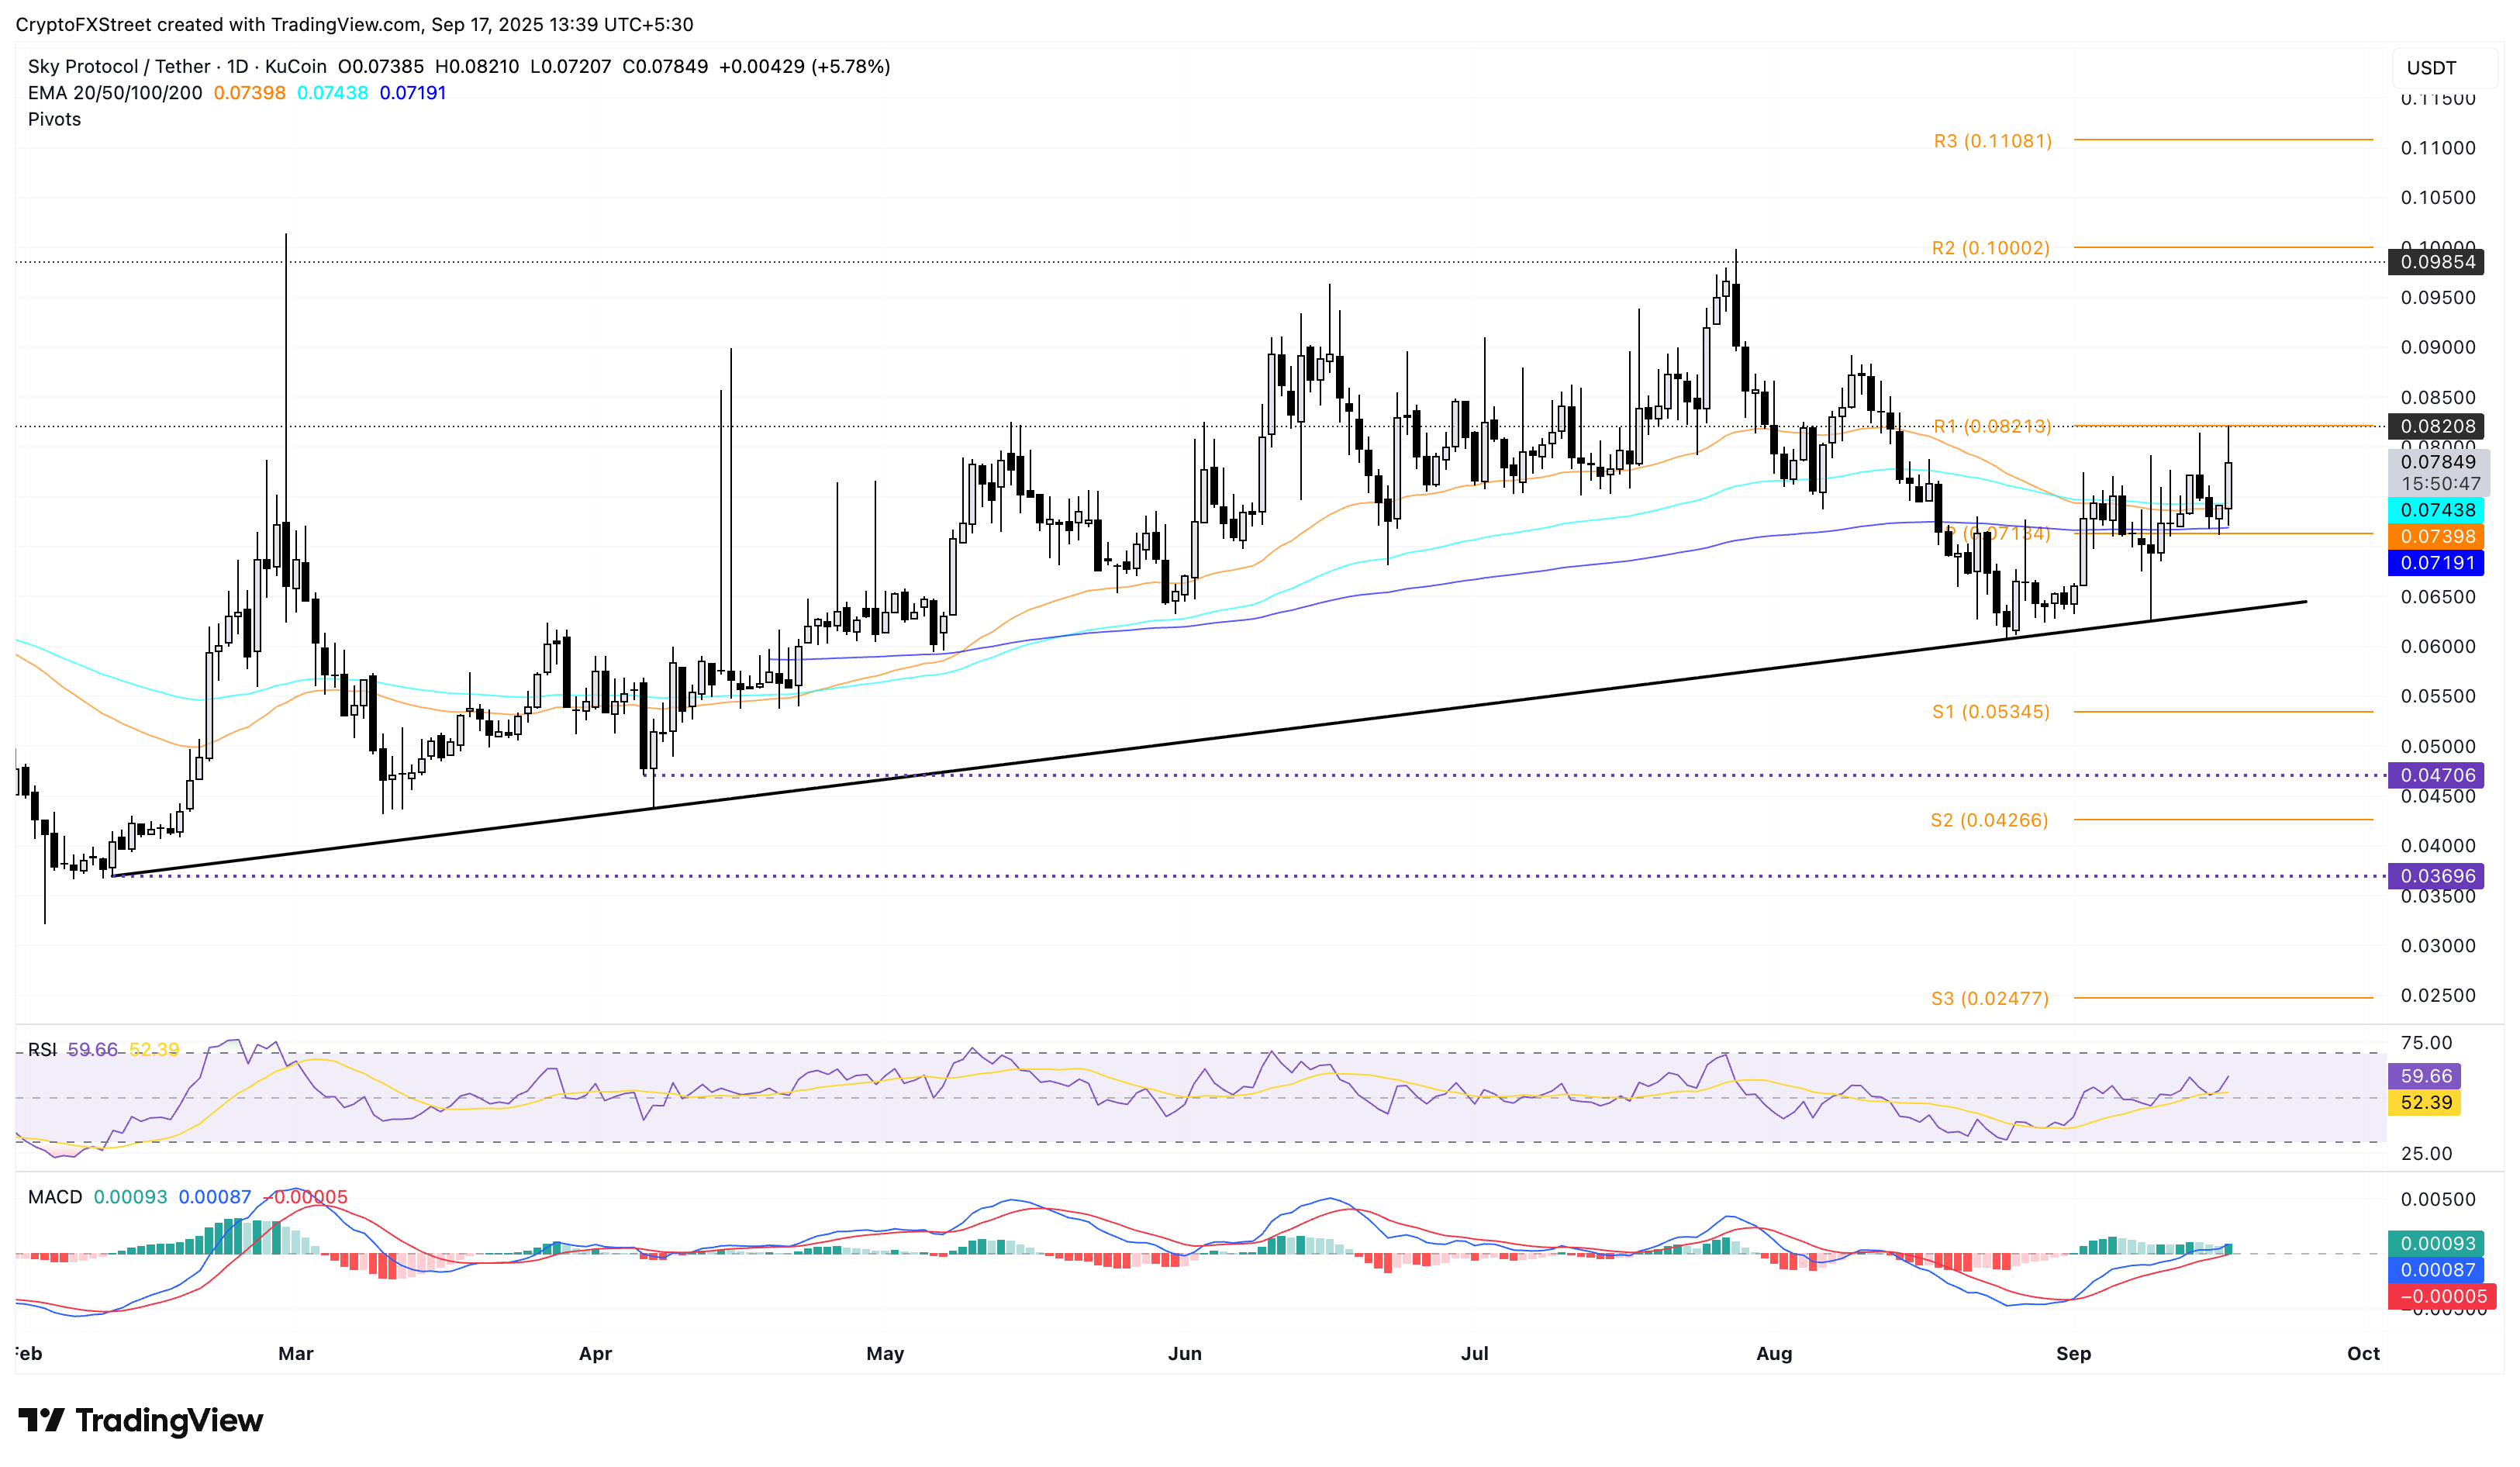
SKY/USDT daily price chart.
On the other hand, if SKY fails to hold above the 200-day EMA at $0.07191, it could test a long-coming support trendline, formed by connecting the lows of February 10 and April 7, below $0.06500.
