Pi Network Price Forecast: Channel Breakout Rally Hangs on Critical Retest

Pi Network's price action hits make-or-break moment as retest threatens channel breakout momentum.
Technical Tension Mounts
PI faces decisive test at channel support—break below could unravel recent gains while holding sparks next leg up. Trading volume patterns suggest institutional interest brewing beneath the surface.
Market Psychology at Play
Retests separate weak hands from diamond hands. Current price action mirrors classic accumulation phases seen in early Bitcoin cycles—though skeptics might call it another 'vaporware coin finding its floor.'
Breakout or Breakdown?
All eyes on whether PI defends this level. Successful hold could trigger 20-30% surge toward next resistance. Failure risks 15% drop to seek real demand—because nothing tests conviction like a chart threatening to invalidate your entire thesis.
Market sentiment at hold
The broader cryptocurrency market sentiment remains steady, anticipating a potential 25 basis points rate cut at the US FOMC meeting on Wednesday. CoinMarketCap’s Crypto Fear and Greed Index at 50 remains neutral, suggesting that the investors are taking a wait-and-see approach. Such a period of stillness in market activity puts the Pi Network at risk of losing bullish momentum.
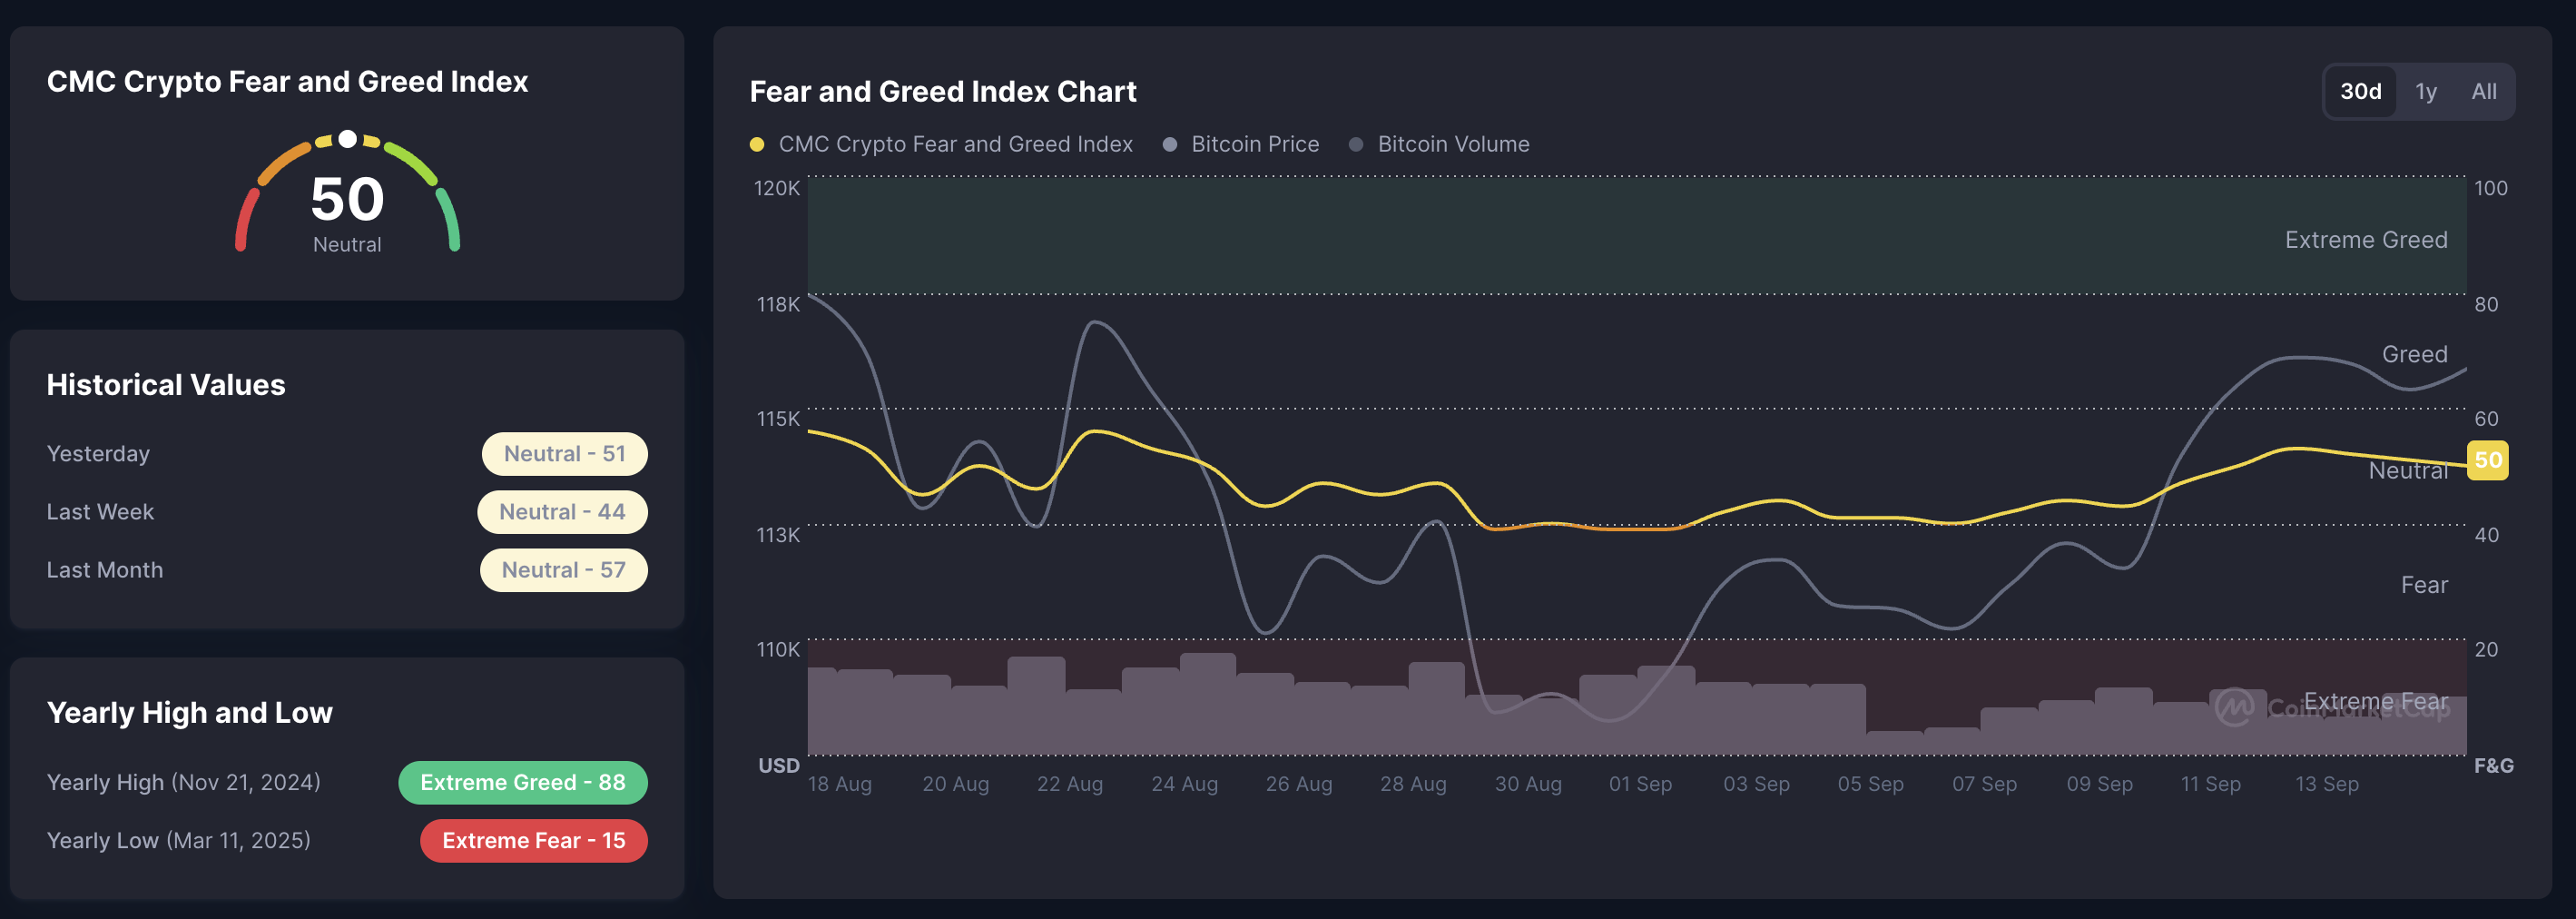
Crypto Fear and Greed Index. Source: CoinMarketCap
Pi Network’s crucial resistance emerges at the 50-day EMA
Pi Network edges lower by almost 1% at the time of writing on Tuesday, retracing from the intraday high of $0.3643. This results in a retest of a broken falling channel’s resistance trendline on the daily chart, acting as the crossroads for the mobile mining cryptocurrency.
If PI bounces back from $0.35, it should surpass the 50-day Exponential Moving Average (EMA) at $0.3805 to enforce an uptrend. This dynamic resistance has remained intact since May 21, providing four bearish reversal points. A decisive close above the 50-day EMA could target the R1 pivot level at $0.4437.
Adding to the upside potential, the technical indicators suggest that the bulls hold trend control on the daily chart. The Relative Strength Index (RSI) at 48 moves sideways, close to the halfway mark, flashing a neutral signal.
However, the Moving Average Convergence Divergence (MACD) and its signal line hold a steady upward trend amid successive green histogram bars, indicating steady bullish momentum.
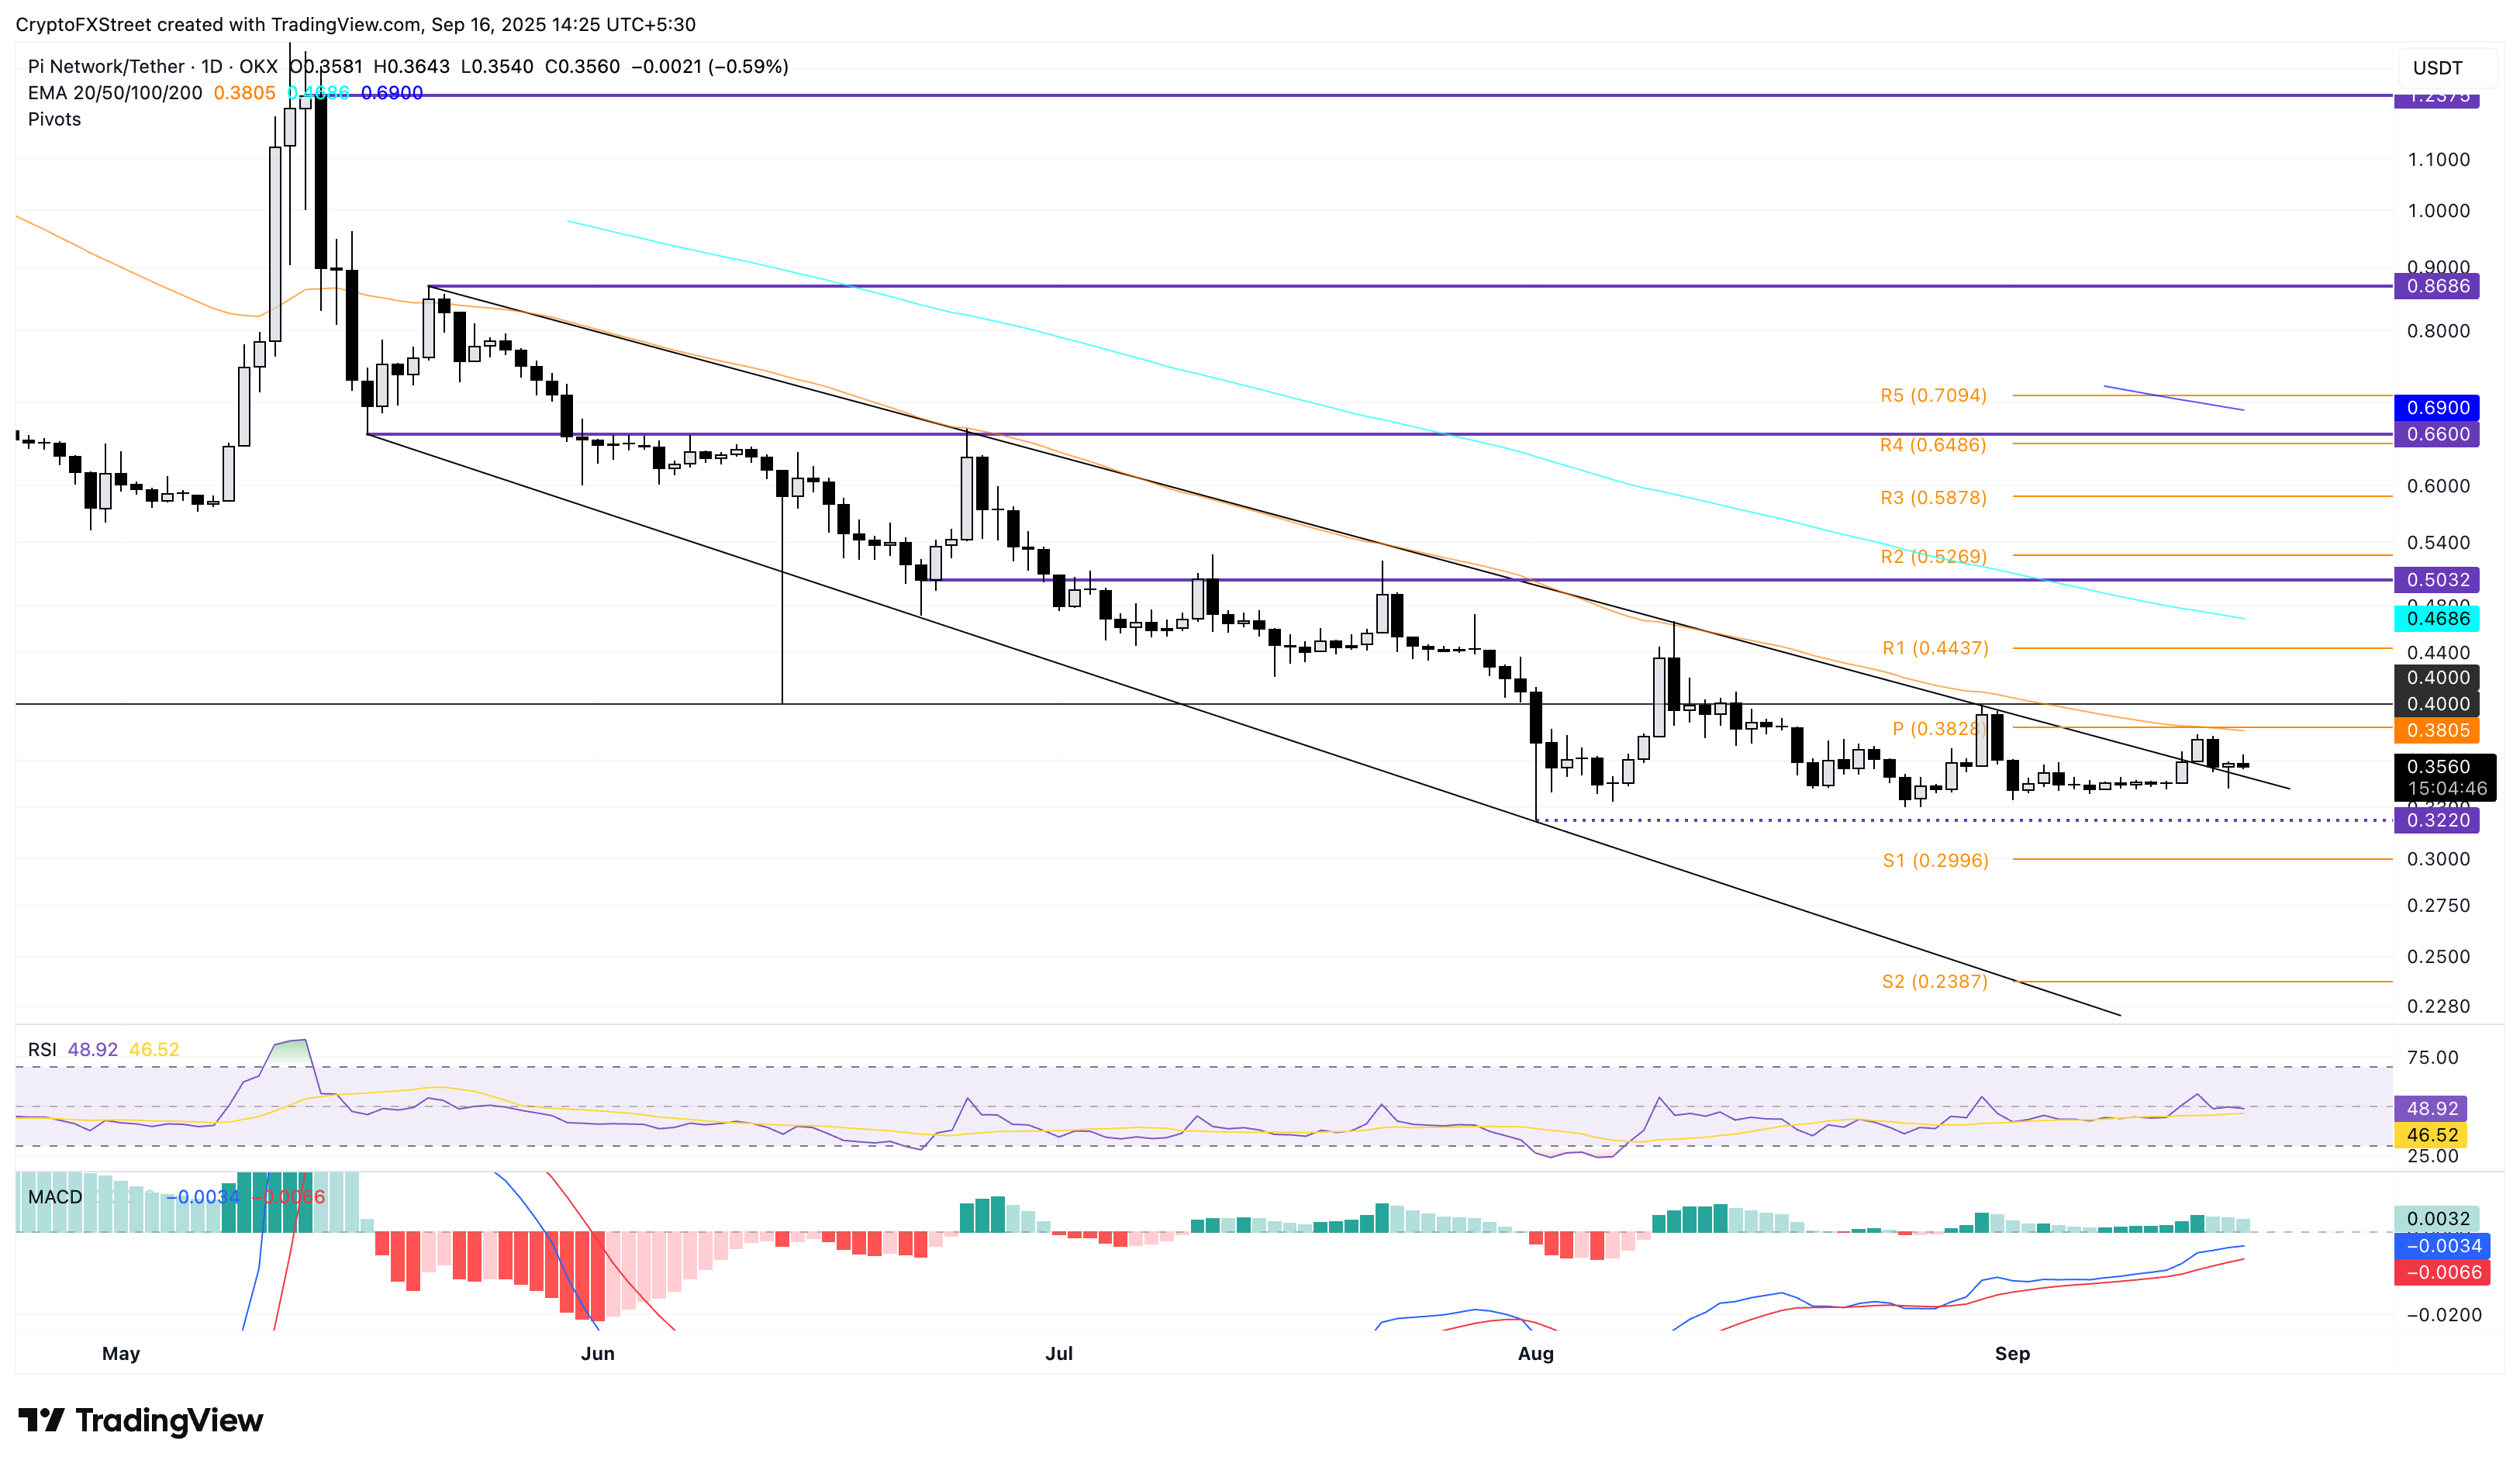
PI/USDT daily price chart.
On the contrary, if PI fails to hold the broken trendline at $0.3500 round figure, it could result in a new bearish pressure to the record low of 0.3220 set on August 1. Further down, the pivot levels highlight the next supports at the S1 and S2 levels at $0.2996 and $0.2387, respectively.
Bitcoin, altcoins, stablecoins FAQs
What is Bitcoin?
Bitcoin is the largest cryptocurrency by market capitalization, a virtual currency designed to serve as money. This form of payment cannot be controlled by any one person, group, or entity, which eliminates the need for third-party participation during financial transactions.
What are altcoins?
Altcoins are any cryptocurrency apart from Bitcoin, but some also regard ethereum as a non-altcoin because it is from these two cryptocurrencies that forking happens. If this is true, then Litecoin is the first altcoin, forked from the Bitcoin protocol and, therefore, an “improved” version of it.
What are stablecoins?
Stablecoins are cryptocurrencies designed to have a stable price, with their value backed by a reserve of the asset it represents. To achieve this, the value of any one stablecoin is pegged to a commodity or financial instrument, such as the US Dollar (USD), with its supply regulated by an algorithm or demand. The main goal of stablecoins is to provide an on/off-ramp for investors willing to trade and invest in cryptocurrencies. Stablecoins also allow investors to store value since cryptocurrencies, in general, are subject to volatility.
What is Bitcoin Dominance?
Bitcoin dominance is the ratio of Bitcoin's market capitalization to the total market capitalization of all cryptocurrencies combined. It provides a clear picture of Bitcoin’s interest among investors. A high BTC dominance typically happens before and during a bull run, in which investors resort to investing in relatively stable and high market capitalization cryptocurrency like Bitcoin. A drop in BTC dominance usually means that investors are moving their capital and/or profits to altcoins in a quest for higher returns, which usually triggers an explosion of altcoin rallies.
