Meme Coins Explode: Dogecoin’s Bull Run Confirmed, Fueling Shiba Inu and Pepe Surge

Dogecoin just flipped the switch—the original meme coin confirms its bullish trajectory, sparking massive momentum across the entire speculative altcoin space.
Shiba Inu and Pepe catch the wave
As DOGE breaks resistance, SHIB and PEPE ride the coattails. Retail piles in, leverage spikes, and suddenly everyone's a crypto genius again—until the next drawdown, of course.
Timing the meme cycle
These assets move fast. Miss the entry, and you're chasing; miss the exit, and you're bag-holding. Classic crypto: where fundamentals take a backseat to vibes and viral tweets.
One cynical take? Wall Street still doesn’t get it—and honestly, that’s probably for the best.
Derivatives traders grow interest in meme coins
CoinGlass data shows a significant surge in Open Interest (OI) of meme coins such as Dogecoin, Shiba Inu, and Pepe. The DOGE OI has increased to $4.33 billion, from $3.31 billion on Sunday, while the SHIB OI records a surge to $209.45 million, from $173.75 million on Sunday.
Similarly, the PEPE OI at $659.74 million is up from $545.77 million in the same period. This indicates a boost in risk-on sentiment among investors on the back of the first-ever US meme coin ETF of Dogecoin by Rex Osprey.
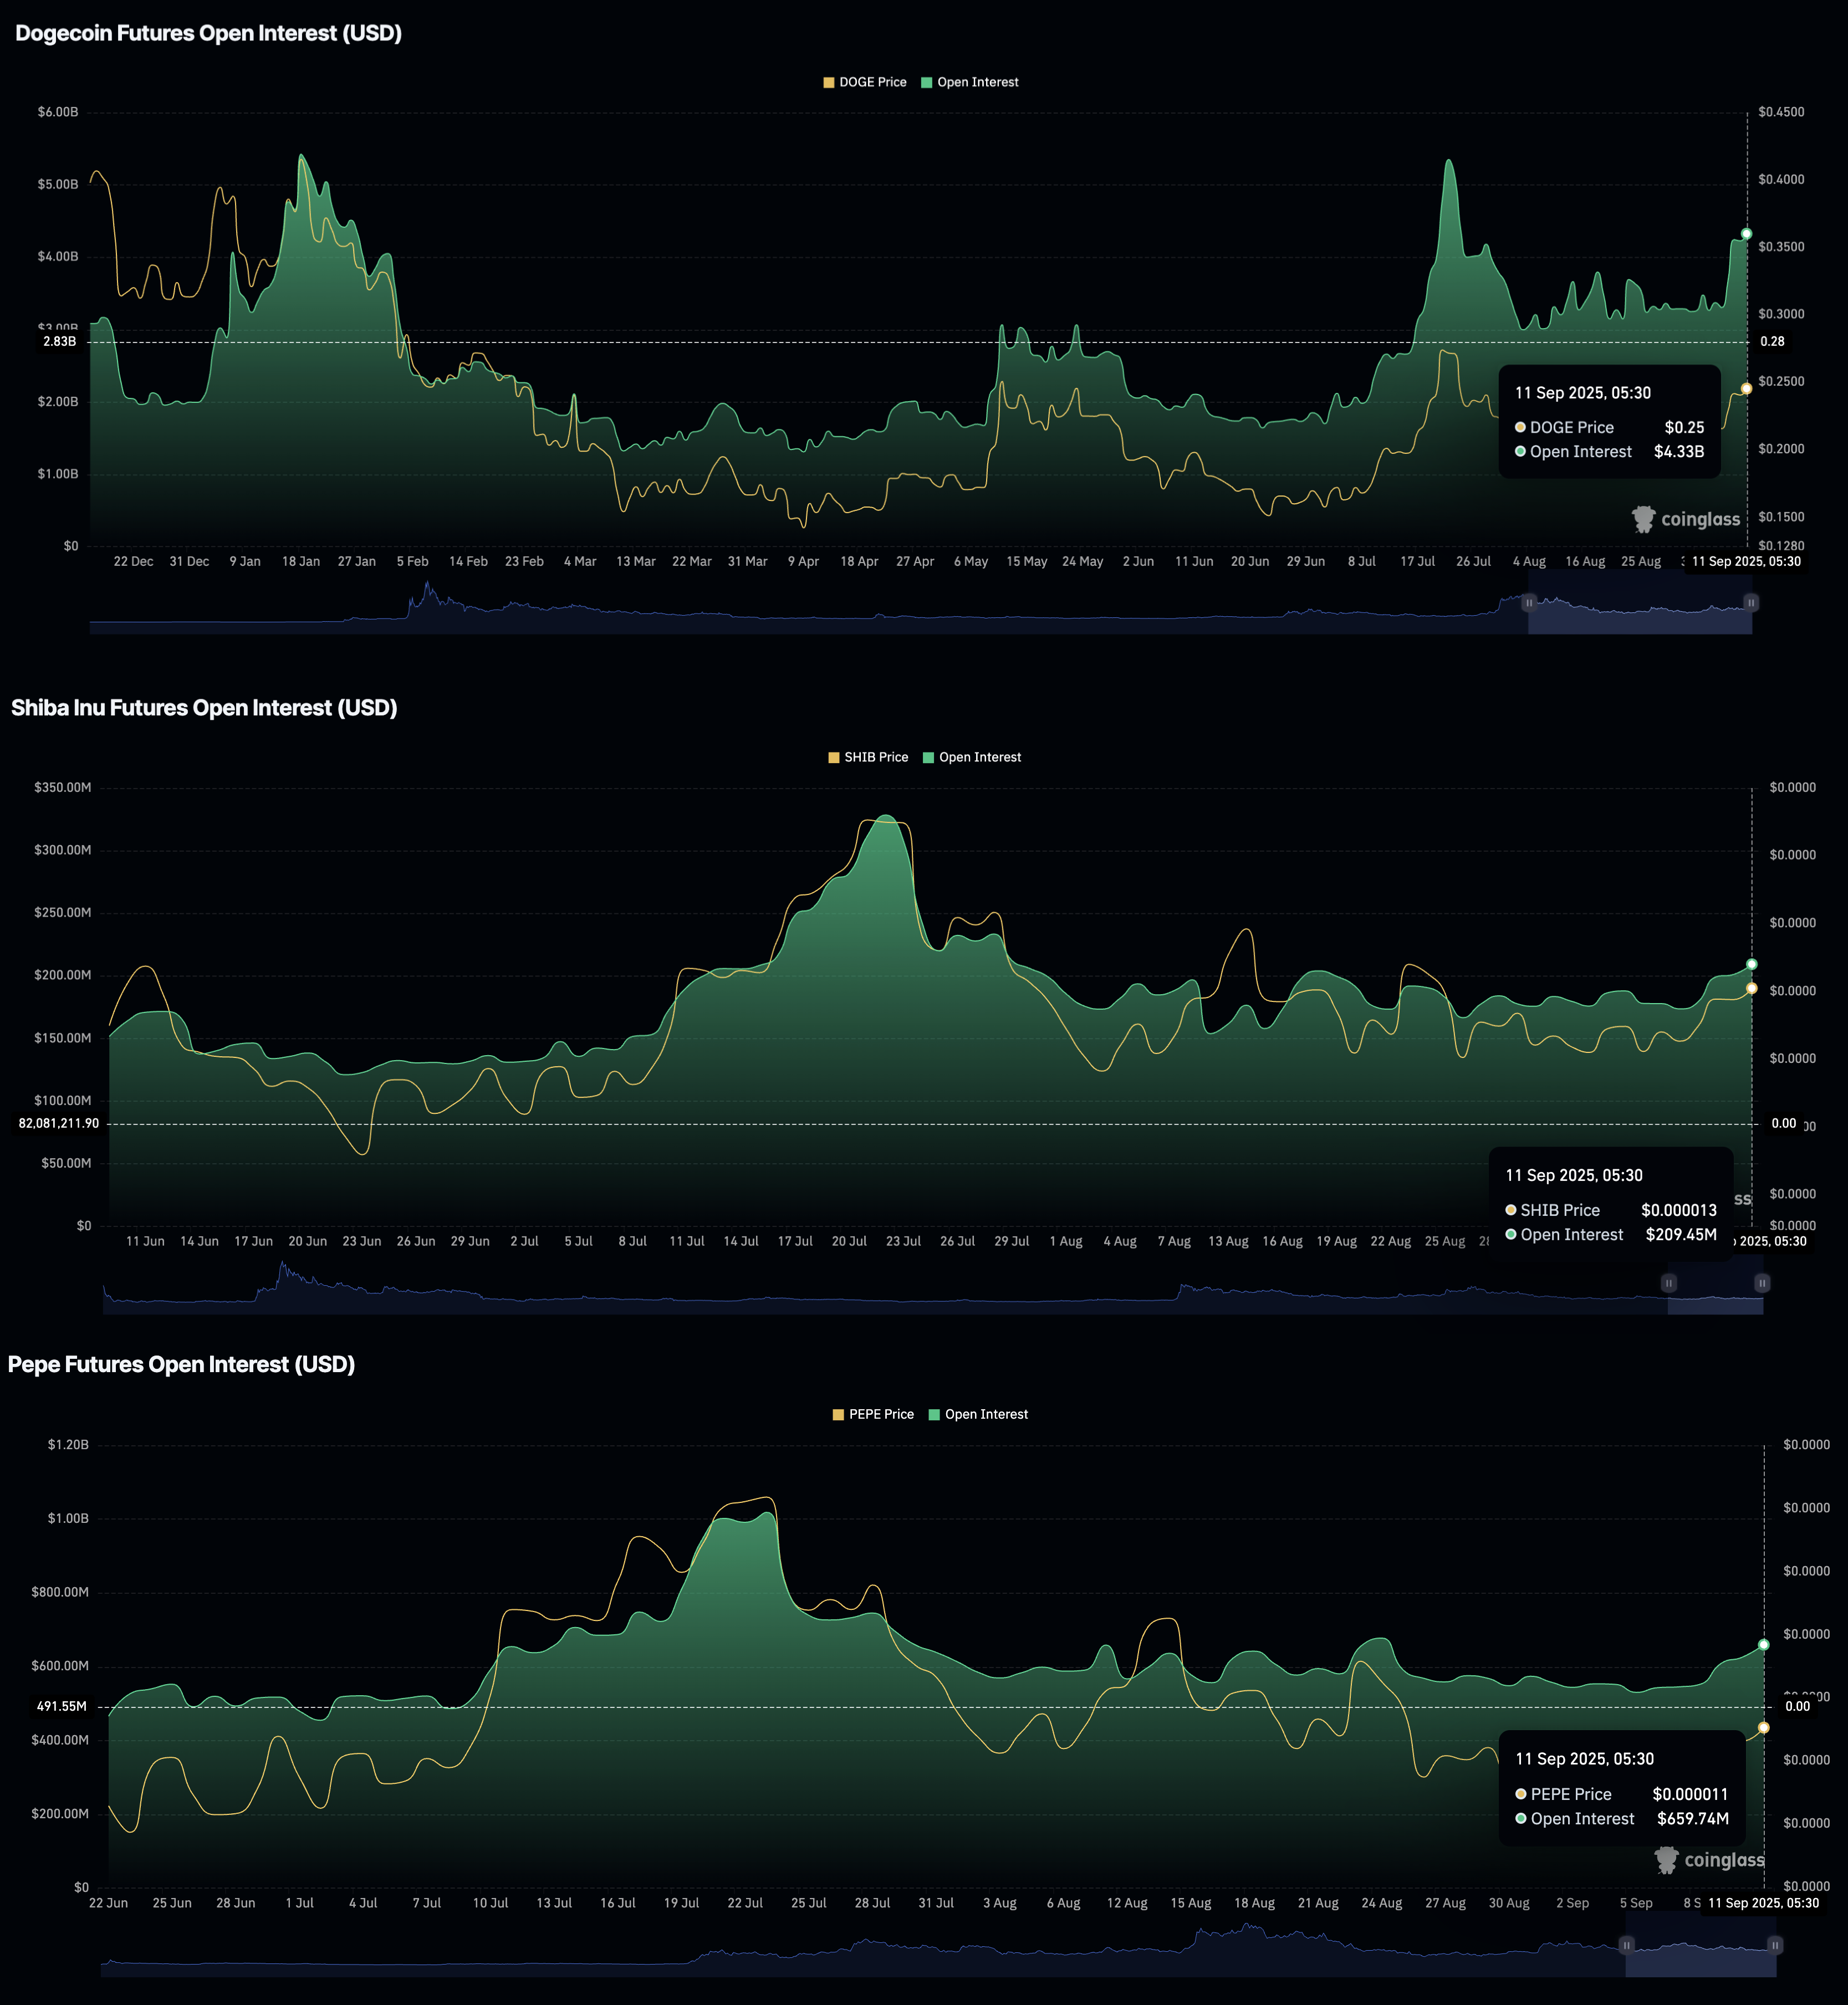
Meme Coins Open Interest. Source: CoinGlass
Dogecoin breakout rally gains momentum
Dogecoin is on a recovery run this week ahead of the DOJE ETF launch on Thursday, as anticipated by Eric Balchunas, a Bloomberg ETF specialist.
Dogecoin extends the trendline breakout rally above $0.25000 on the daily chart, targeting the $0.25574 resistance marked by the peak of August 14. A clean push above this level could extend the rally to the R2 pivot level at $0.28659.
Adding to the breakout, the momentum indicators on the daily chart are presenting a surge in buying pressure as the Relative Strength Index (RSI) maintains an upward-moving slope, reaching 63, with further space for recovery before reaching overbought levels.
Similarly, the Moving Average Convergence Divergence (MACD) indicator displays a steady rise in bullish momentum based on the increasing green histogram bars and an uptrend in the average lines.
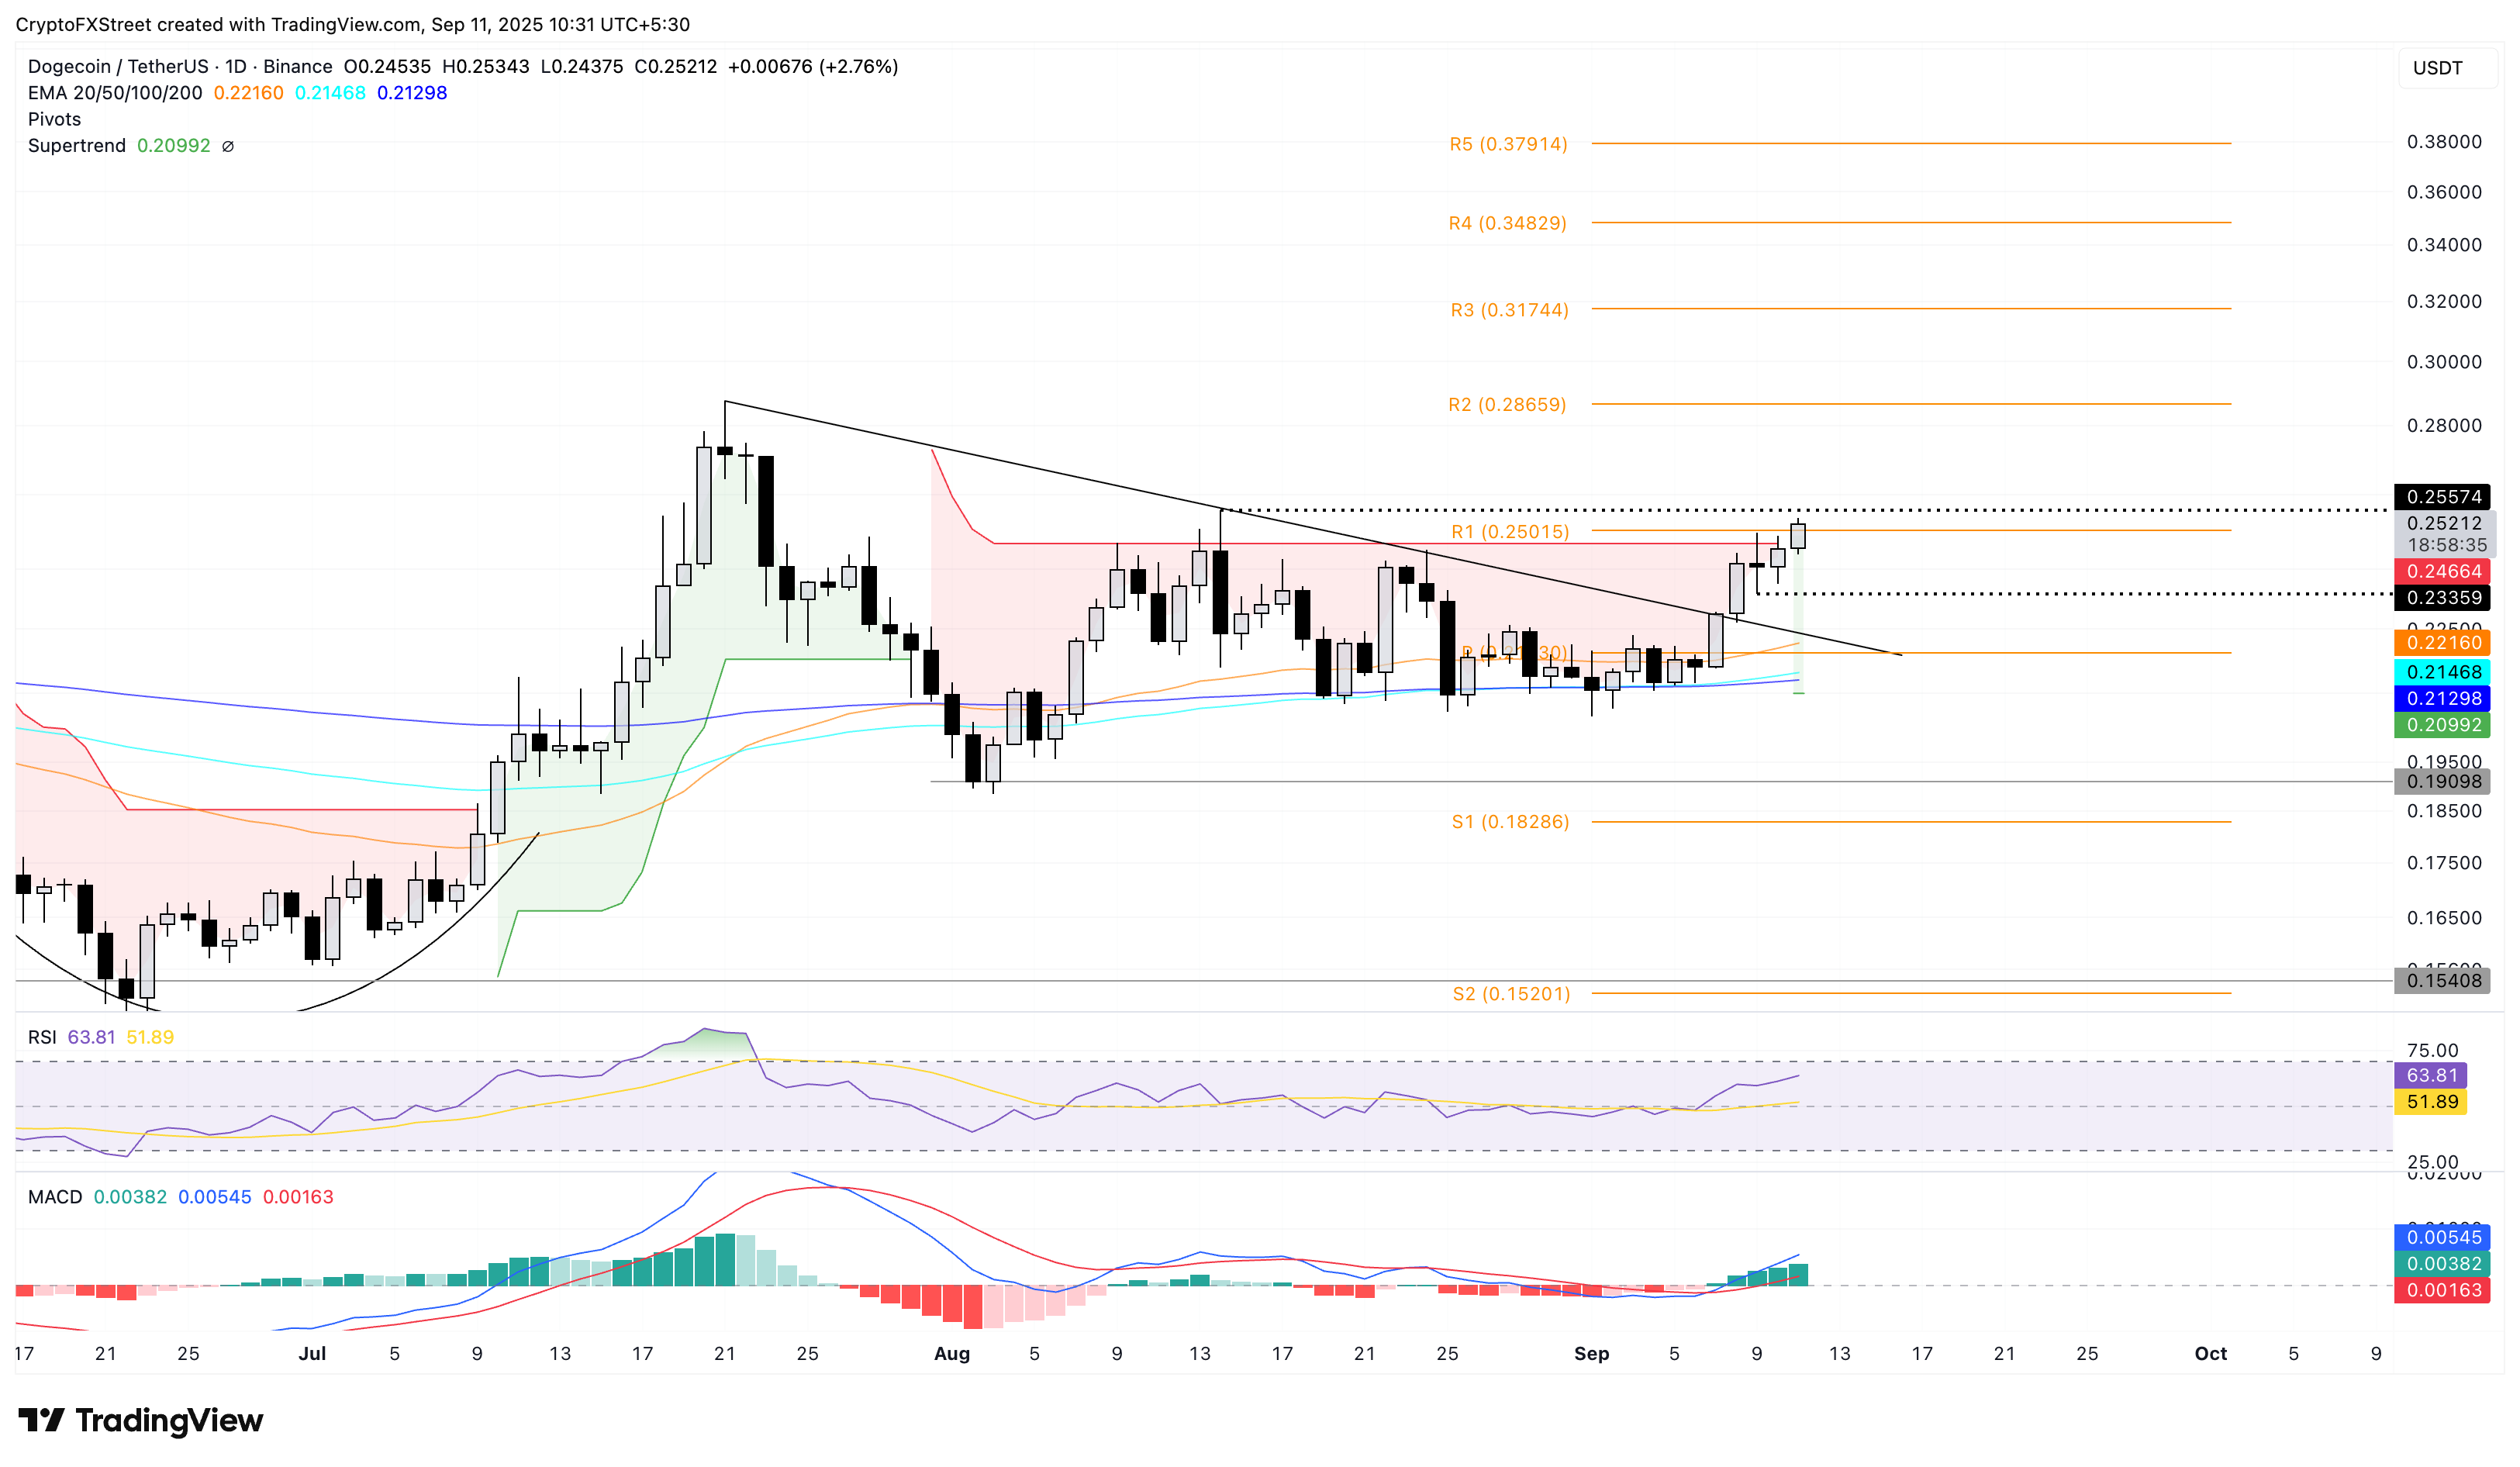
DOGE/USDT daily price chart.
On the downside, if Doge flips from the $0.25574 level, it could retest the centre pivot level at $0.21930.
Shiba Inu rally targets the 200-day EMA
Shiba Inu gains traction on the back of segment leader Dogecoin’s recovery, marking its fifth consecutive day of uptrend. SHIB bounces off the 100-day Exponential Moving Average (EMA) at $0.00001297 with a NEAR 1% gain at press time on Thursday.
The path of least resistance for SHIB points to the 200-day EMA at $0.00001384 as the next crucial obstacle, presenting the possibility of an additional 5% gain.
Buying pressure is on the rise, evident by the RSI crossing above the halfway line, reaching 56 on the daily chart. Additionally, the MACD line approaches the zero line with the signal line following, indicating a bullish shift in trend momentum.
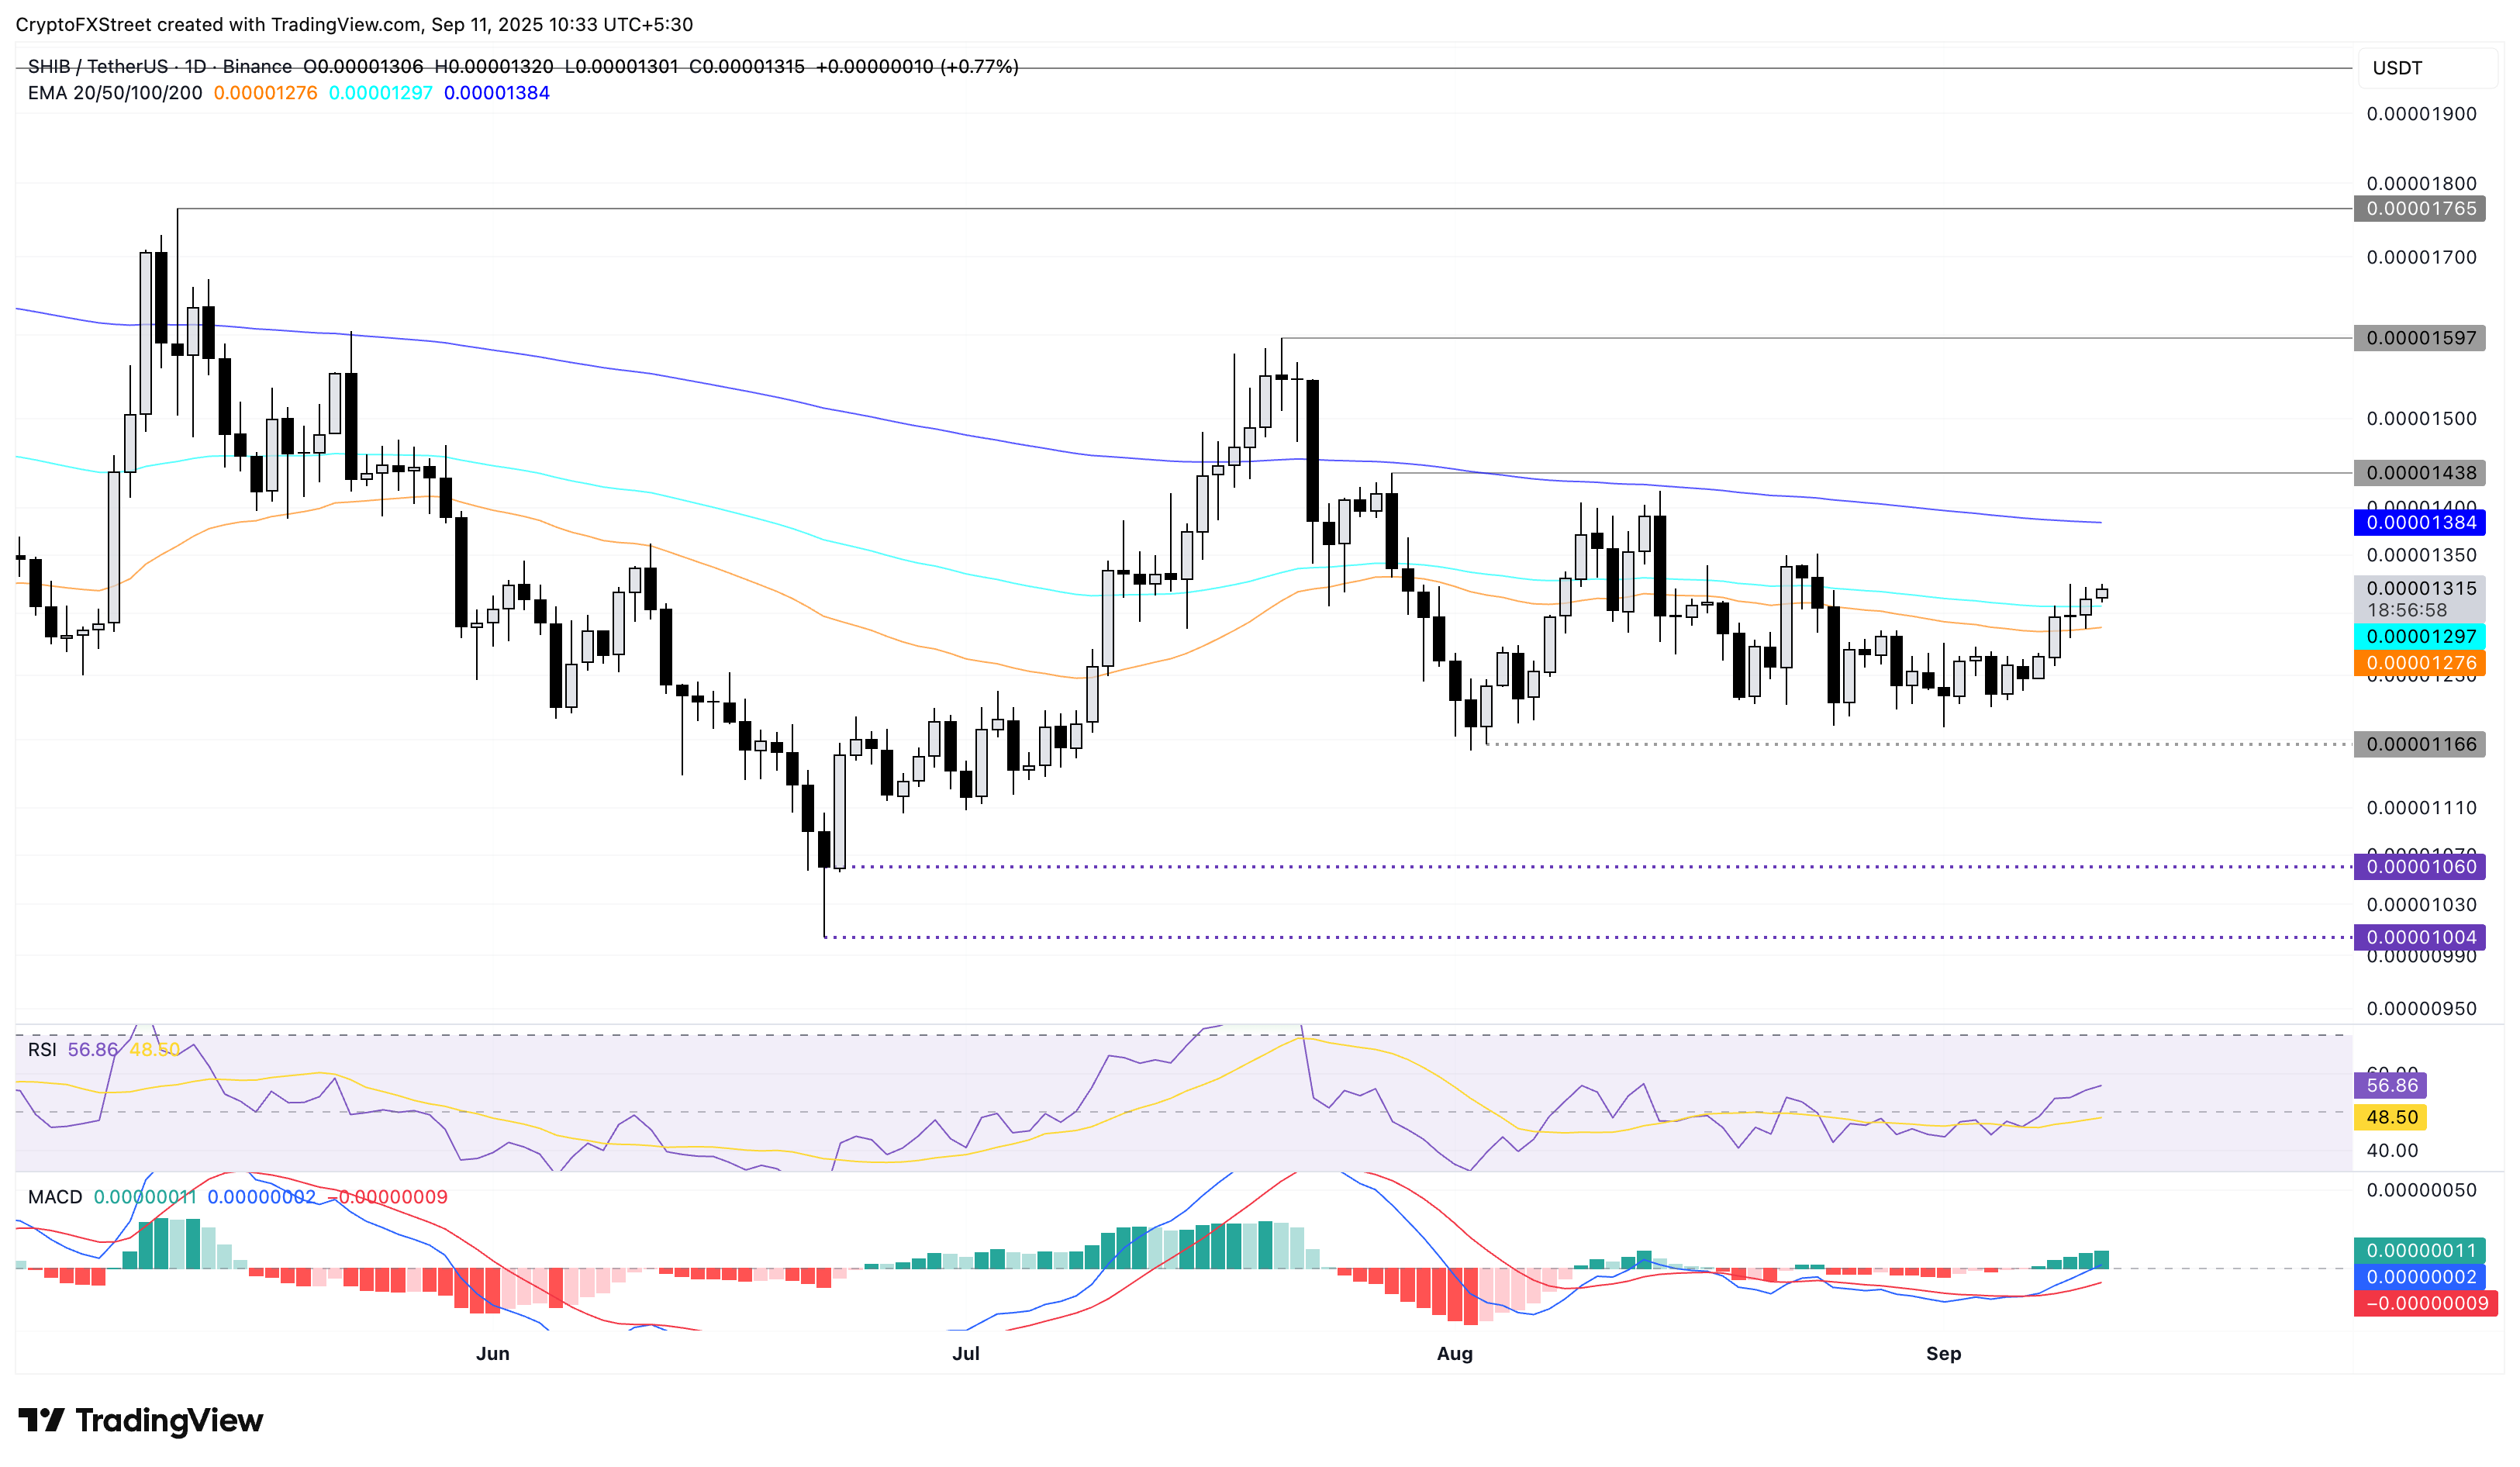
SHIB/USDT daily price chart.
Looking down, if SHIB loses the 50-day EMA at $0.00001276, it could reverse the trend to the $0.00001166 support level.
Pepe faces headwinds at the 50-day EMA
Pepe stalls the upward trend following a 2% rise on Wednesday, after reclaiming the $0.00001000 psychological level. The frog-themed meme coin faces headwinds from the 50-day EMA at $0.00001062, followed by the declining 100-day and 200-day EMAs.
If Pepe clears above the 200-day EMA at $0.00001098, it could extend the recovery to the $0.00001266 level, last tested on August 14.
The RSI at 53 has crossed above the halfway line, suggesting a positive shift in buying activity. Furthermore, the MACD and signal line extend the uptrend after the crossover on Sunday.
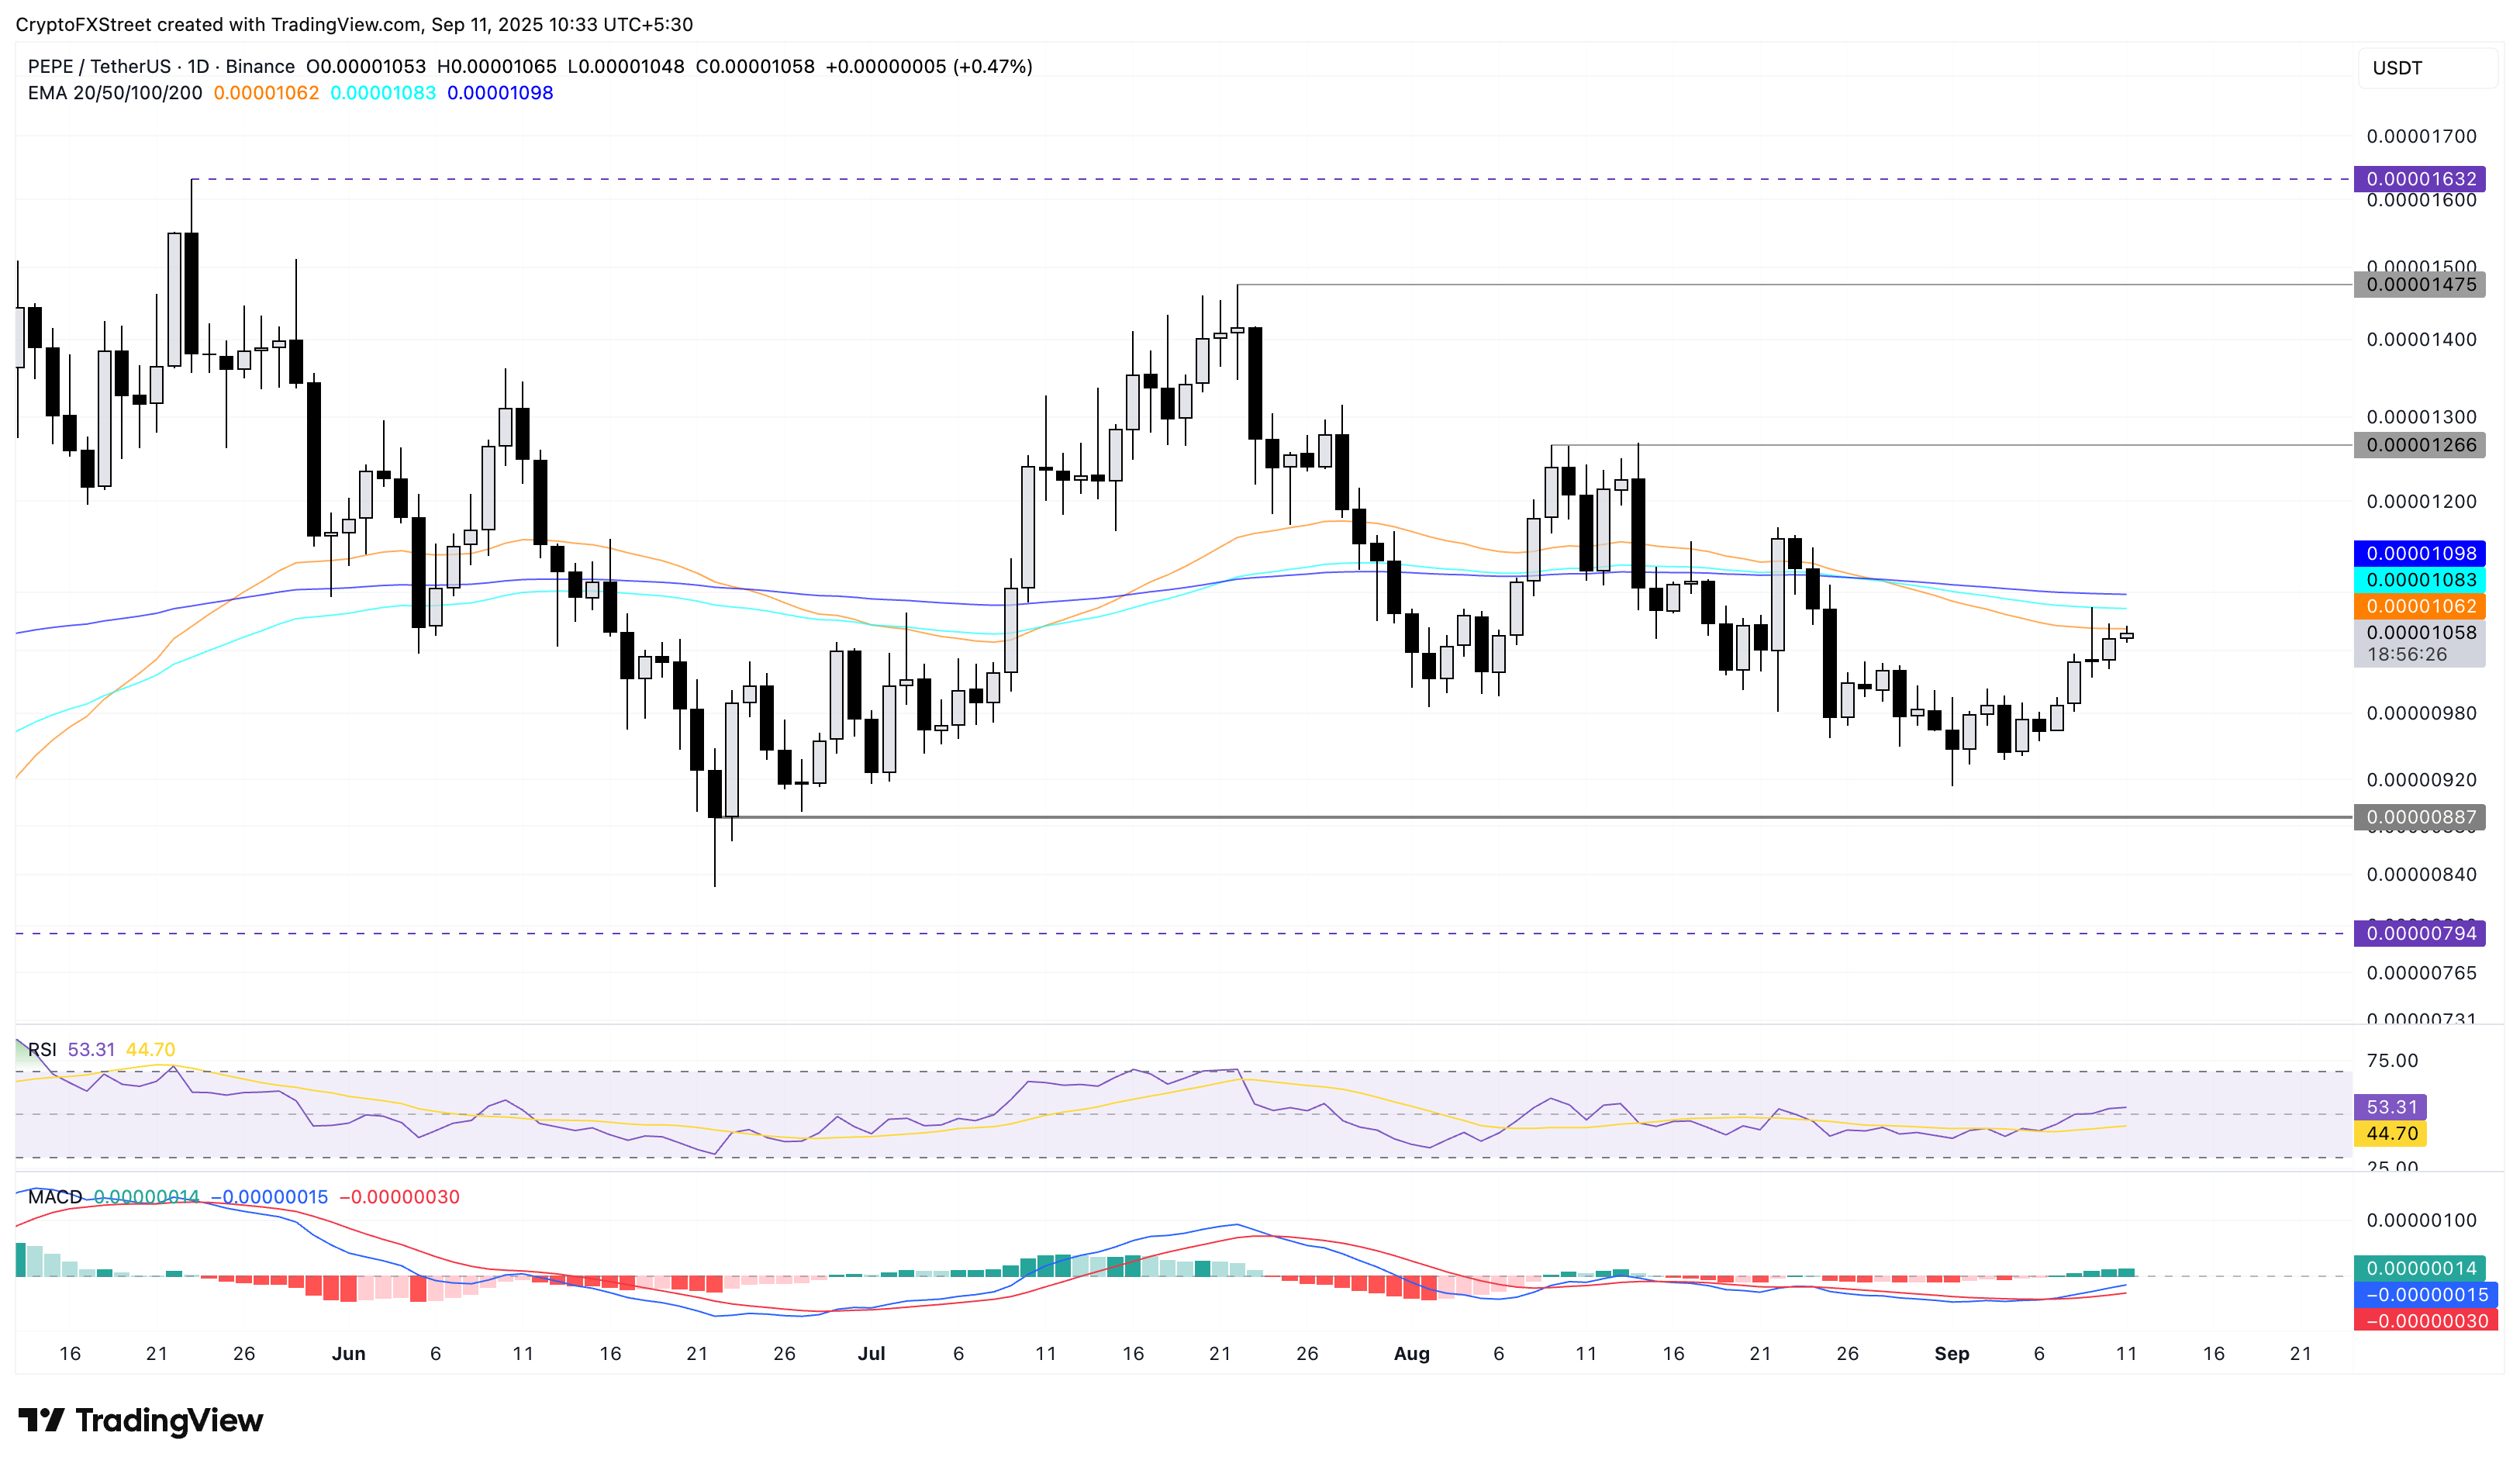
PEPE/USDT daily price chart.
On the flipside, a potential reversal from the 50-day EMA at $0.00001062 could retest the $0.0000900 figure.

Log in to Reply
Log in to comment your thoughtsComments
Related Articles
|Square
Get the BTCC app to start your crypto journey
Get started today Scan to join our 100M+ users