Ethereum Price Forecast: Whales Accelerate Buying Pressure as Short-Term Holders Cash Out

Whales are doubling down on Ethereum accumulation while retail traders hit the sell button—creating a classic crypto standoff between smart money and emotional momentum.
The Big Players Move In
Major holders aren't just dipping toes—they're diving headfirst into Ethereum positions, signaling confidence that would make traditional finance analysts nervously adjust their spreadsheets. Meanwhile, short-term speculators keep taking profits faster than you can say 'volatility.'
Market Mechanics at Play
This isn't random noise—it's the market's natural rebalancing act. Whale accumulation typically precedes major moves, while retail distribution often marks local tops. The question isn't if Ethereum will move, but when and how violently.
Traditional finance still can't decide whether crypto is a revolution or a scam—meanwhile, the revolution keeps banking returns that would make hedge fund managers blush.
Ethereum price today: $4,340
- Whales purchased over 450,000 ETH, alongside steady accumulation from corporate entities.
- Small-scale holders have distributed over 500K ETH in the past week.
- ETH retested the $4,500 key level after breaking above a descending trendline resistance.
Ethereum (ETH) trades above $4,300 on Wednesday following increased accumulation from whales as short-term holders step up distribution.
Whales continue accumulation amid increased distribution from small-scale holders
Whales or large holders with a balance of 10K-100K ETH have remained active buyers of the top altcoin. These large holders increased their collective balance by over 450K ETH in the past week, continuing an accumulation trend that began in May.
-1757548953020-1757548953021.png)
ETH Balance by Holder Value. Source: CryptoQuant
Demand is also evident in inflows into accumulation addresses or wallets with no record of selling activity. Often dominated by new holders, these wallets have steadily been buying ETH over the past week, although not as heavily as in August.
Ethereum exchange reserves paint a similar picture, decreasing by 260K ETH since the beginning of September. A decline in exchange reserves indicates rising demand as investors are moving funds to private wallets for potential long-term holding.
-1757548984668-1757548984669.png)
ETH Exchange Reserve. Source: CryptoQuant
Additionally, ethereum treasury firms have maintained their buying activity as BitMine Immersion (BMNR) and SharpLink Gaming added about 202.5K ETH and 39.5K ETH to their holdings, respectively.
Despite demand from these entities, ETH has failed to record notable gains, pressured by distribution from small-scale investors and short-term holders.
Wallets holding between 100-10K ETH shed over 500K ETH in the past week alongside rising selling activity from investors who bought ETH over the past 90 days — as evidenced by the Mean Coin Age metric. A falling slope in the Mean Coin Age shows distribution and vice versa for a rising slope.
%20%5B01-1757549489364-1757549489365.11.14,%2011%20Sep,%202025%5D.png)
ETH Mean Coin Age. Source: Santiment
Meanwhile, active addresses and transaction counts have also begun declining from levels seen in previous weeks, indicating a drop off in on-chain activity.
On the derivatives side, ETH futures net taker volume, which compares short positions against long positions, has reached a record low. This indicates a large number of positions are betting on a price decline for the top altcoin.
Ethereum Price Forecast: ETH faces rejection at $4,500 after breaking above descending triangle resistance
Ethereum saw $64 million in futures liquidations over the past 24 hours, per Coinglass data. The total amount of long and short liquidations accounted for $31.6 million and $32.5 million, respectively.
ETH broke above the upper boundary trendline of a descending triangle on Wednesday and tested the $4,500 level before seeing a modest rejection. If ETH holds above this trendline, it could retest the $4,500 resistance again — a level it has failed to sustain a firm MOVE above in the past two weeks.
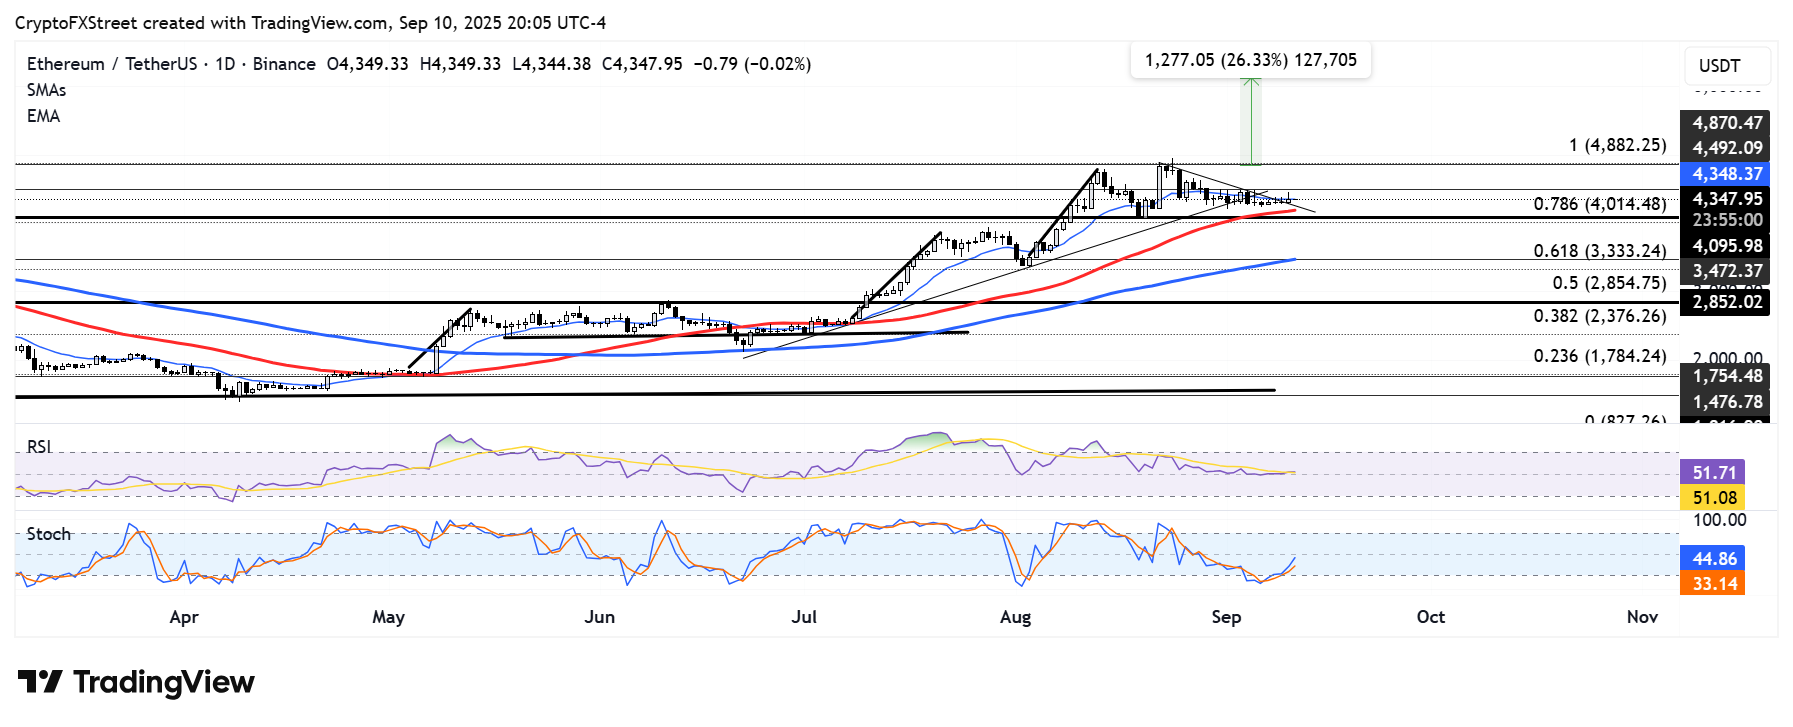
ETH/USDT daily chart
On the downside, ETH could fall toward $3,500 if it declines below the 50-day Simple Moving Average (SMA) and the support range between $4,000 and $4,100.
The Relative Strength Index (RSI) is moving horizontally NEAR its midline while the Stochastic Oscillator (Stoch) is below its neutral level but trending upward. This indicates a mildly dominant bearish momentum.
