1INCH Price Prediction: Whale Buying Spree and Technical Breakout Signal Major Rally Ahead
Whales are circling—and they're hungry for 1INCH.
Major accumulation patterns combined with a decisive technical breakout suggest this DeFi token isn't just bouncing—it's priming for a sustained upward move. Smart money positioning ahead of what could be the next leg up.
Technical Breakout Confirmed
The charts don't lie. 1INCH smashed through key resistance levels with volume backing the move—classic breakout behavior. Traders who missed the initial pump are now FOMO-buying the dip, creating additional upward pressure.
Whale Watching Season
Large wallets have been steadily accumulating, signaling institutional-grade confidence in the token's fundamentals. When whales move, retail typically follows—and this time appears no different.
Market sentiment shifted from cautious optimism to outright bullishness almost overnight. The combination of technical strength and fundamental accumulation creates a potent mix for continued gains.
Just remember—in crypto, whales eat first, and everyone else gets the leftovers. Trade accordingly.
1inch’s large wallet accumulation signals growing confidence
Santiment’s Supply Distribution data supports a bullish outlook for 1inch, as most of the cohorts holding large amounts of tokens continue to increase their holdings.
Whales holding between 10 million and 100 million 1INCH tokens (blue line) and wallets holding between 100,000 and 1 million (red line) have accumulated a total of 140.52 million tokens from September 2 to Tuesday. Meanwhile, wallets holding between 1 million and 10 million have shed 23 million 1INCH tokens during the same period.
This shows that, while the second cohort of whales could have fallen prey to a capitulation event, the first set of wallets seized the opportunity and accumulated 1INCH tokens at a discount.
%20%5B12-1757406402068-1757406402069.38.02,%2009%20Sep,%202025%5D.png)
1INCH supply distribution metric chart. Source: Santiment
1INCH Price Forecast: Bulls gain control
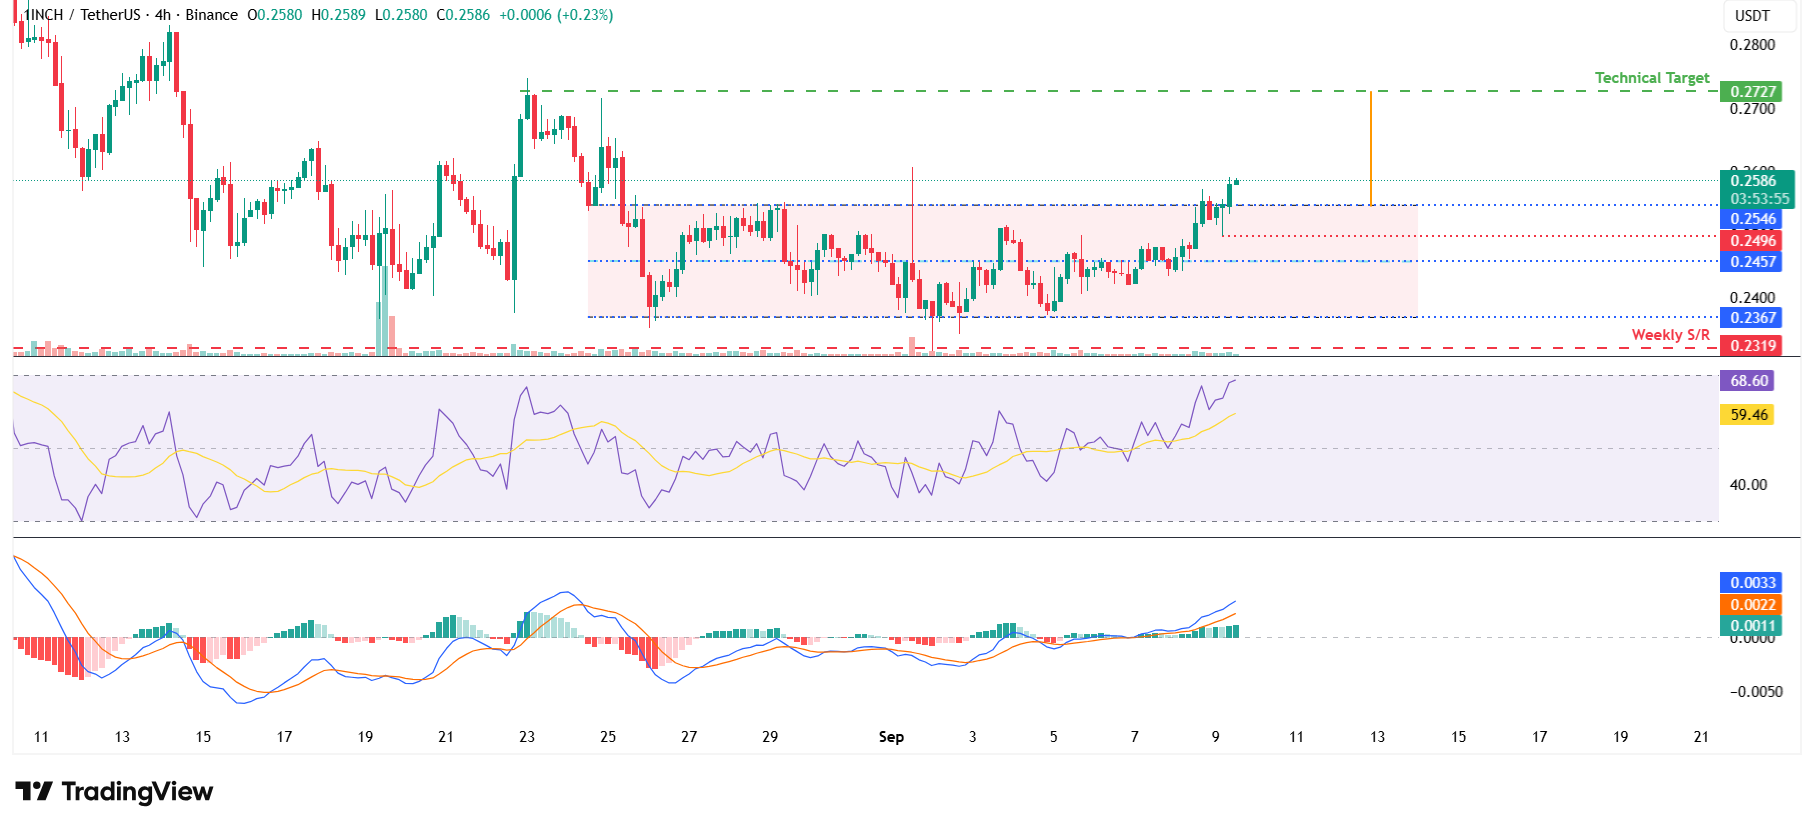
On the 4-hour chart, the 1INCH price broke above $0.254 on Tuesday, which aligns with the upper boundary of a parallel channel . This breakout favors the bulls, with a technical target at $0.272, which is obtained based on the height of the channel from the breakout point.
Before that, sideline investors could look for a buying opportunity between $0.258 and $0.254, with a tighter stop-loss around $0.249 or a wider stop-loss at $0.245, at the midpoint of the channel.
The Relative Strength Index (RSI) on the 4-hour chart reads 68, above its neutral level of 50 and still below overbought conditions, indicating further upside potential.

1INCH/USDT 4-hour chart
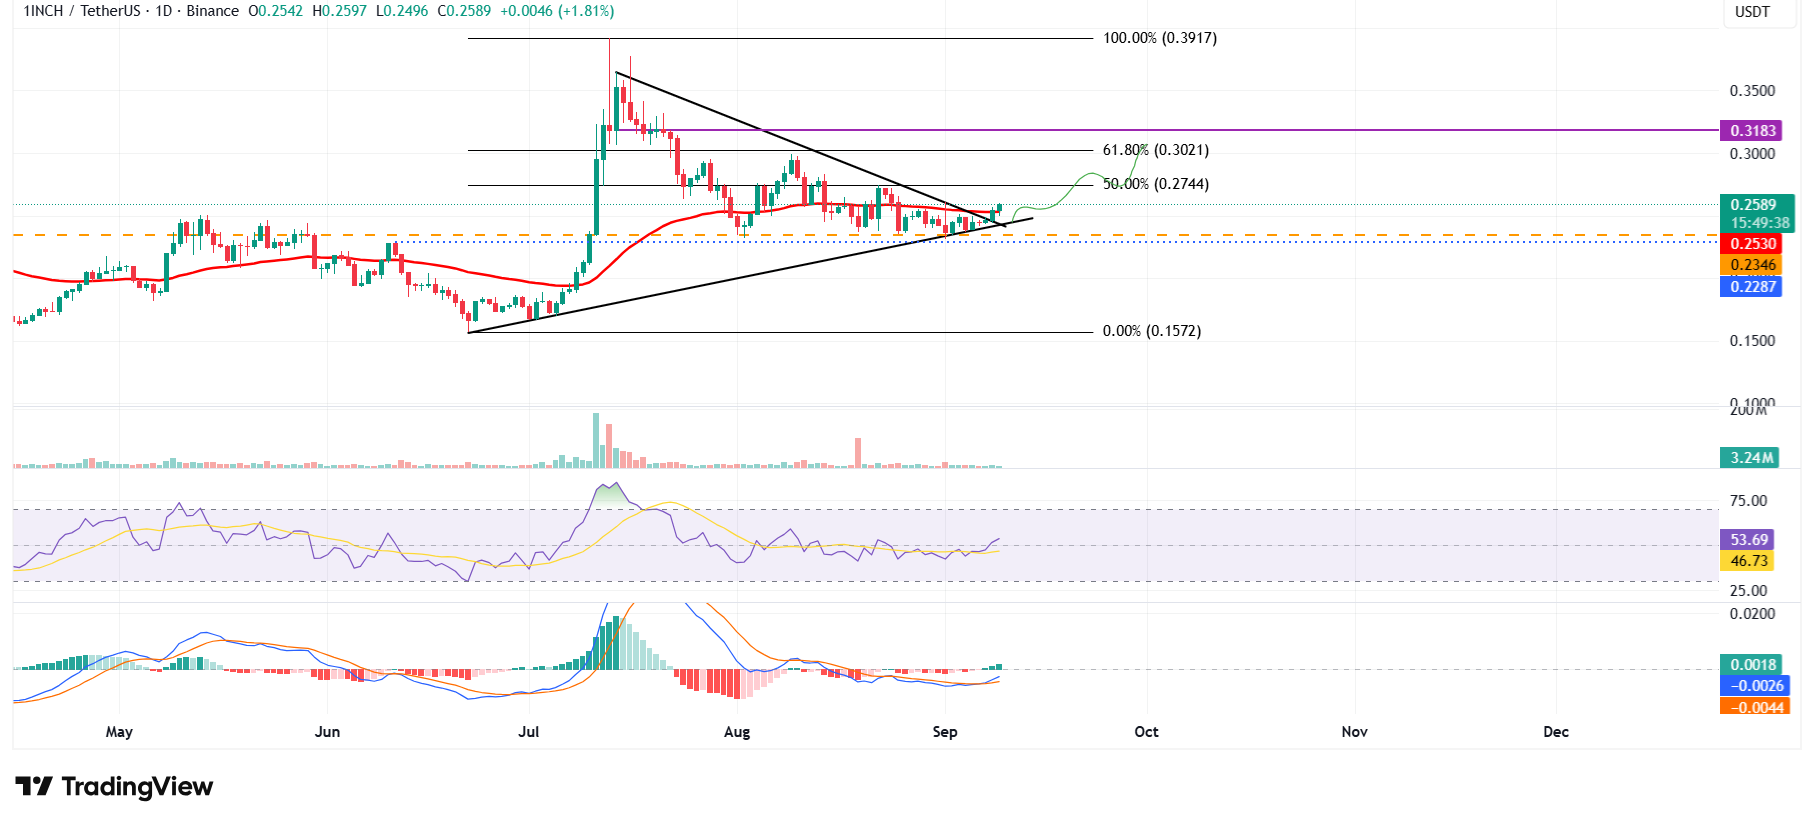
The daily chart also supports the bullish outlook. 1inch price broke above the descending trendline of a symmetrical triangle pattern on Monday and closed above the 50-day Exponential Moving Average (EMA) at $0.253. A breakout above this zone favours bulls, and at the time of writing on Tuesday, it continues to trade higher above $0.258.
If 1inch continues its upward momentum, it could extend gains toward the next resistance at $0.302, its 61.8% Fibonacci retracement drawn from the June low of $0.157 to the July high of $0.391.
The RSI on the daily chart is moving above its neutral level of 50, indicating early signs of bullish momentum. The Moving Average Convergence Divergence (MACD) showed a bullish crossover on Sunday, giving a buy signal and supporting the bullish view.

1INCH/USDT daily chart
If 1inch faces a correction, it could extend the decline toward its daily support at $0.234.

