Meme Coins Explosion: Dogecoin, Shiba Inu, and Pepe Set for Massive Rally in 2025

Meme coins defy gravity as retail frenzy meets institutional curiosity—proving once again that financial markets will embrace anything with a catchy mascot.
The Unstoppable Trio
Dogecoin leads the pack with its Elon Musk-fueled momentum, while Shiba Inu's ecosystem expansion creates unexpected utility in the most speculative corner of crypto. Pepe—the dark horse—rides wave after wave of social media hype, turning internet culture into tangible market moves.
Market Mechanics Behind the Move
Low liquidity pools get slammed by coordinated buying, triggering cascading effects across derivatives markets. Shorts get squeezed, leverage amplifies gains, and suddenly everyone's a genius for buying digital assets based on frog memes and dog pictures.
Just remember: behind every 1000% pump sits a hedge fund manager quietly taking profits while telling CNBC about 'market irrationality'—the same one who probably called these assets worthless six months ago.
Derivatives data suggest increased interest
Meme coins are gaining interest among derivative traders driven by the hopes of an interest rate cut by the US Federal Reserve on September 17 and the Dogecoin ETF by Rex-Osprey. CoinGlass data shows the DOGE, SHIB, and PEPE Open Interest (OI) have 12%, 4% and 3%, respectively, underpinned by double-digit growth in volume.
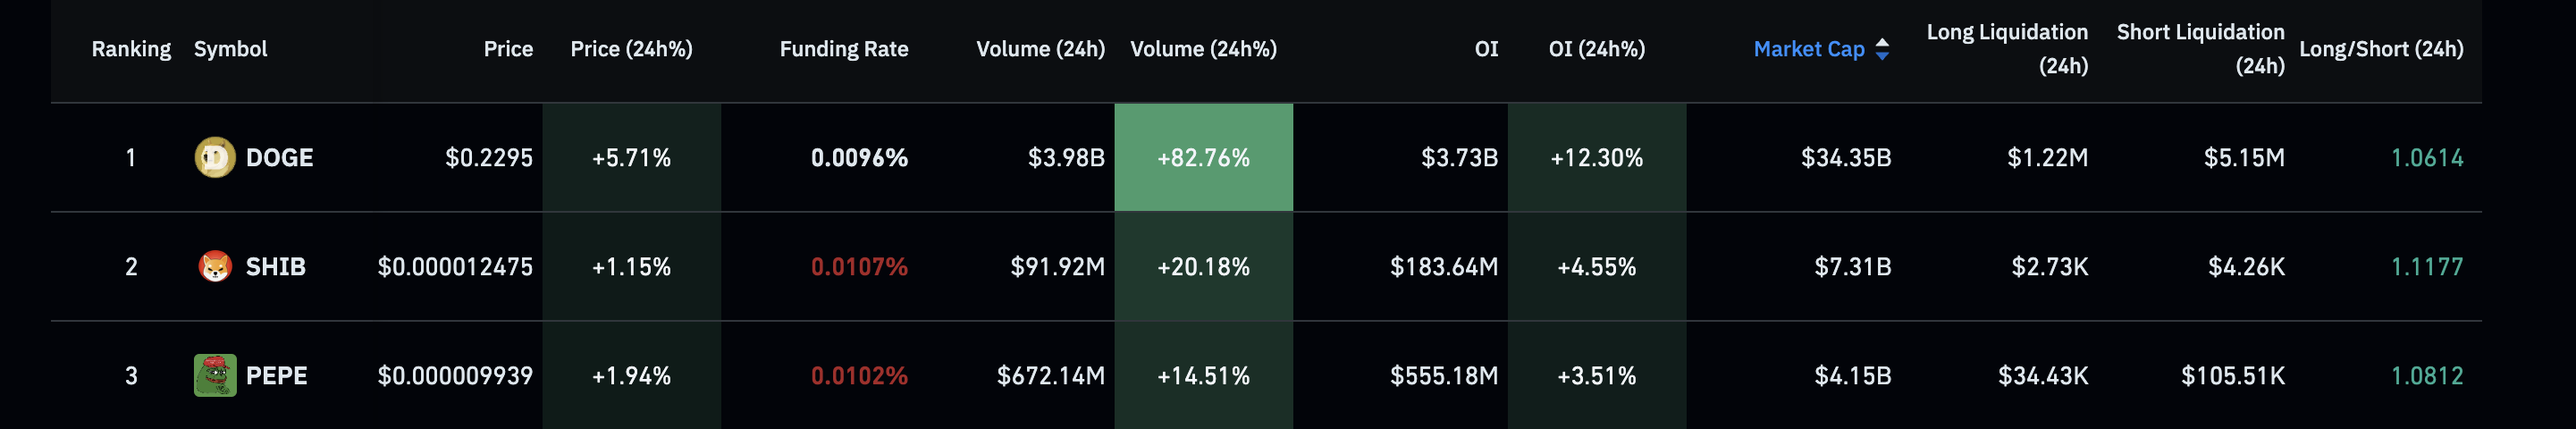
Meme coins open interests. Source: CoinGlass
Notably, the long-to-short ratio over the last 24 hours is above 1 for these top meme coins, suggesting a bullish bias among traders.
Dogecoin heats up amid renewed ETF hopes
Dogecoin edges higher by over 2% at press time on Monday, extending the nearly 6% gains from the previous day. DOGE’s recovery, fueled by Rex-Osprey’s announcement of a Doge ETF coming soon on Thursday, has marked the breakout of a consolidation range below $0.22597 on the 4-hour chart to challenge the $0.23498 resistance.
If DOGE marks a decisive close above this level, it could extend the rally to the $0.24300 level, last tested on August 24. Adding to the breakout chances, the 50-period Exponential Moving Average approaches the 200-period EMA, hinting at a Golden Cross, which WOULD indicate a stronger short-term recovery compared to the prevailing long-term trend.
The Moving Average Convergence Divergence (MACD) indicator displays a successive rise in green histogram bars, suggesting that the bullish momentum is increasing. Furthermore, the Relative Strength Index (RSI) at 74 has reached overbought levels underpinned by heightened buying pressure.
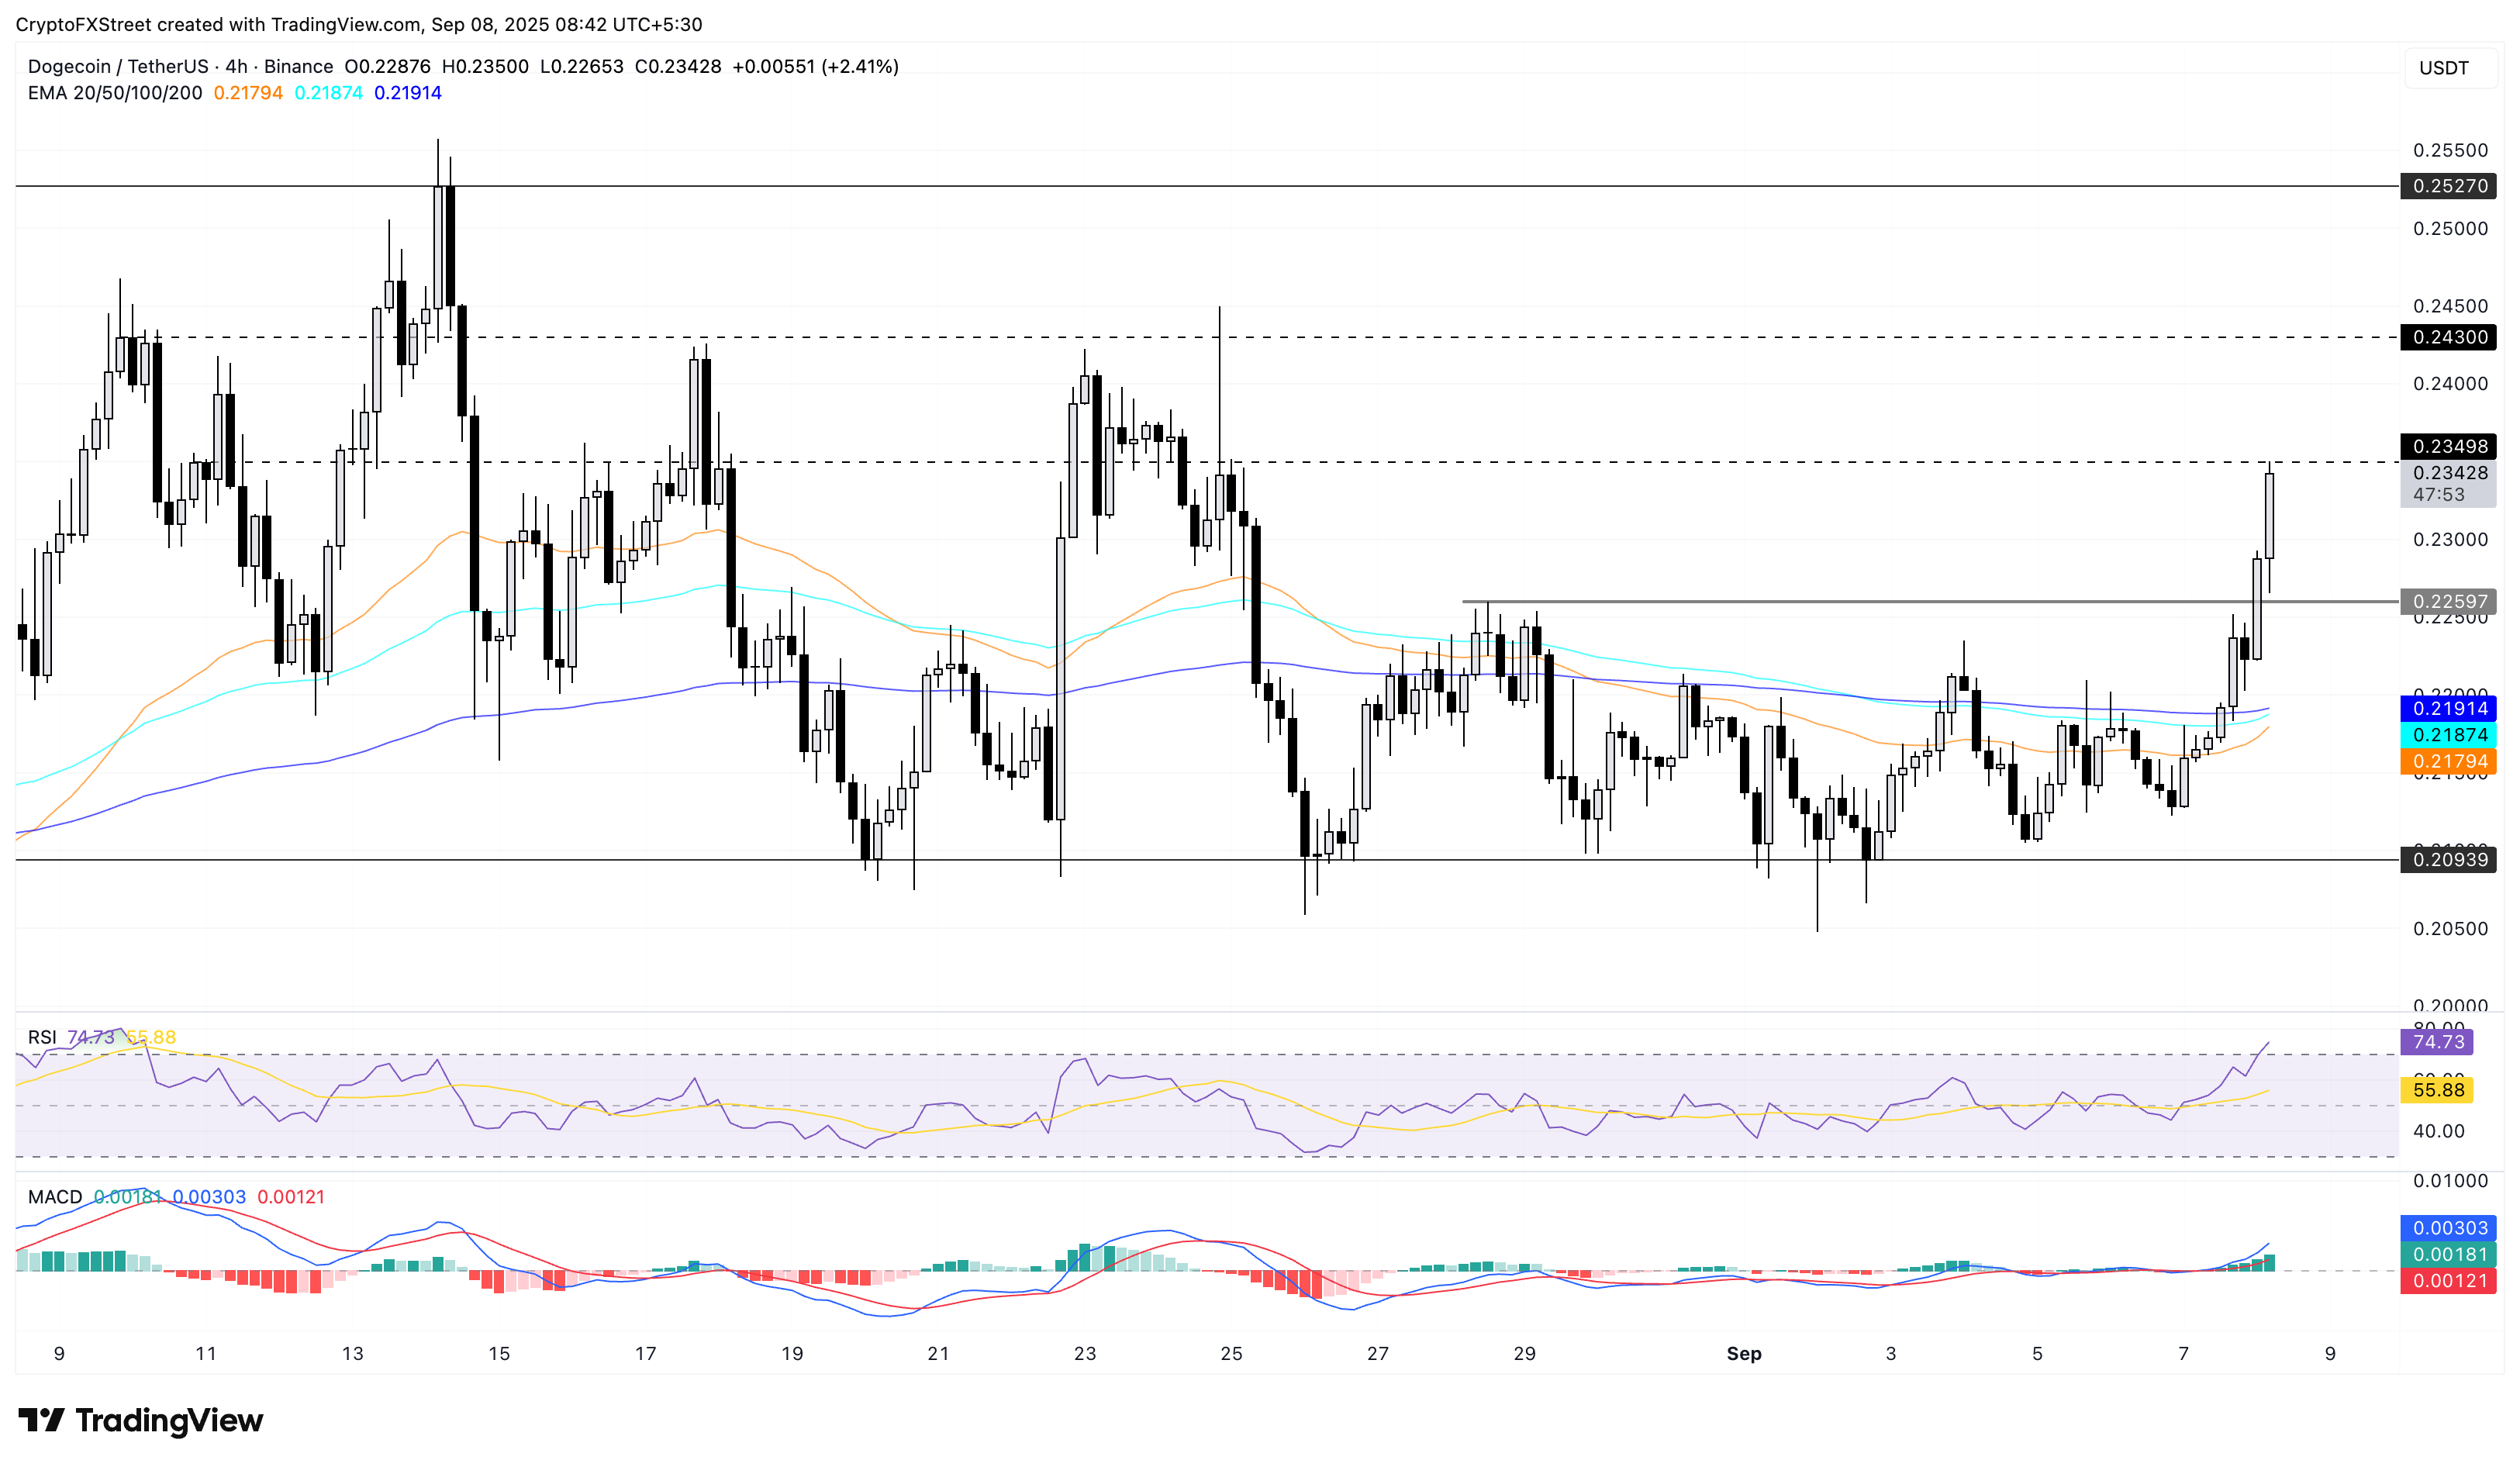
DOGE/USDT daily price chart.
Looking down, a potential reversal in DOGE under the $0.22597 level would invalidate the range breakout, which could potentially dump the meme coin to the 200-period EMA at $0.21914.
Shiba Inu targets 200-period EMA breakout
Shiba Inu marks the breakout of a descending triangle pattern on the 4-hour chart as the meme coin segment heats up. At the time of writing, SHIB holds above the 100-period EMA at $0.00001244, hinting at a renewed uptrend.
To reignite an uptrend, the meme coin should surpass the supertrend indicator line close to the 200-period EMA at $0.00001261. A decisive close above this level could extend the bullish trend to the R2 pivot level at $0.00001279, followed by the R3 pivot level at $0.00001310.
The MACD indicator displays a sharp surge in green histogram bars, suggesting heightened bullish momentum. Furthermore, the RSI at 58 reflects a bullish shift in momentum with further space for growth before reaching overbought levels.
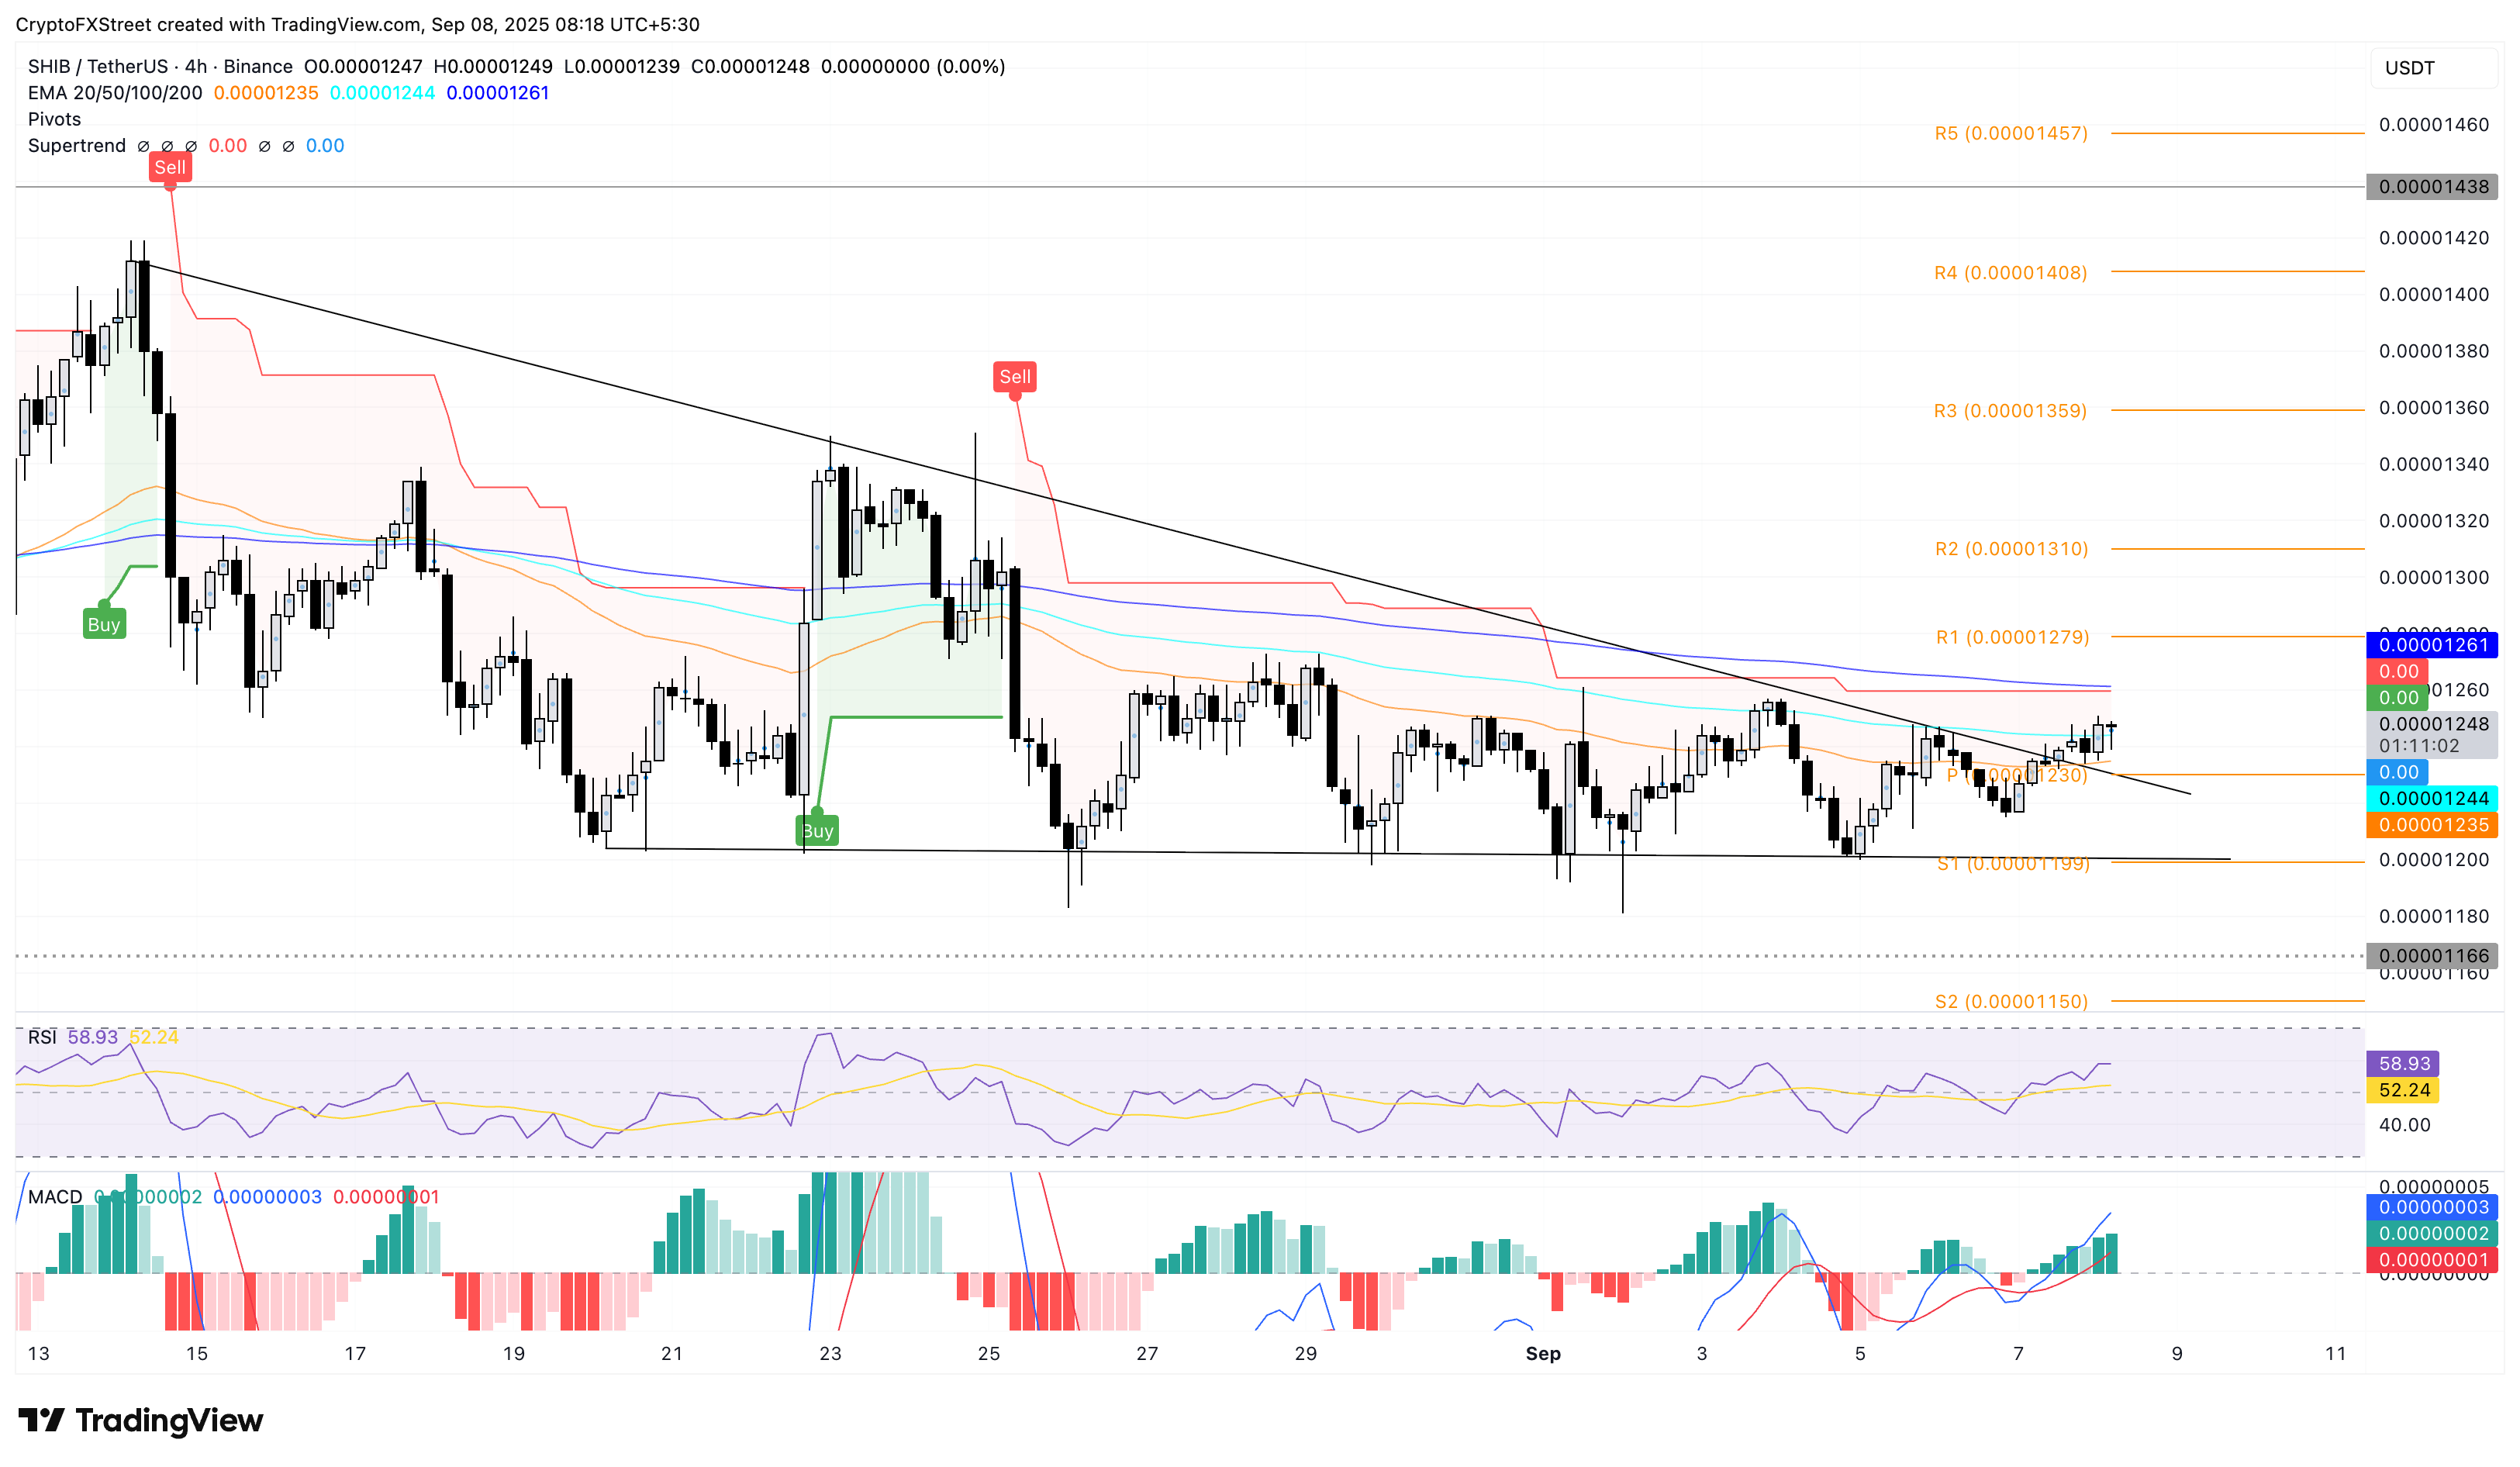
SHIB/USDT daily price chart.
On the downside, if SHIB drops below the centre pivot level at $0.00001230, it could invalidate the triangle pattern breakout. If so, the meme coin could drop down to the triangle’s baseline NEAR the $0.00001200 round figure.
Pepe’s renewed uptrend eyes further gains
Pepe recovers over 1% at press time on Monday, resulting in a resistance trendline breakout on the 4-hour chart. The frog-themed meme coin exceeds the supertrend indicator line near the 100-period EMA at $0.00001001, indicating a renewed uptrend.
As Pepe reclaims a psychological level, the breakout rally targets the 200-period EMA at $0.00001042. An extended recovery could reach the R3 pivot level at $0.00001112.
Similar to DOGE and SHIB, the momentum indicators are bullish aligned on the 4-hour chart. The MACD displays rising green histogram bars and the RSI at 65 approaches the overbought zone, indicating heightened bullish momentum.
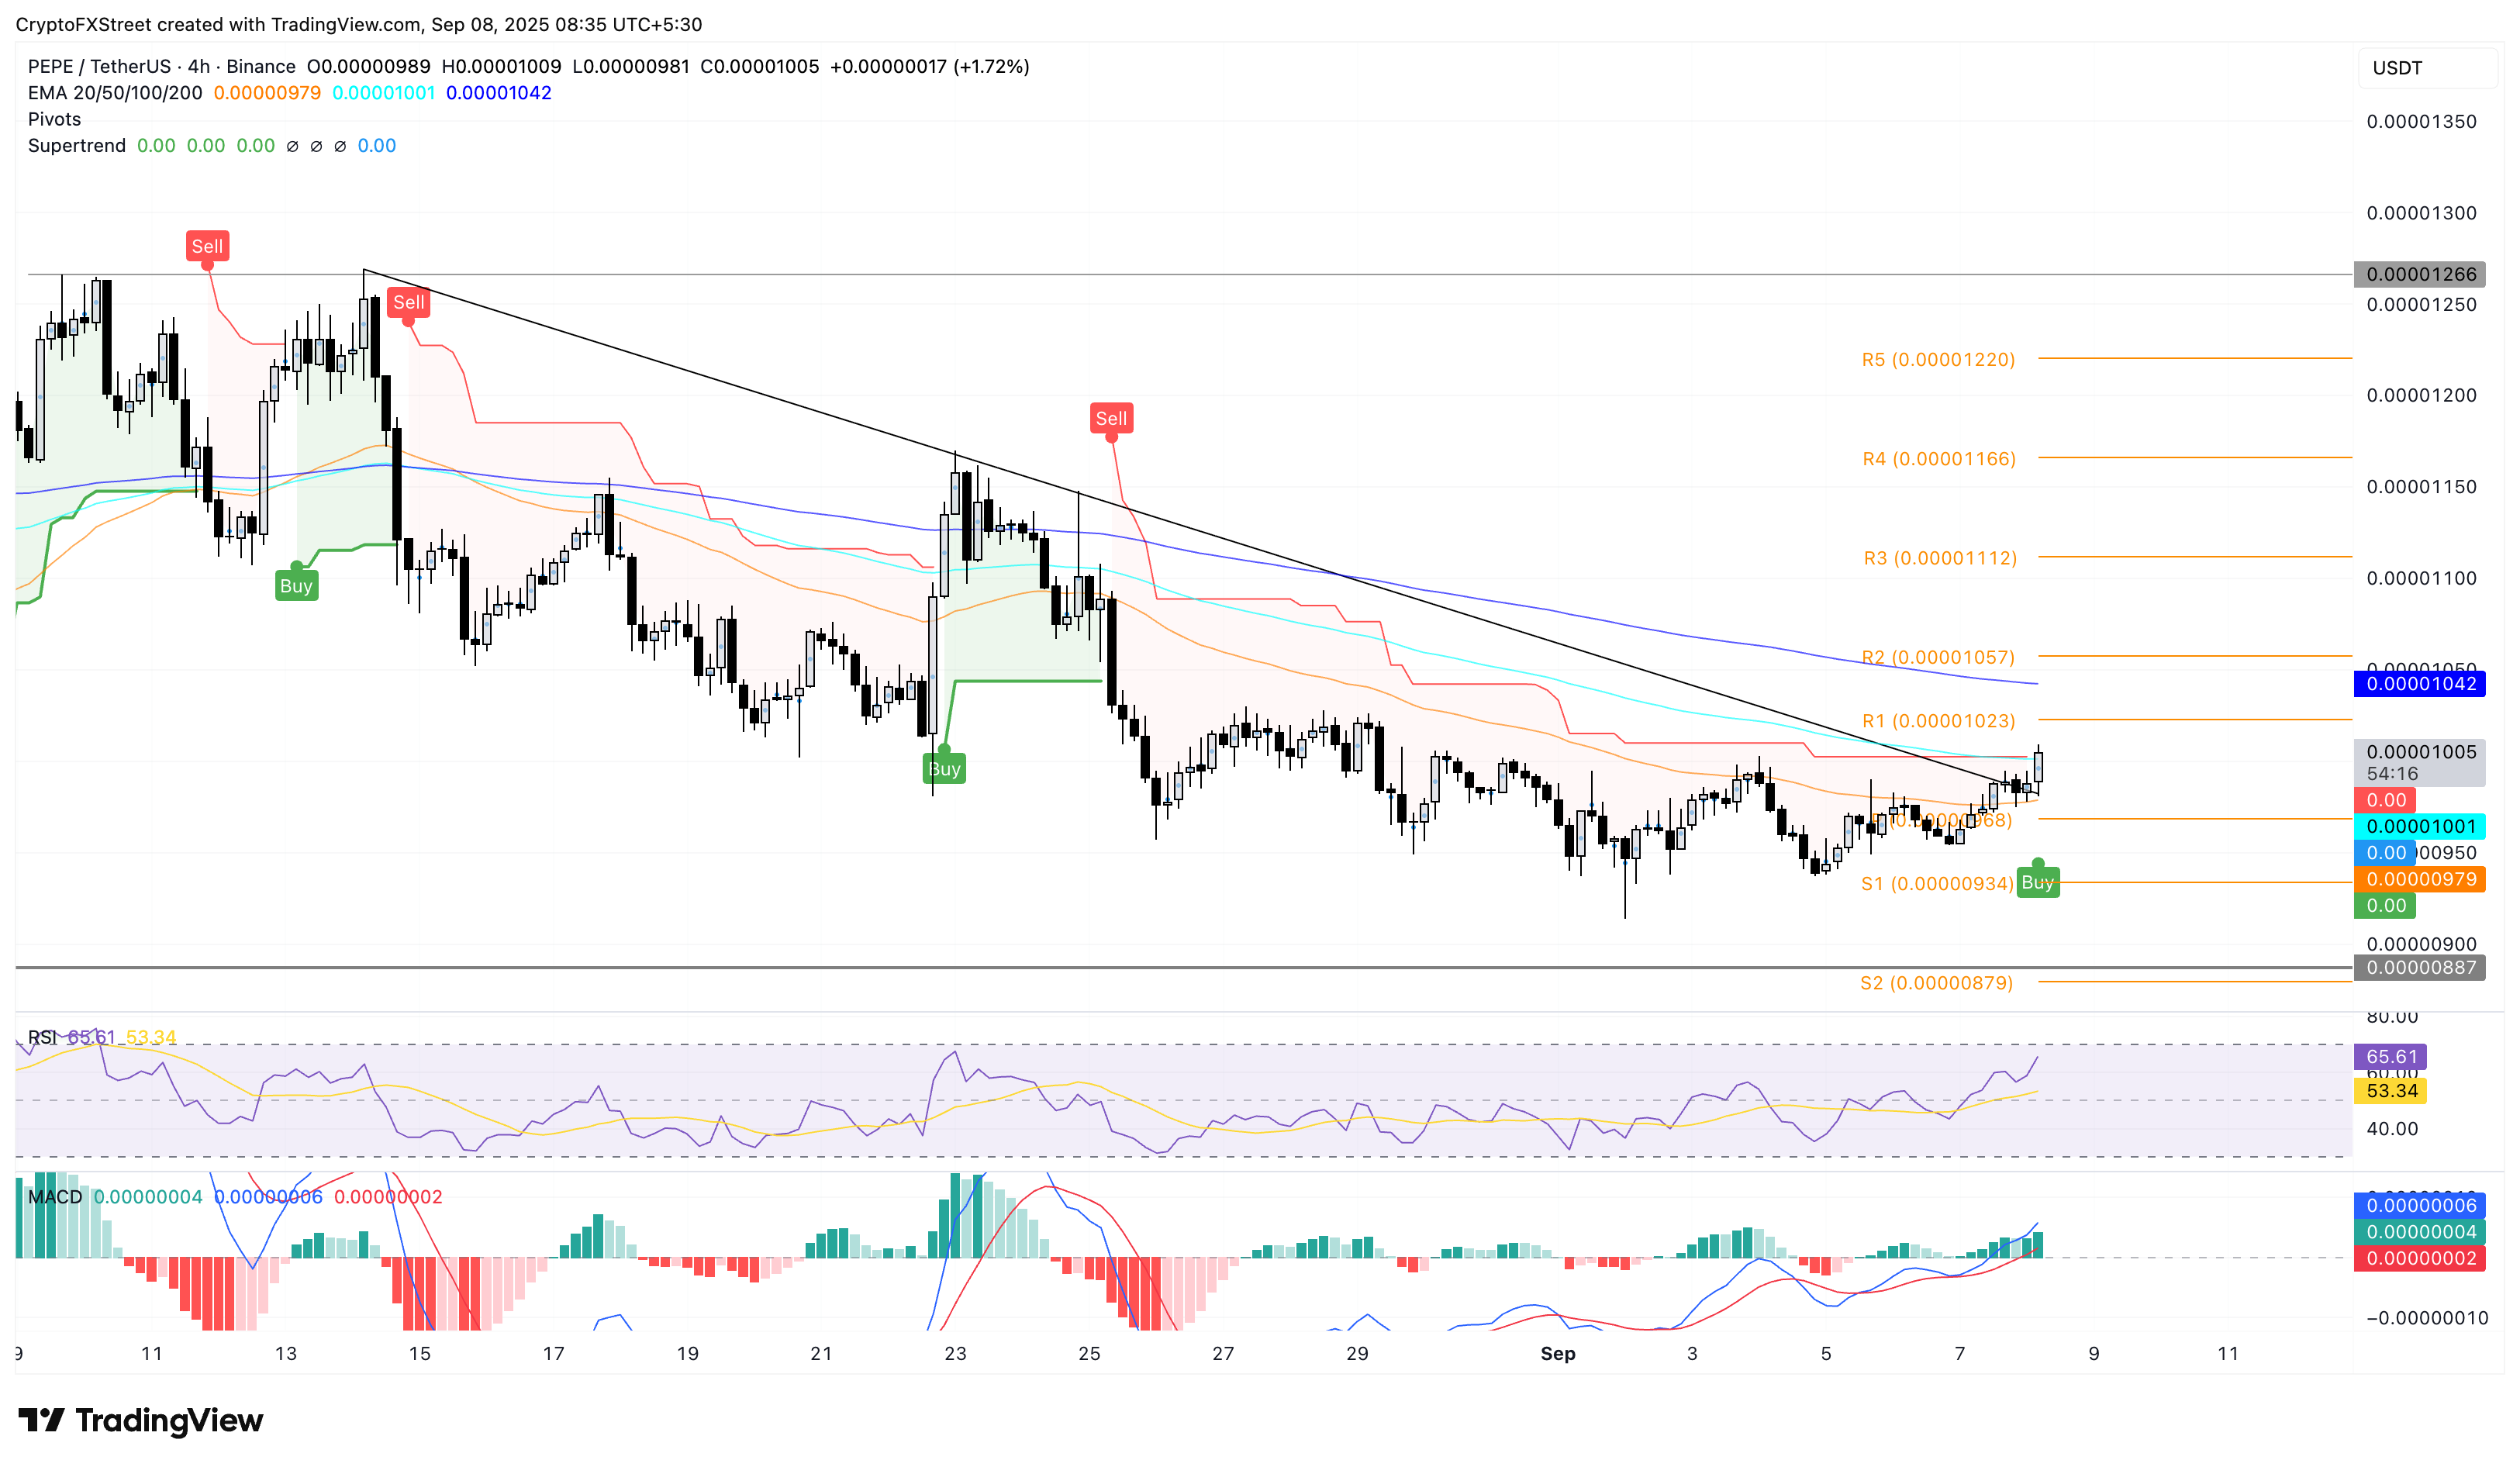
PEPE/USDT daily price chart.
However, if PEPE drops below the $0.00001000 psychological support, it could test the S1 pivot support level at $0.00000934, invalidating the breakout rally.
