Polygon Price Forecast: POL Surges as Bullish On-Chain Metrics Signal Strong Upside Momentum

POL rockets upward as blockchain data reveals massive whale accumulation and network activity hitting unprecedented levels.
On-Chain Firepower
Network transactions just smashed previous records while large holders continue stacking POL at an alarming rate. Smart money isn't just dipping toes—they're diving in headfirst.
Market Mechanics
Liquidity patterns show institutional players positioning for what could be the next major leg up. Trading volume exploded 300% as derivatives markets flip overwhelmingly bullish.
The Polygon ecosystem keeps eating Ethereum's lunch while traditional finance guys still debate whether crypto is 'real'—meanwhile, their clients miss another 100% move.
POL’s derivatives and on-chain metrics show bullish bias
Futures’ OI in Polygon at exchanges rose from $115.46 million on Friday to $177.29 million on Monday, the highest level since December 10 and has been consistently rising. Rising OI represents new or additional money entering the market and new buying, which could fuel the current POL Price rally.
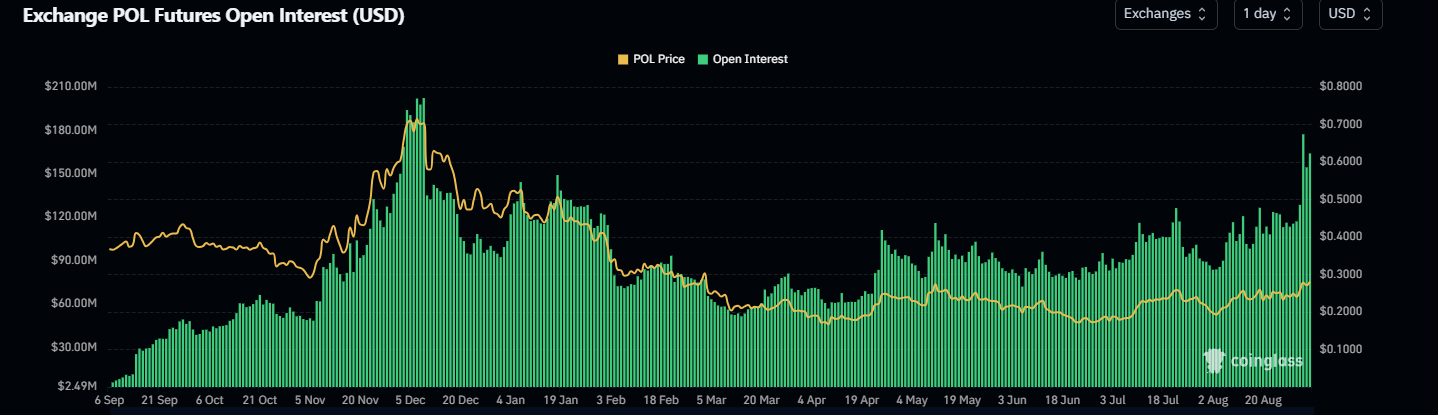
Polygon Open Interest chart. Source: Coinglass
Data from crypto intelligence tracker DefiLlama shows that Polygon’s stablecoin market capitalization has risen sharply since mid-August and currently stands at $2.95 billion on Tuesday, the highest level since mid-July 2021. Such stablecoin activity and value increase on the POL project indicate a bullish outlook, as they boost network usage and can attract more users to the ecosystem.
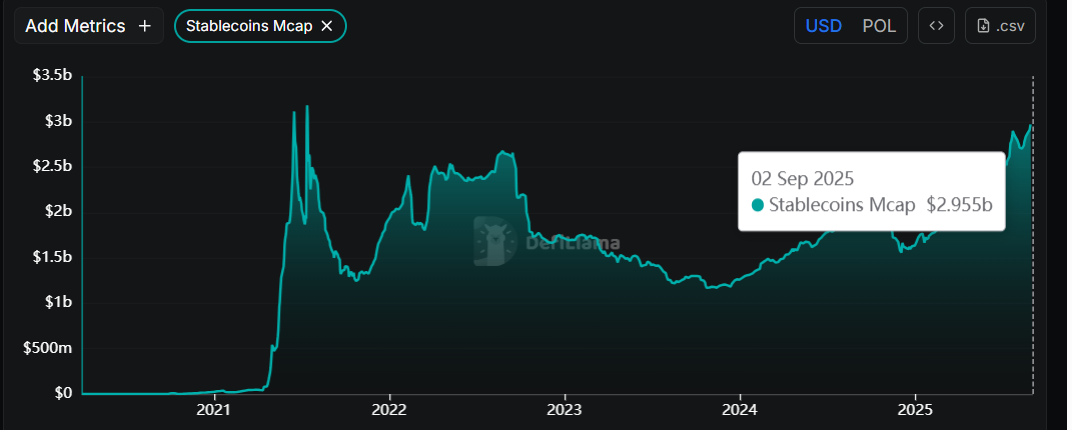
POL stablecoin market capitalization chart. Source: DefiLlama
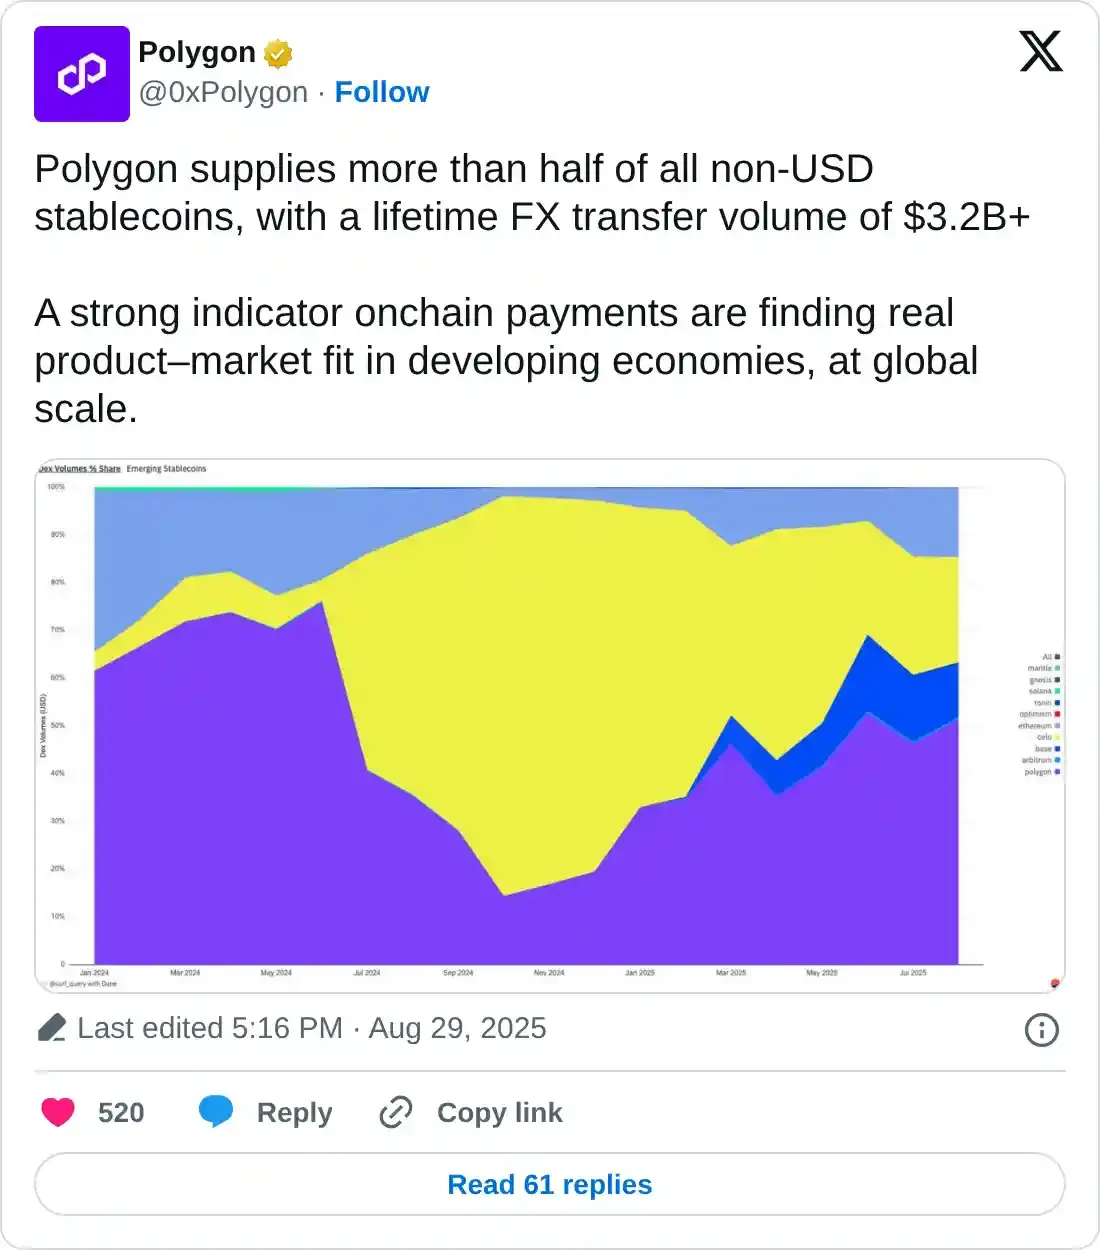
Additionally, Polygon supplies more than half of all non-USD stablecoins, with a lifetime transfer volume of $3.2 billion, further supporting the bullish view.
Polygon Price Forecast: POL momentum indicator hints at a bullish rally
Polygon price rallied over 8% on Sunday and broke above the key resistance zone extending from $0.25–$0.27 levels. On Monday, it declined slightly, retested, and found support in the zone. At the time of writing on Tuesday, it is extending its gains by more than 5%, trading above $0.28.
If Polygon continues its upward momentum and closes above its weekly resistance at $0.29, it could extend the rally toward its next daily resistance at $0.33.
The Relative Strength Index (RSI) on the daily chart reads 64, above its neutral level of 50 and points upward, indicating strong bullish momentum. The Moving Average Convergence Divergence (MACD) indicator showed a bullish crossover on Sunday, generating a buy signal and further supporting the bullish view.
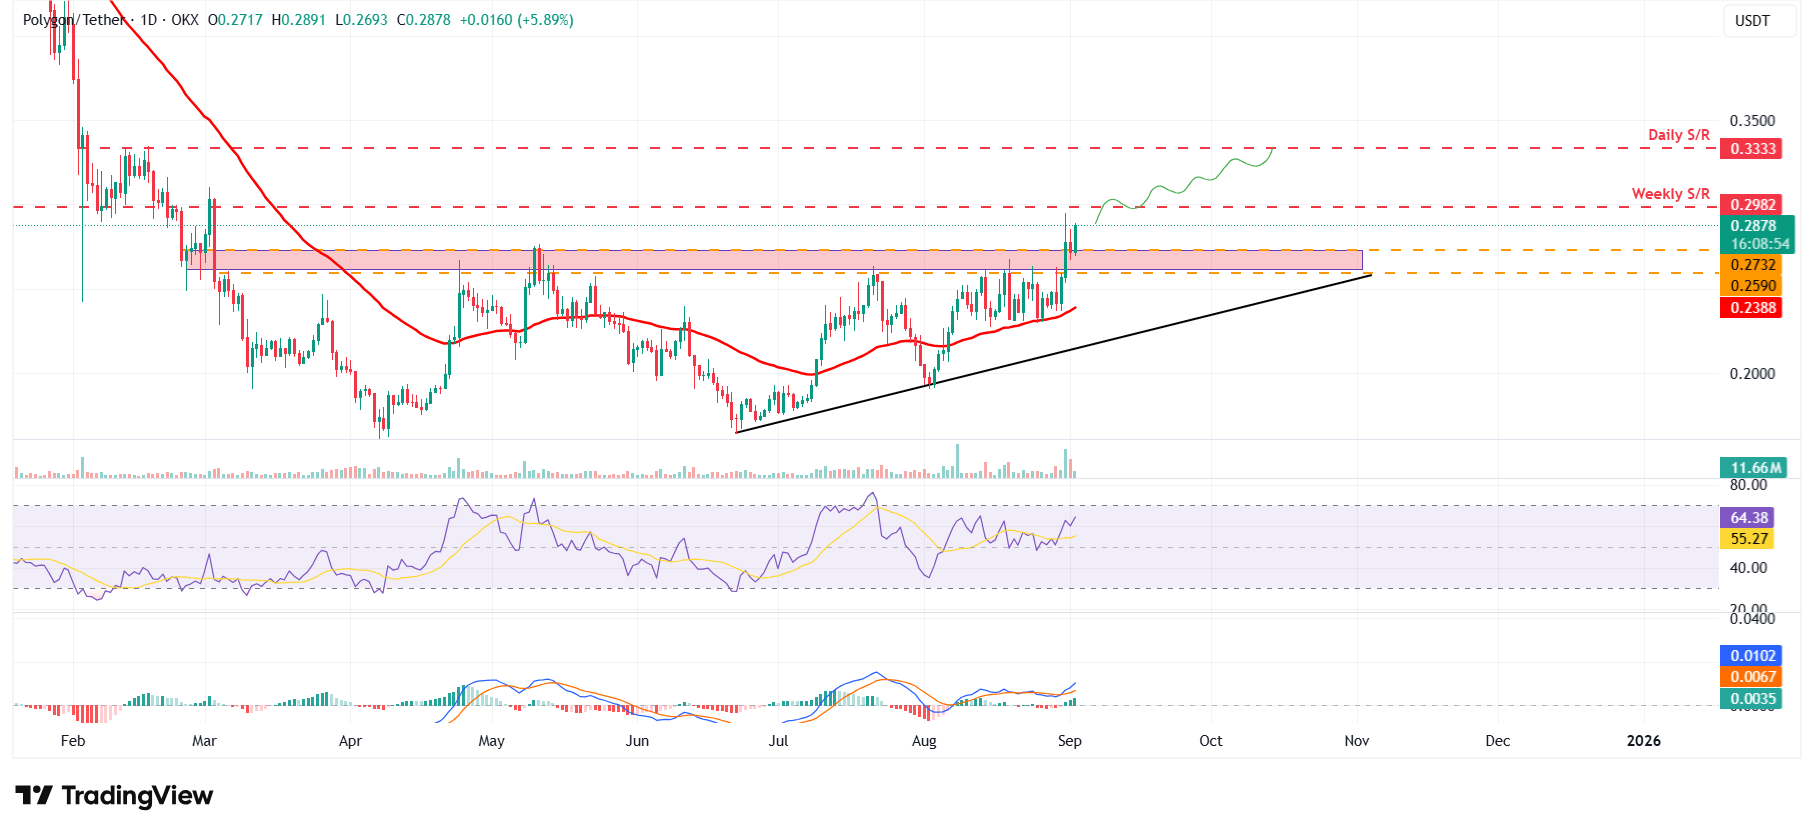
POL/USDT daily chart
However, if POL faces a correction, it could extend the decline toward its lower boundary of the support zone at $0.25.
