XRP, BNB and Solana: Why September Could Be Their Toughest Month Yet

Major altcoins face September headwinds as market sentiment shifts
The Crypto Chill
XRP, BNB, and Solana investors brace for impact as seasonal patterns and regulatory uncertainty converge. These digital assets—once darlings of the bull run—now navigate what historically ranks as crypto's least favorable month. Trading volumes dip, liquidity tightens, and even the most ardent holders feel the squeeze.
Market Realities Bite
Institutional money pulls back faster than a hedge fund manager from risk. Retail traders—bless their optimistic hearts—keep buying the dip while whales quietly redistribute holdings. The entire ecosystem holds its breath waiting for the next catalyst, any catalyst, to break the pattern. Meanwhile, traditional finance guys smirk about 'digital gold' weathering storms about as well as a sandcastle.
September's verdict? Prove your worth beyond hype cycles and influencer endorsements. The market's patience wears thinner than a trader's profit margins after leverage gets liquidated.
XRP price analysis
XRP is currently consolidating under the psychologically important $3 level. At the time of writing on Monday, XRP trades at $2.7630. The native token of the XRP Ledger is in a state of consolidation within a tight range between $3.3512 and $2.7014, marked as the red region in the XRP/USDT daily price chart.
Two key momentum indicators, the Relative Strength Index (RSI) and the Moving Average Convergence Divergence (MACD), support a bearish thesis. The RSI reads 39 and is sloping downward, and the red histogram bars under the neutral line on the MACD signal an underlying negative momentum in the xrp price trend.
Support at $2.60 and $2.35 are two key levels for XRP, and a 5.6% decline could send the altcoin to sweep liquidity at the support.
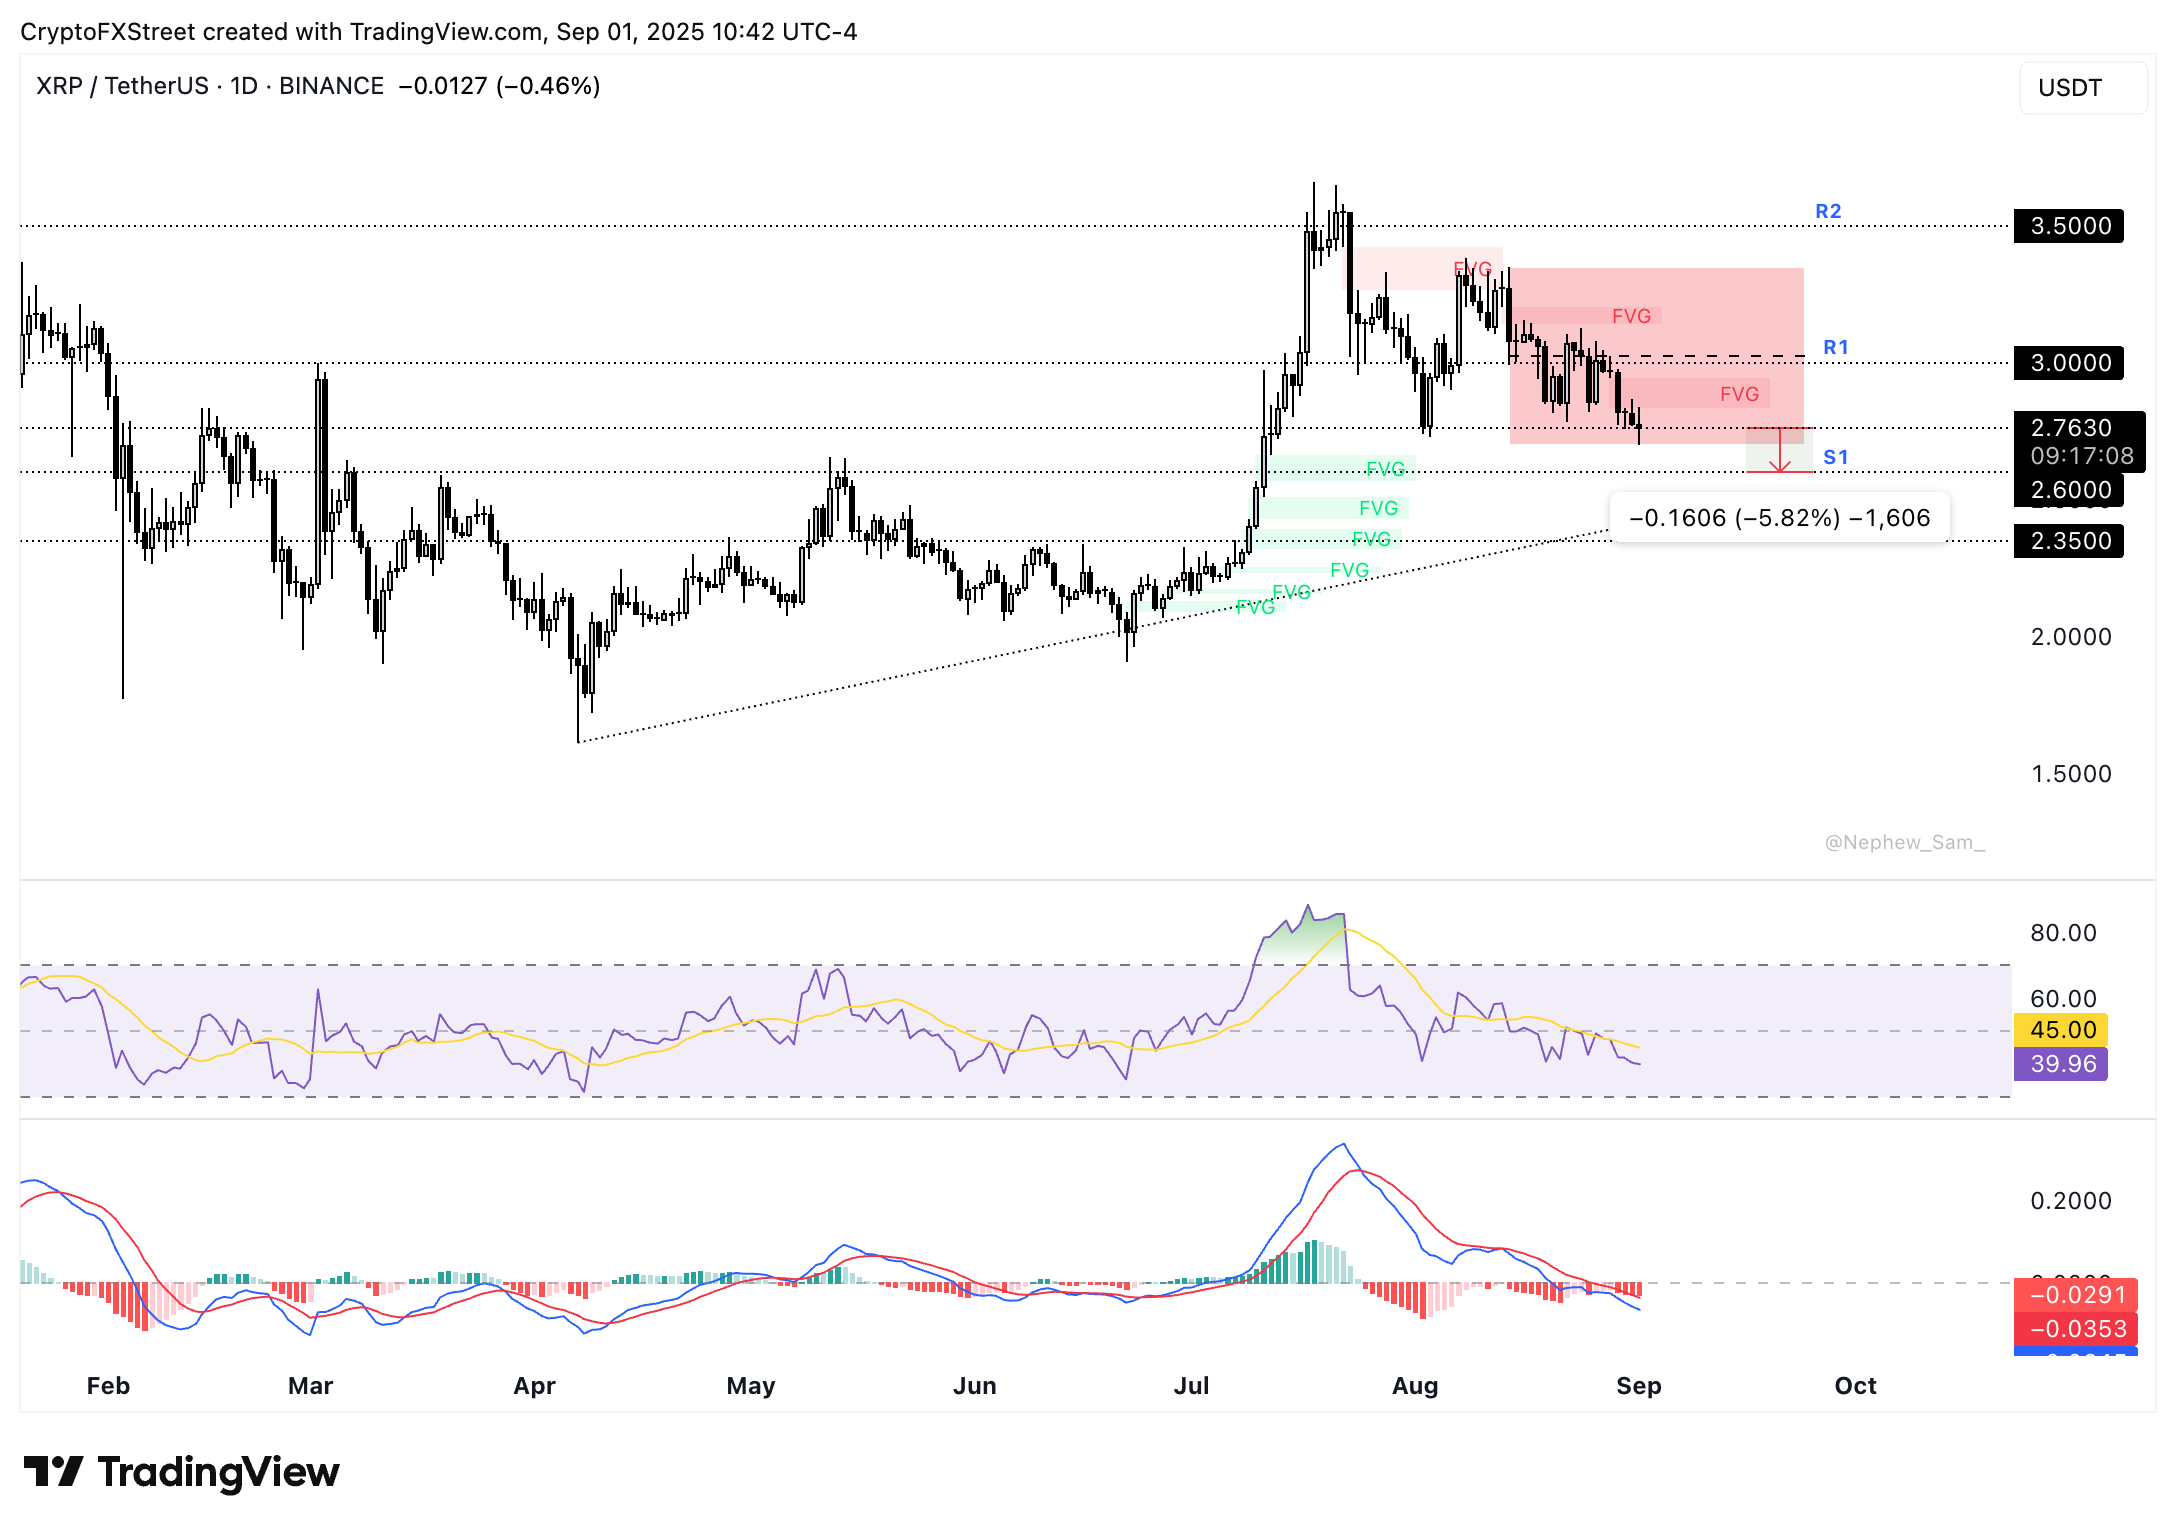
XRP/USDT daily price chart
A daily candlestick close above $3 WOULD invalidate the bearish thesis.
BNB price analysis
BNB price slipped nearly 3% in the last seven days as the token is currently consolidating close to support at $850 on Monday. The native token of the exchange is in an upward trend and wiped its gains from late August where price hit a peak above $900, as seen in the BNB/USDT daily price chart.
BNB could find support at S1 and S2, at $820 and $785, the two key levels for the token.
The RSI reads 53, and the MACD shows an underlying negative momentum in BNB price trend.
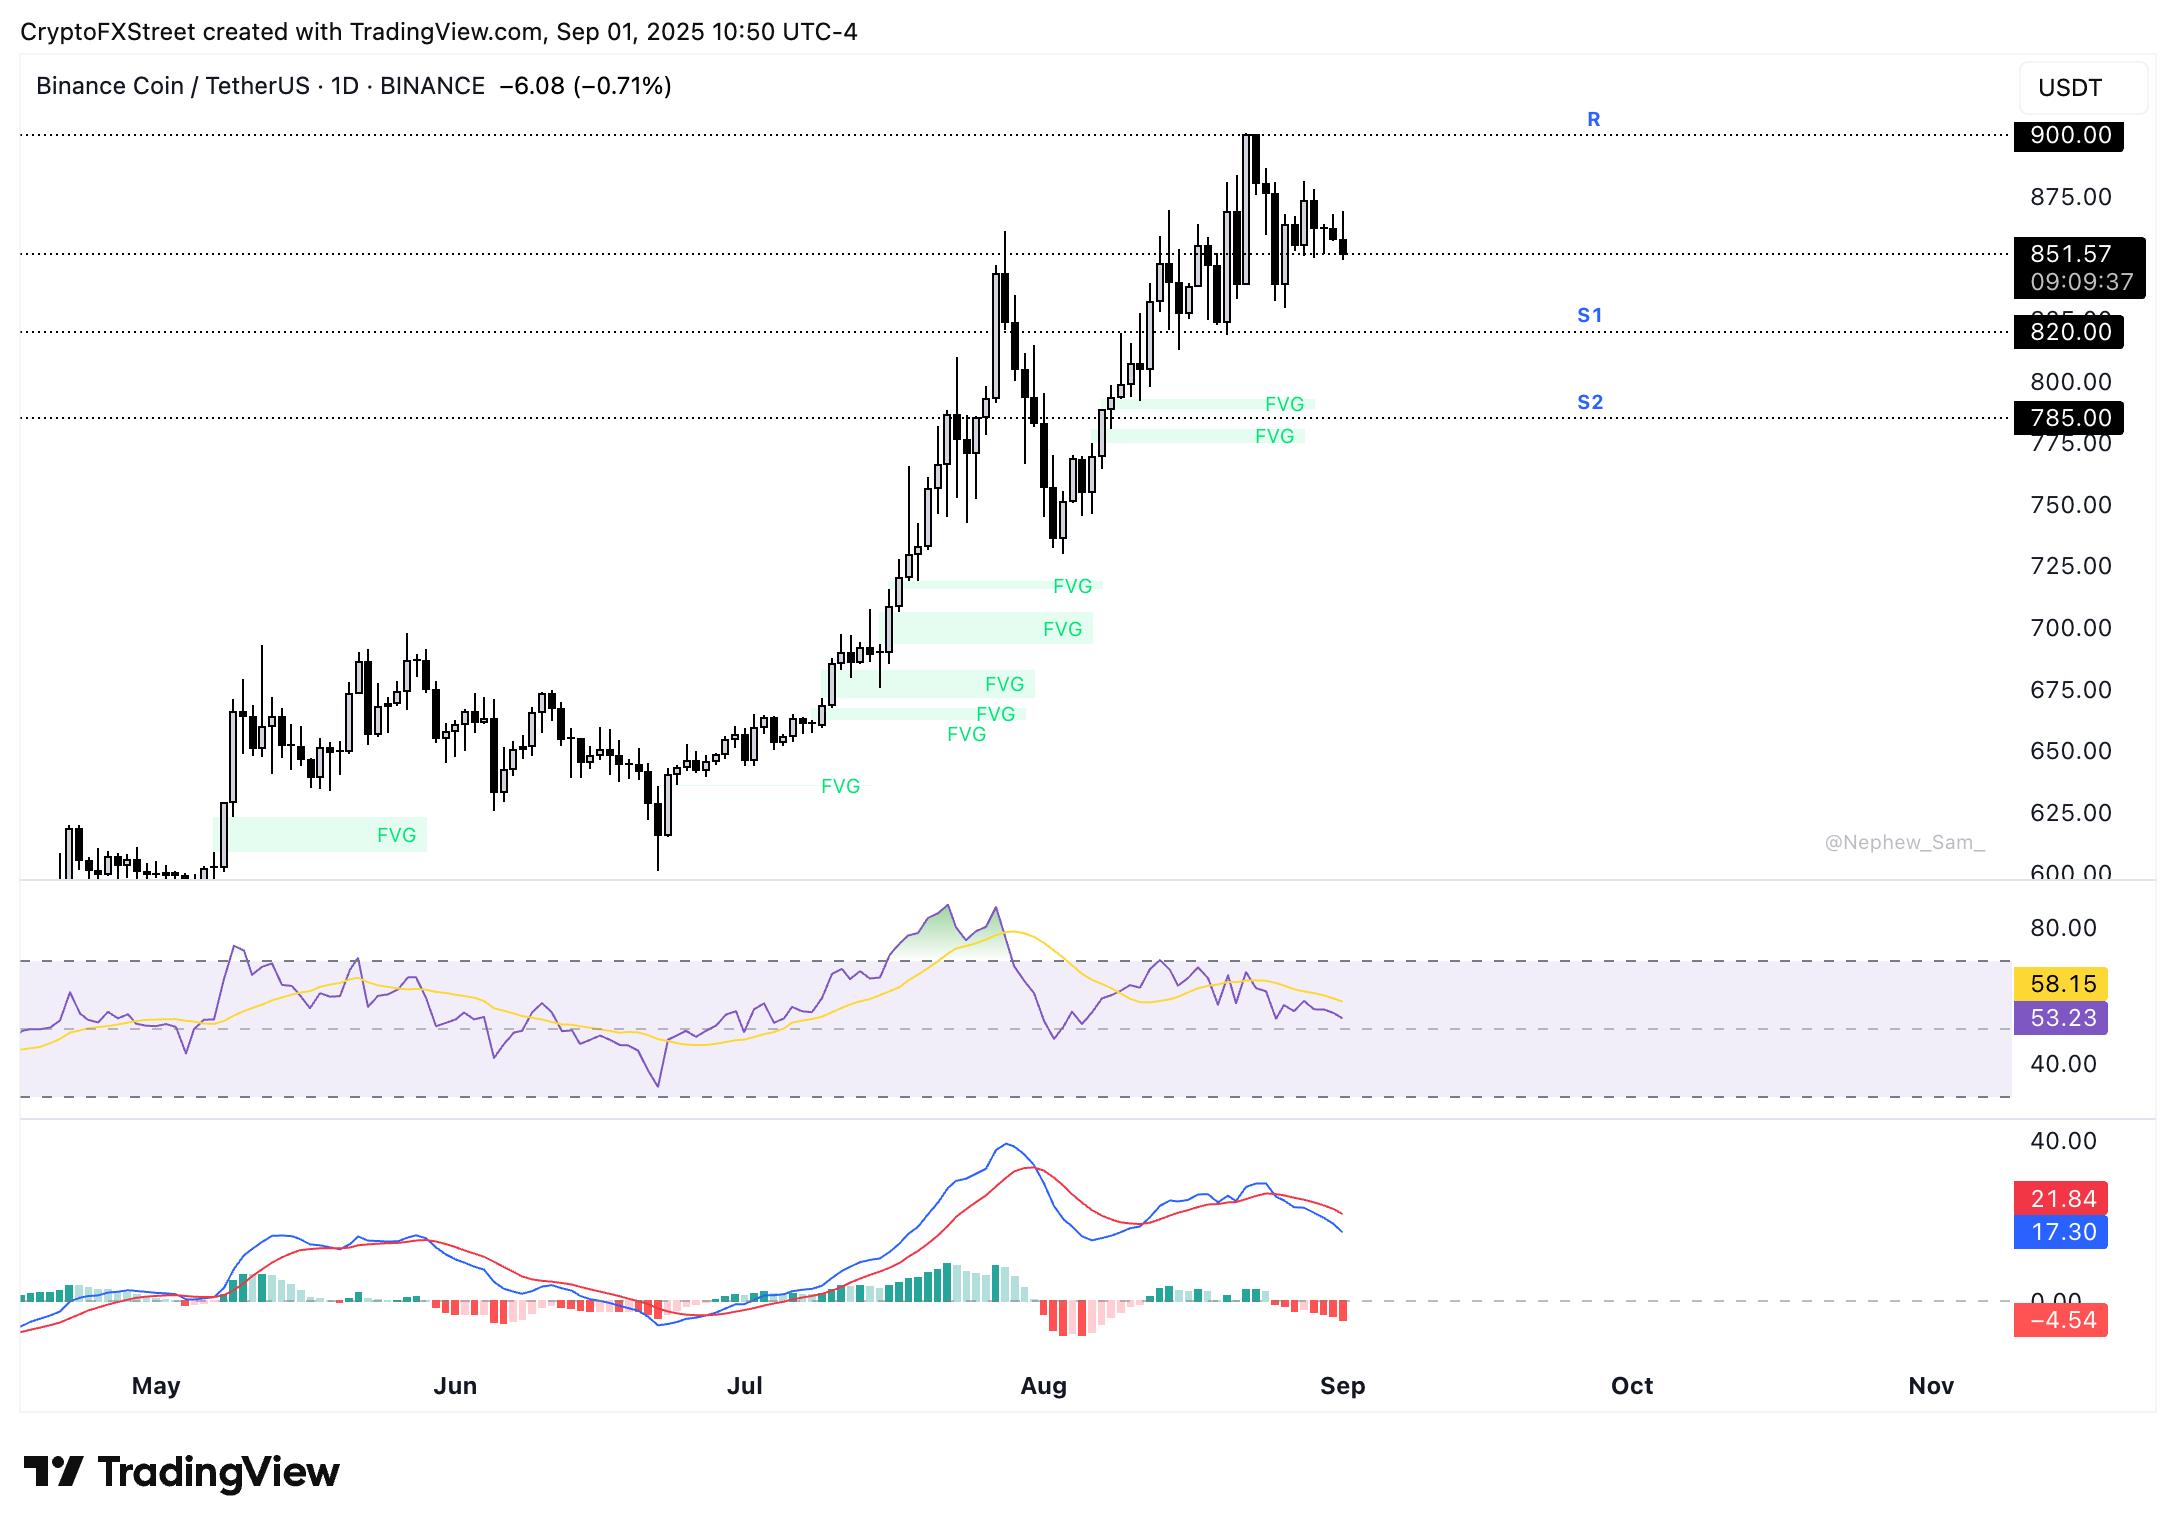
BNB/USDT daily price chart
If BNB sweeps liquidity at S1 and attempts a recovery, the bearish thesis is likely to be invalidated. BNB could test resistance at the $900 level in its climb toward a new all-time high.
Solana price analysis
Solana wiped out 3% of its value in the last seven days, similar to BNB. SOL trades at $200.80, holding steady above the support at $200. Two key resistances for Solana are price levels previously respected as resistance at $228.24 and $250, marked by R1 and R2, respectively.
SOL hit an all-time high at $295.83 on January 19 and a sustained upward trend could push Solana to re-test this level.
The MACD supports a bullish thesis, while the RSI is neutral. The RSI reads 54, slightly above neutral. However, the current consolidation close to $200 has raised concerns of a correction.
The August 20 low of $126 and the August 26 low of $185 are support levels for Solana.
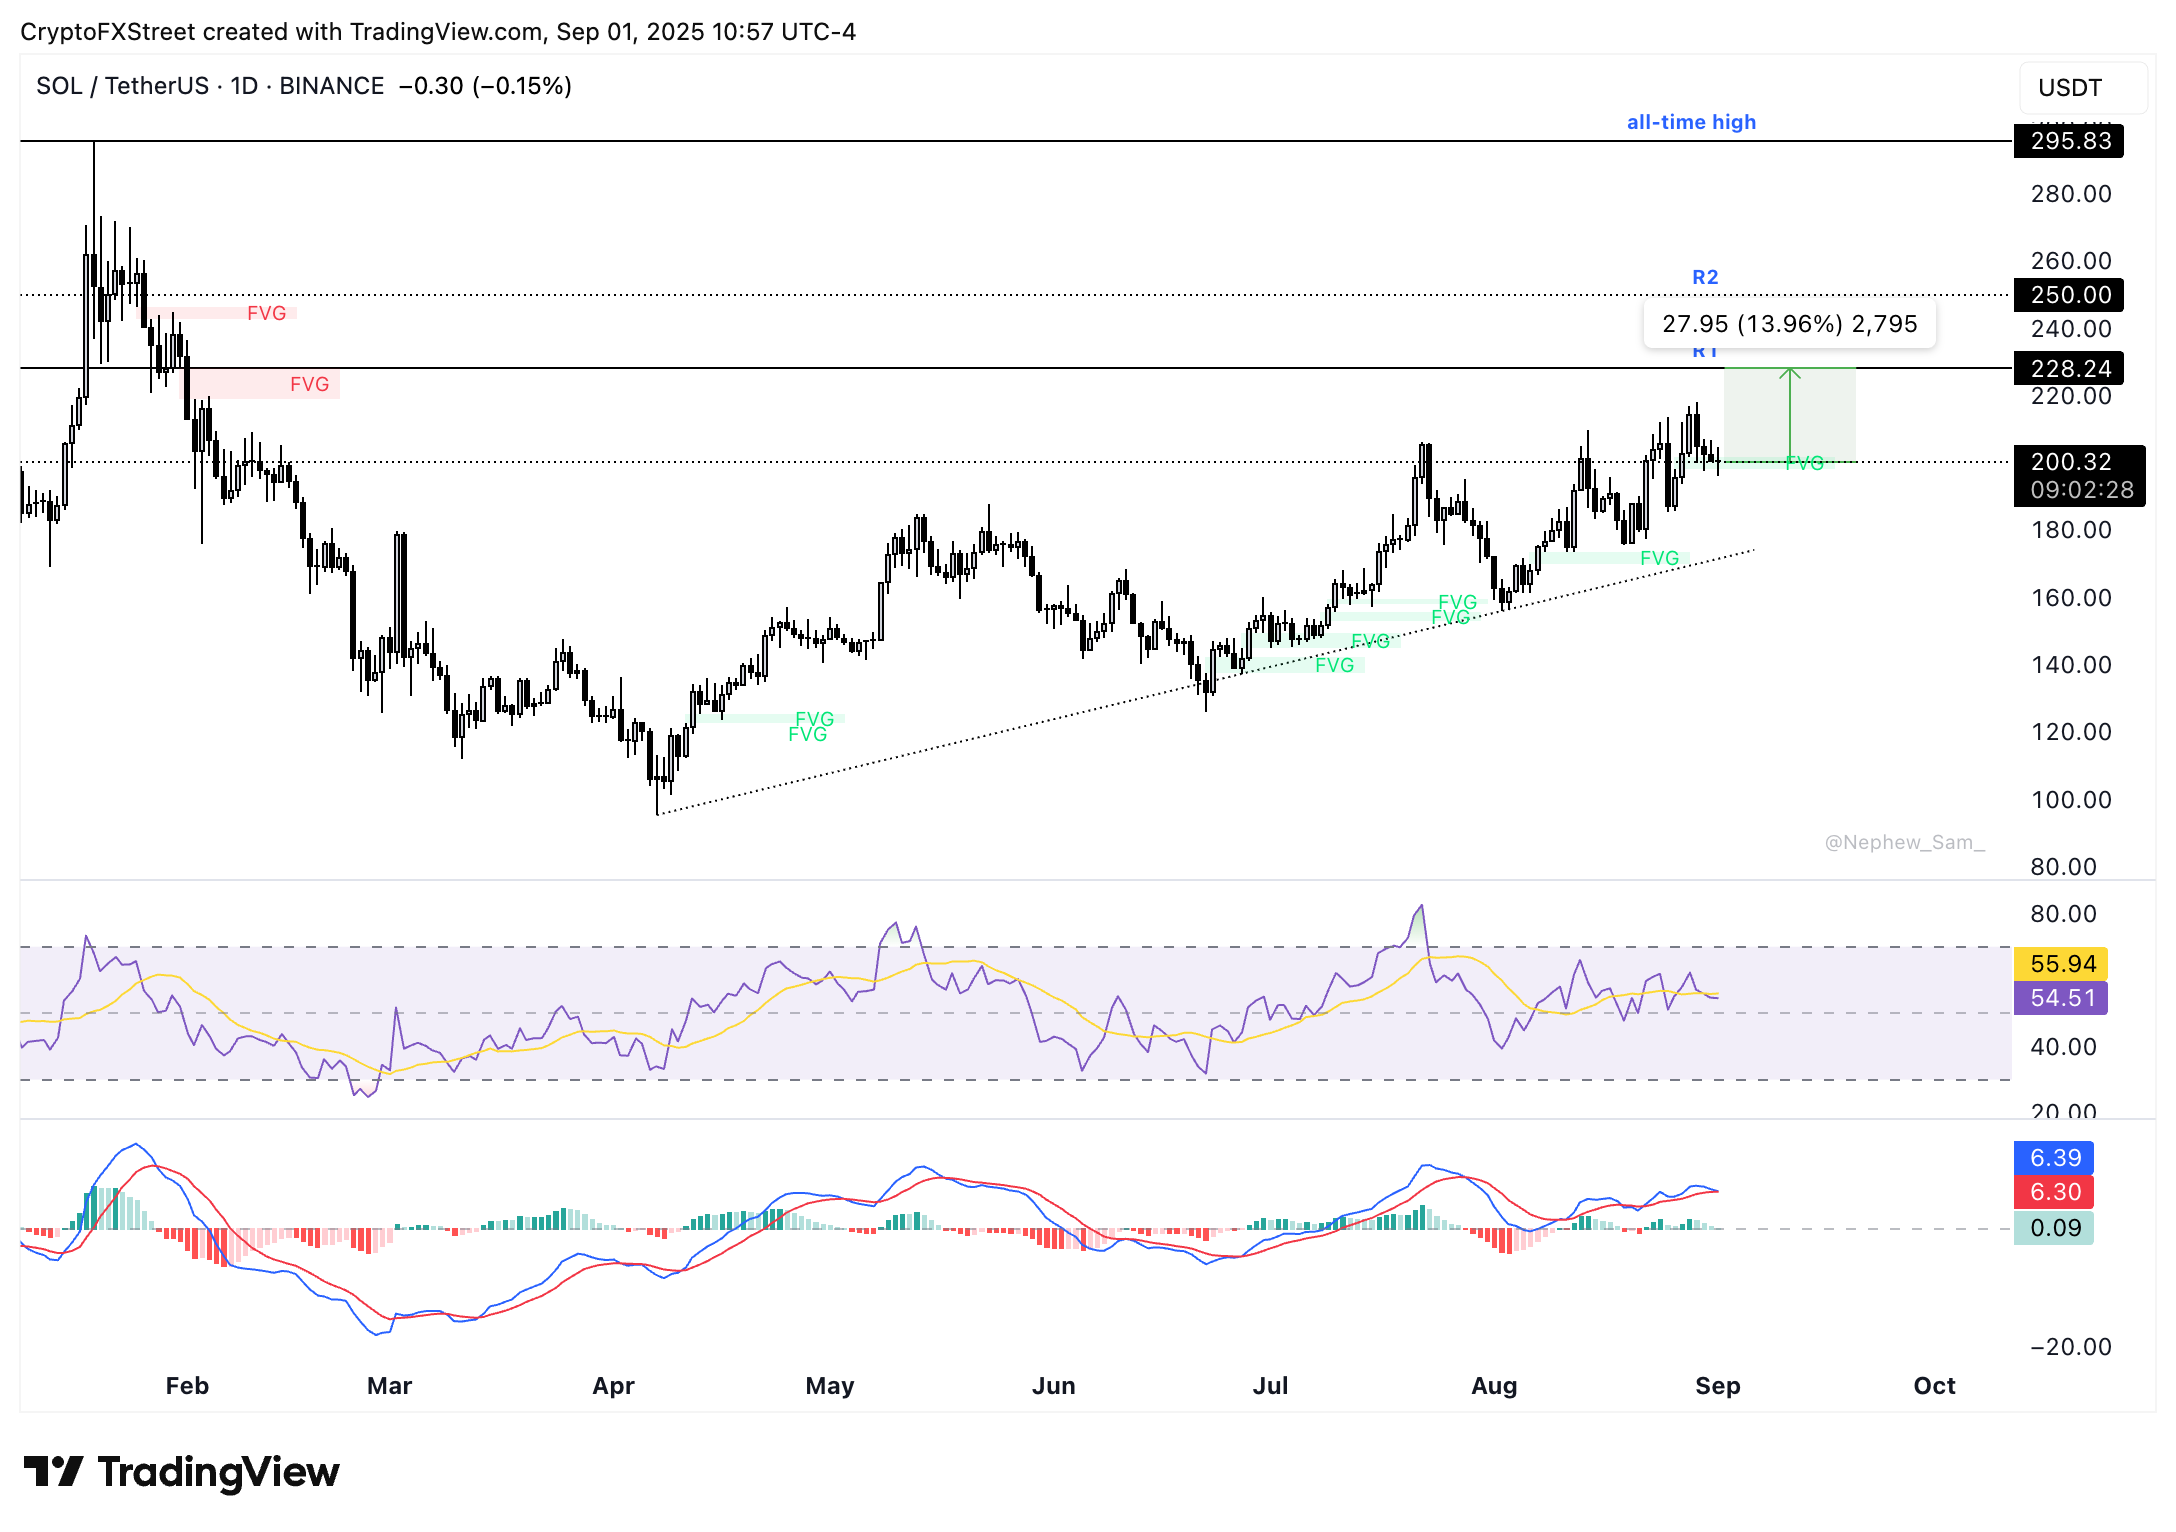
SOL/USDT daily price chart
A daily candlestick close under the $200 could invalidate the bullish thesis and open doors to further correction in Solana.
