Polkadot Fuels Paraguay’s $6M Innovation Hub Tokenization as Parachains TVL Surges

Polkadot just supercharged Paraguay's blockchain ambitions—backing a $6 million innovation hub that's tokenizing everything from infrastructure to intellectual property.
Parachains Pumping
Total value locked across Polkadot's parachains isn't just climbing—it's exploding. The ecosystem's bleeding-edge architecture finally proves it can handle real-world asset tokenization at scale.
South American Sandbox
Paraguay's betting big on becoming Latin America's crypto epicenter. This hub doesn't just experiment—it deploys. Think digital property rights, tokenized public works, and sovereign blockchain infrastructure.
Smart money's watching whether this $6 million experiment delivers more than just another 'blockchain innovation' PowerPoint deck—because let's be honest, finance loves a good buzzword buffet.
Parachains TVL crosses $300 million as Paraguay’s innovation hub tokenized equity comes to Polkadot
Polkadot announced the tokenization of Paraguay’s innovation hub district, Assuncion Innovation Valley (AIV), on Tuesday, in partnership with Moonbeam, a parachain, and Better Use Blockchain (BuB), a tokenization platform on Moonbeam.
Parachains are custom, parallel chains built on the Polkadot network. The innovation hub will be tokenized into 130,000 equity shares, backed by $6 million. These equity tokens will enable holders to vote and profit from shares in accordance with Paraguayan regulations.
DeFiLlama data shows the Moonbeam TVL at $8.42 million, with Hydration leading among parachains, boasting a $287.27 million TVL, which accounts for a 89.72% share. This translates to the $320 million TVL of the parachains ecosystem.
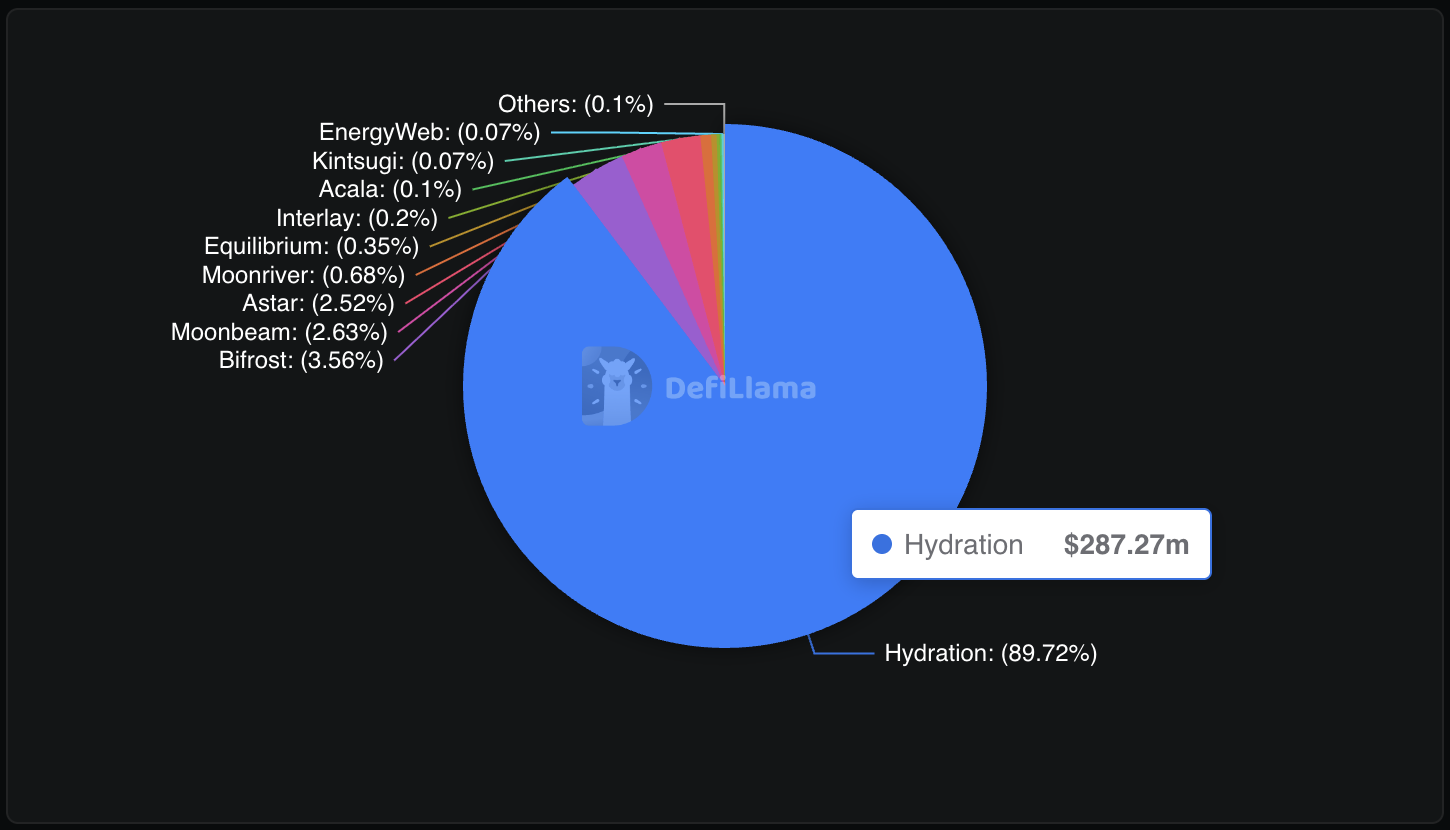
Parachains TVL. Source: DeFiLlama
Polkadot within a triangle keeps the situation at balance
Polkadot rebounds within a symmetrical triangle pattern on the daily chart, challenging the 50-day Exponential Moving Average (EMA) at $3.928. The multi-chain blockchain token could target the 200-day EMA at $4.318, moving close to the triangle’s upper boundary trendline.
If DOT closes above this dynamic resistance, it could extend the rally to the $5.297 mark, aligning with the R2 pivot level.
The Relative Strength Index (RSI) is at 49 on the daily chart, hovering under the halfway line and pointing upwards. A potential rise in RSI above the neutral line WOULD indicate a resurgence in bullish momentum, which could be a buy opportunity ahead of the pattern breakout.
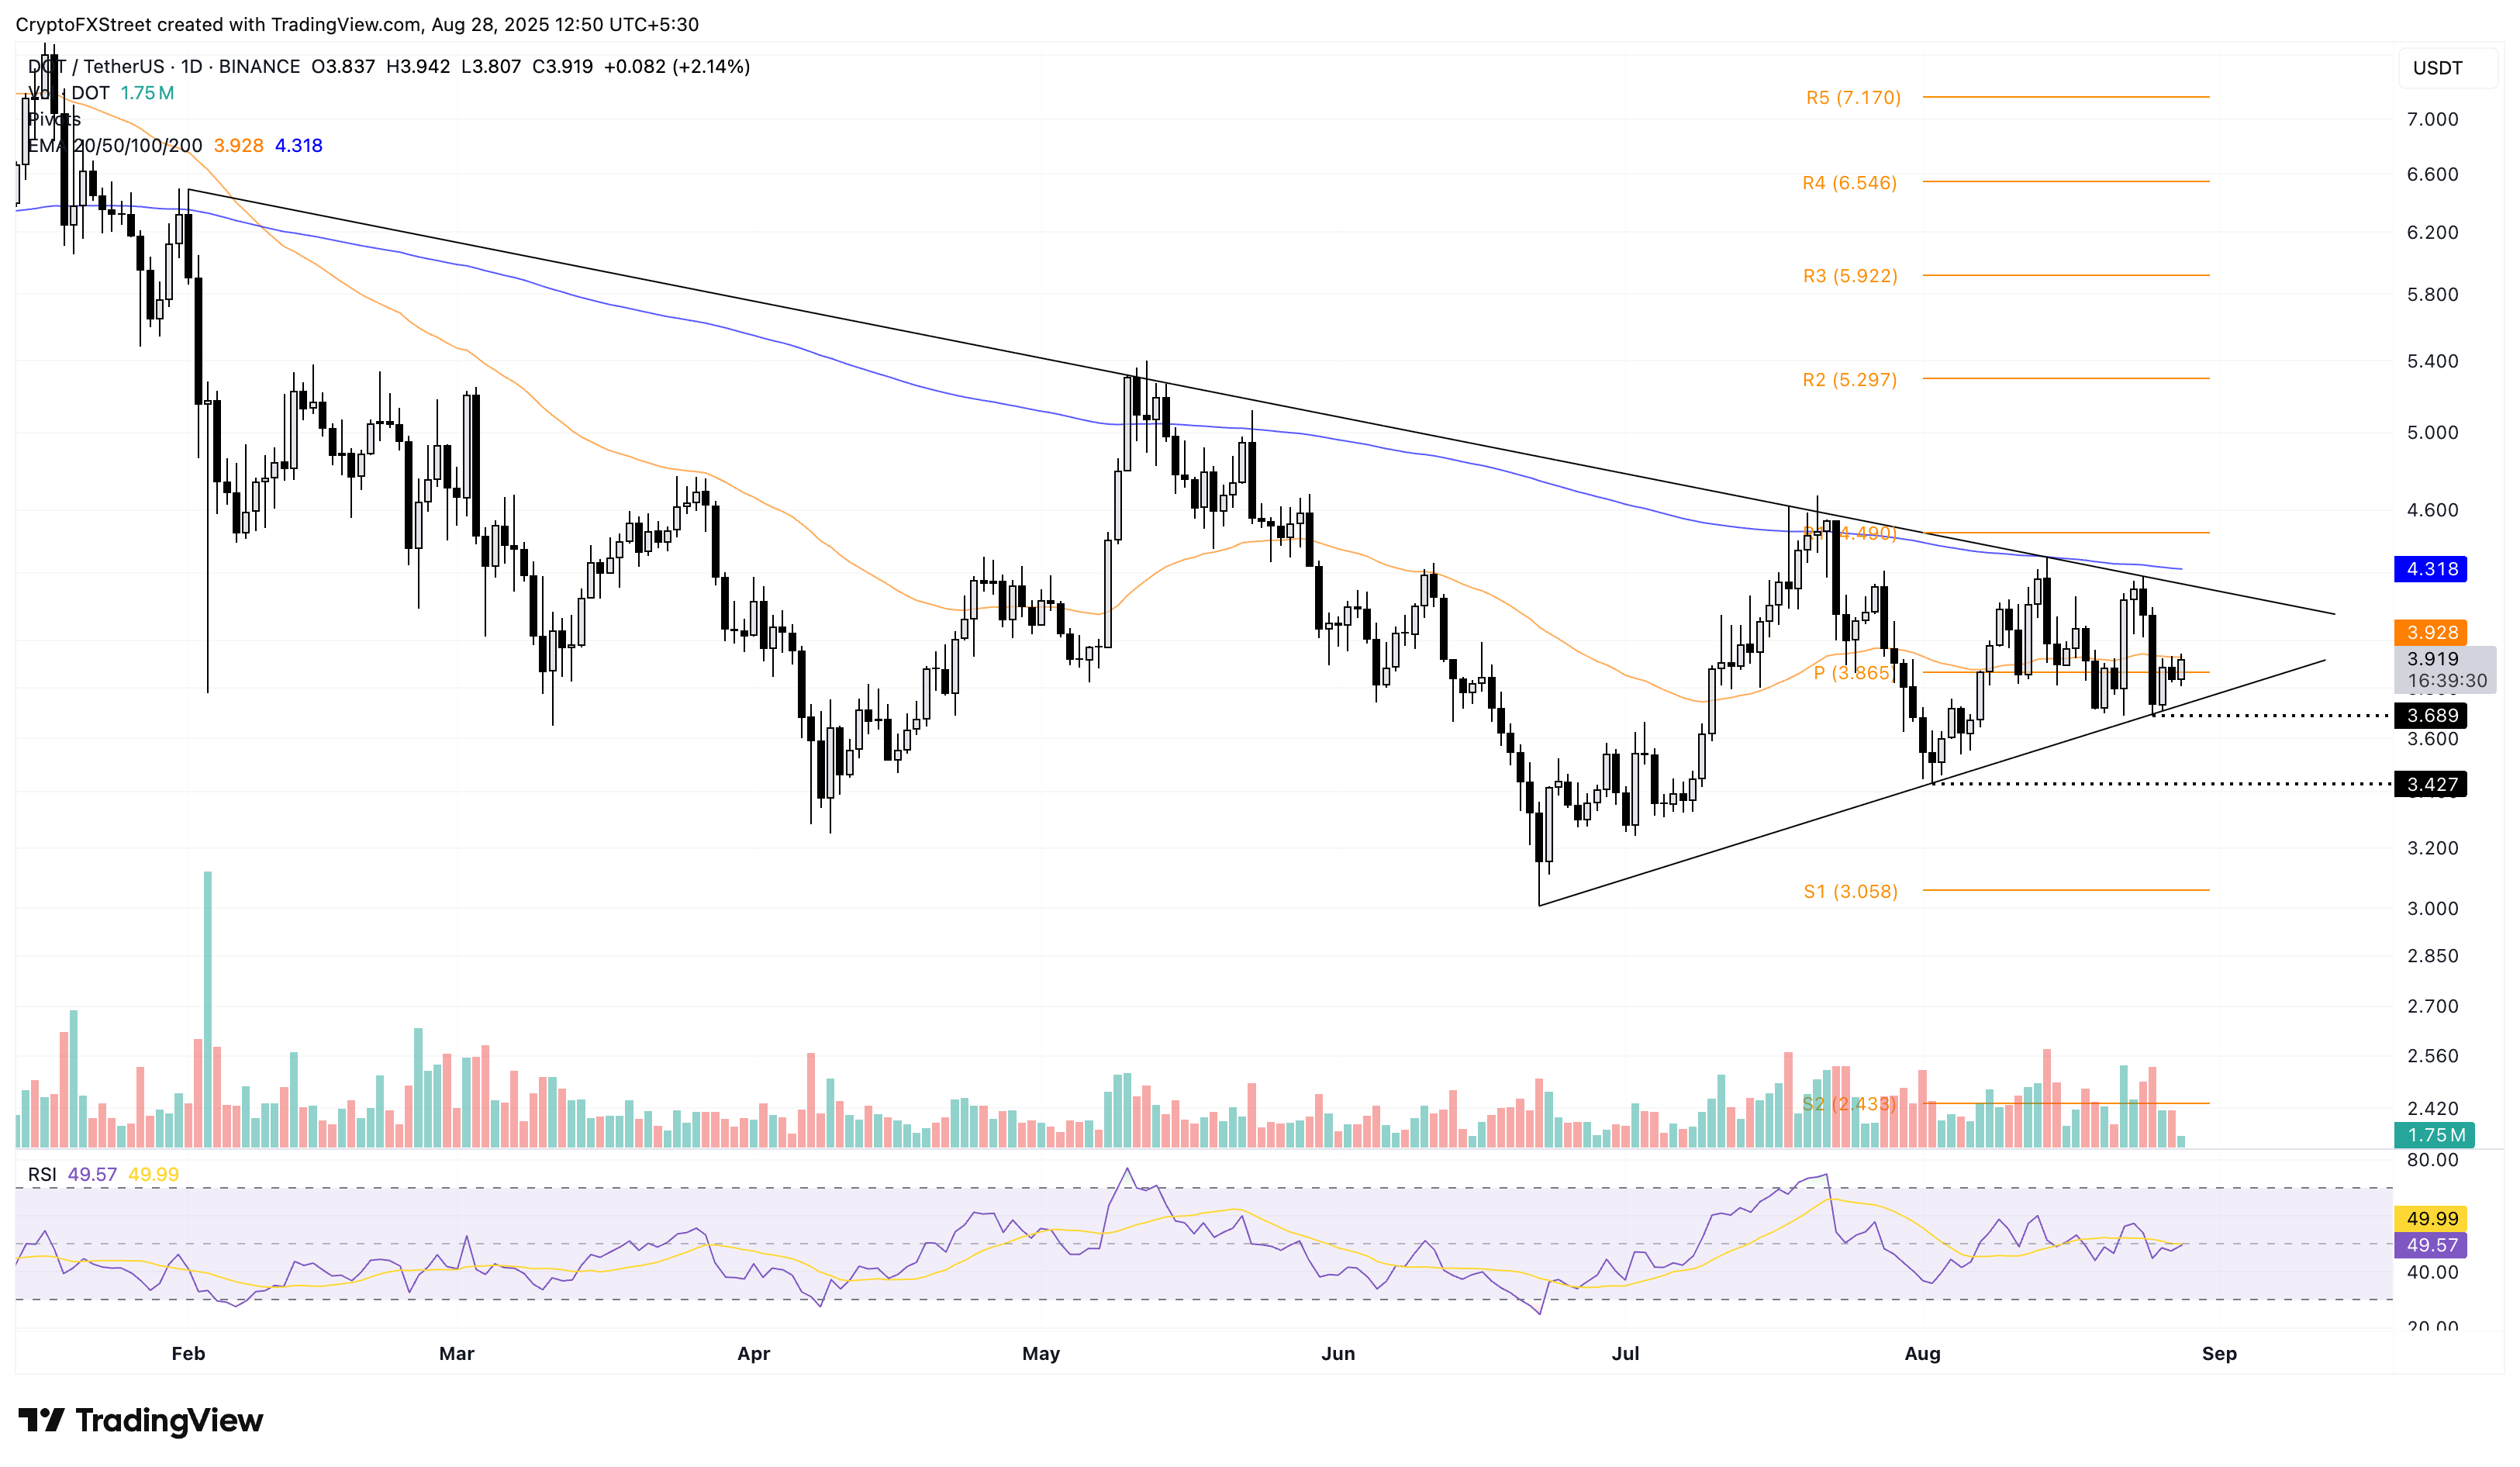
DOT/USDT daily price chart.
Looking down, if DOT slips below the support trendline or the $3.689 low from Monday, it would mark a bearish outcome of the price pattern. This case could drop Polkadot to the $3.427 low from August 2.
