Solana Price Alert: SOL Plunges Below $200 as Bearish Signals Intensify

Solana's momentum hits a wall as the asset tumbles under critical support.
Breaking Down the Breakdown
SOL slices through the $200 barrier—a level traders watched like hawks. That breach signals more than a dip; it suggests weakening confidence and technical deterioration. Trading volumes spike as panic sets in, while order books show more sellers than buyers lining up.
Behind the Bearish Turn
Market structure shifts toward distribution, not accumulation. Resistance levels now loom larger, and momentum indicators flash caution. Even the most optimistic bulls struggle to find silver linings in this chart—proving once again that in crypto, 'fundamentals' often take a backseat to sheer sentiment and leverage flushes.
What’s Next for SOL?
If selling pressure continues, lower support zones come into play. Traders eye previous consolidation areas, but there are no guarantees. Remember: in a market where 'number go up' is both strategy and prayer, sometimes the only thing predictable is volatility itself.
Rising liquidation risks a bearish spiral
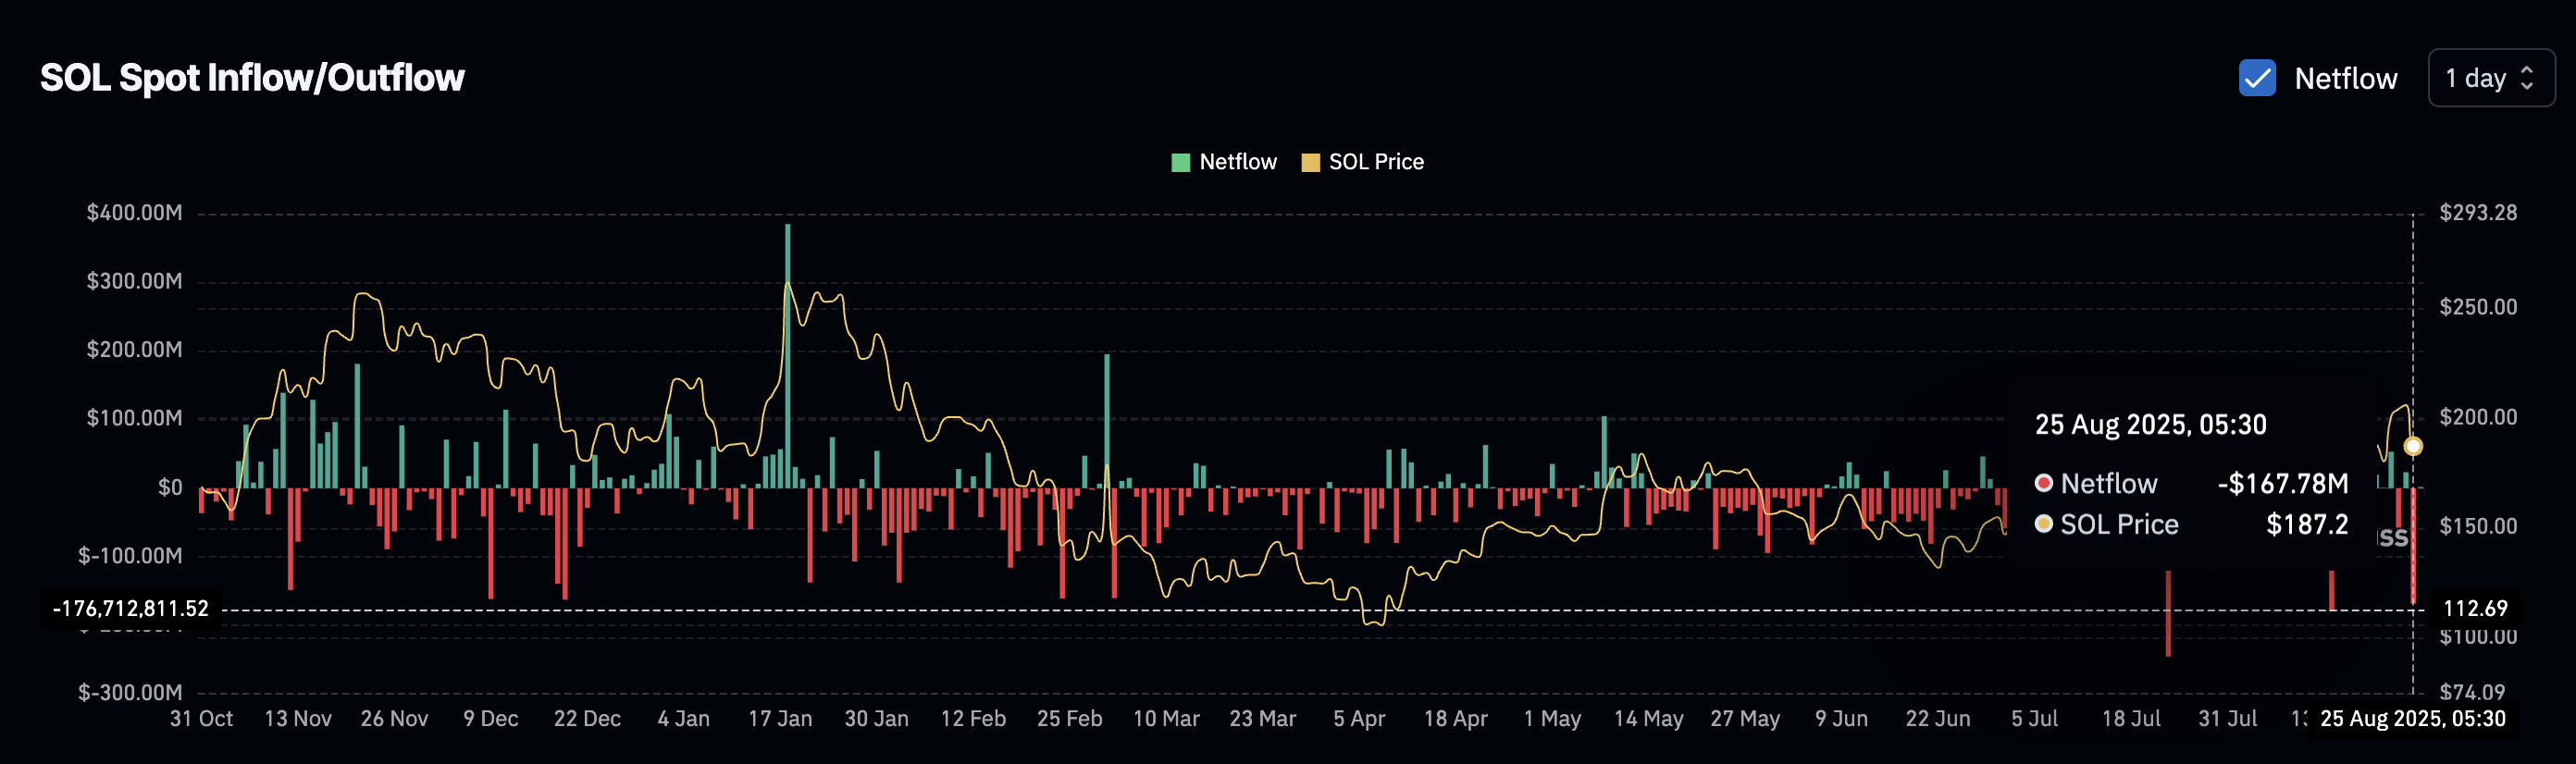
CoinGlass data shows the solana net outflow of $167.78 million on Monday as the collapsing spot price fueled liquidations and forced traders to withdraw tokens. The sharp increase in net outflow reached its third-highest level in 2025, following the July 23 and August 14 flash crashes.
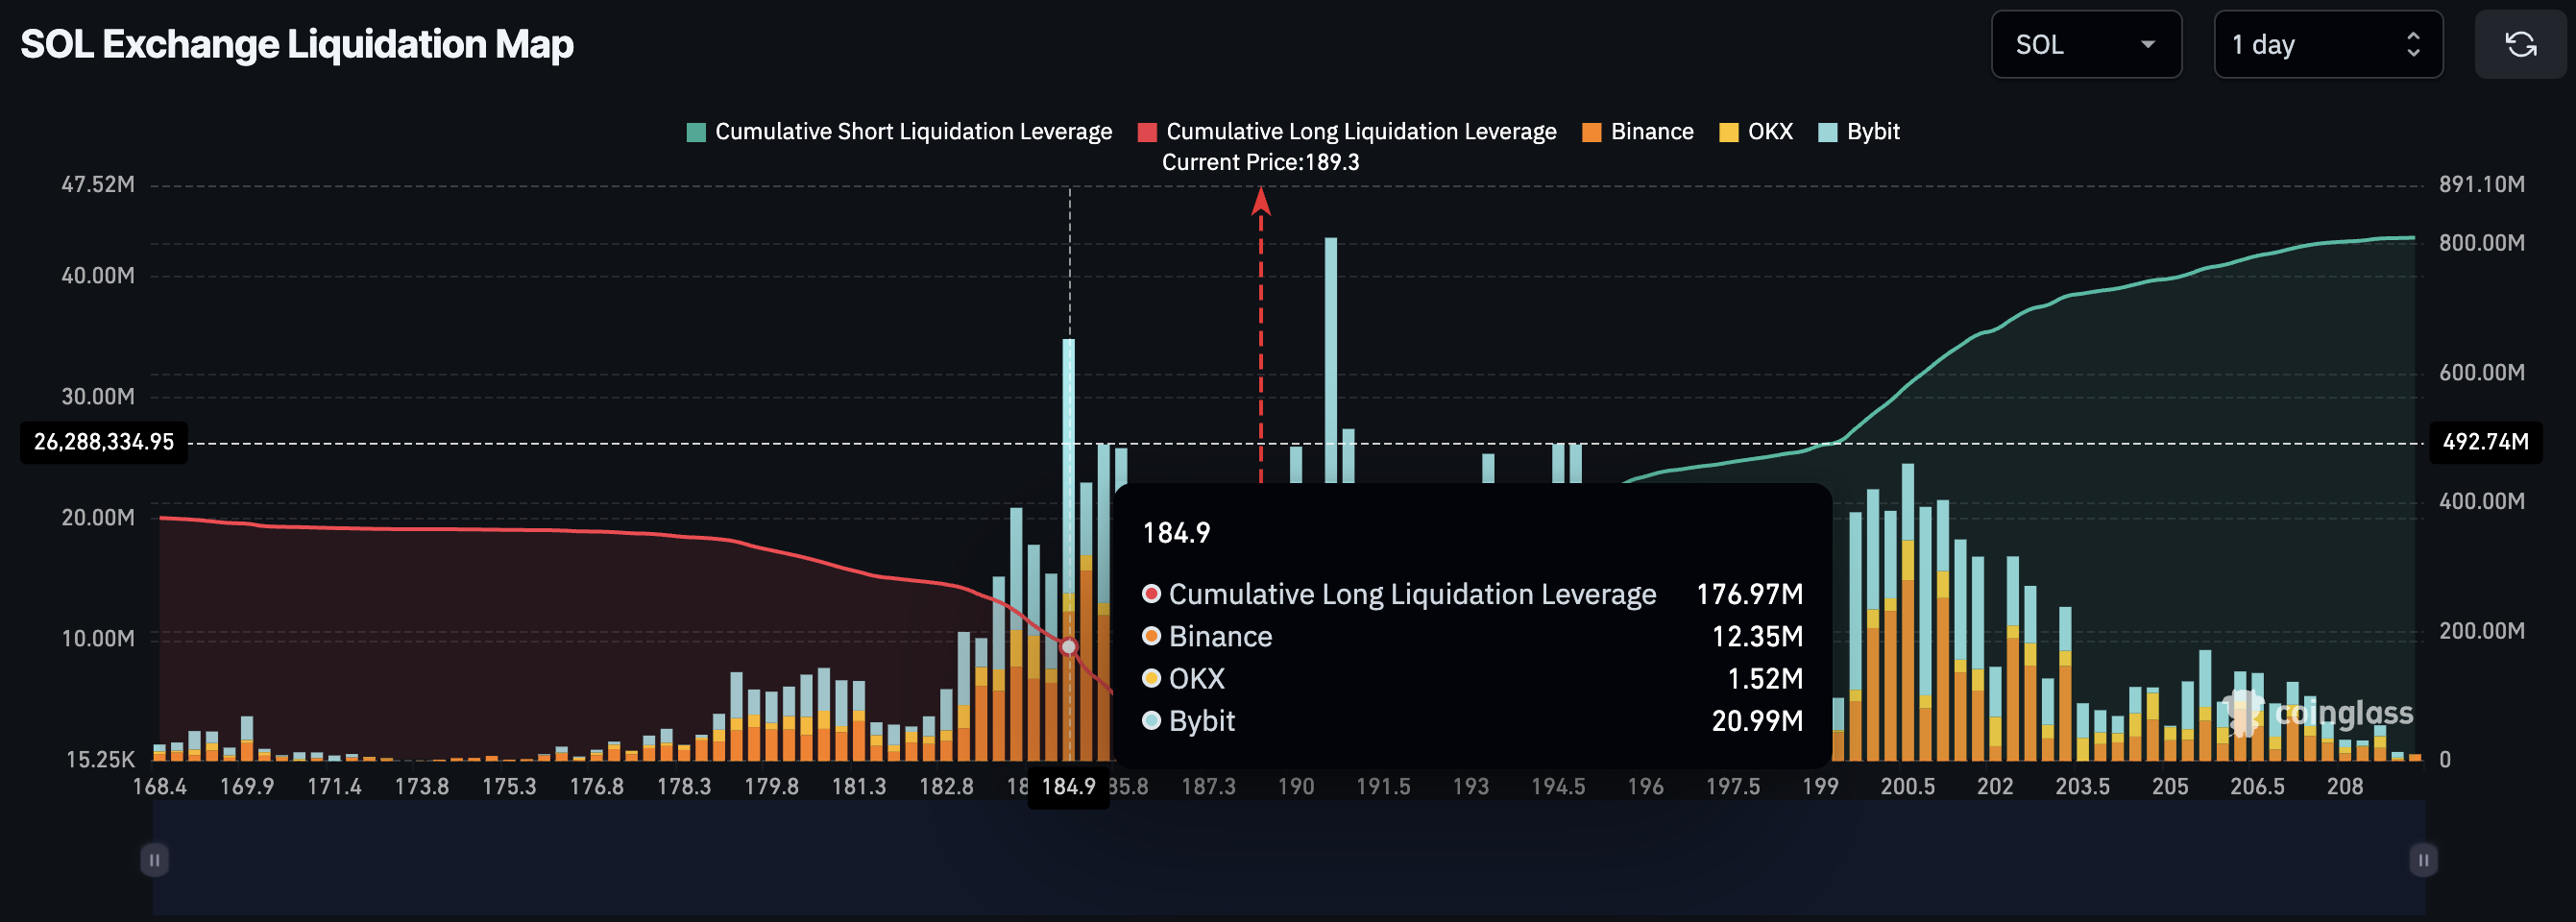
If SOL's decline drops below $185, the liquidation map projects the possibility of $176 million in cumulative long liquidation leverage. Looking up, a $102 million cumulative short liquidations leverage is at risk if SOL reclaims the $190 mark.
Solana risks testing the 50-day EMA
Solana is currently holding at $188 at the time of writing, presenting a Doji-shaped candle on the daily chart. The sixth-largest cryptocurrency by market capitalization, SOL, with a value of $102 billion, is currently on a path of least resistance towards the 50-day Exponential Moving Average (EMA) at $179.
The momentum indicators display mixed, neutral-to-bearish signals on the daily chart. The Moving Average Convergence Divergence (MACD) approaches its signal line, teasing a potential crossover that will flash a sell signal as the trend reversal shifts bearish. Still, the recent short-lived crossovers reflect the uncertainty in the SOL price trend.
The Relative Strength Index (RSI) reads 51 on the daily chart, approaching the halfway line, which represents neutrality in the momentum. However, a drop below this level WOULD indicate a sell-side dominance in the trading activity.
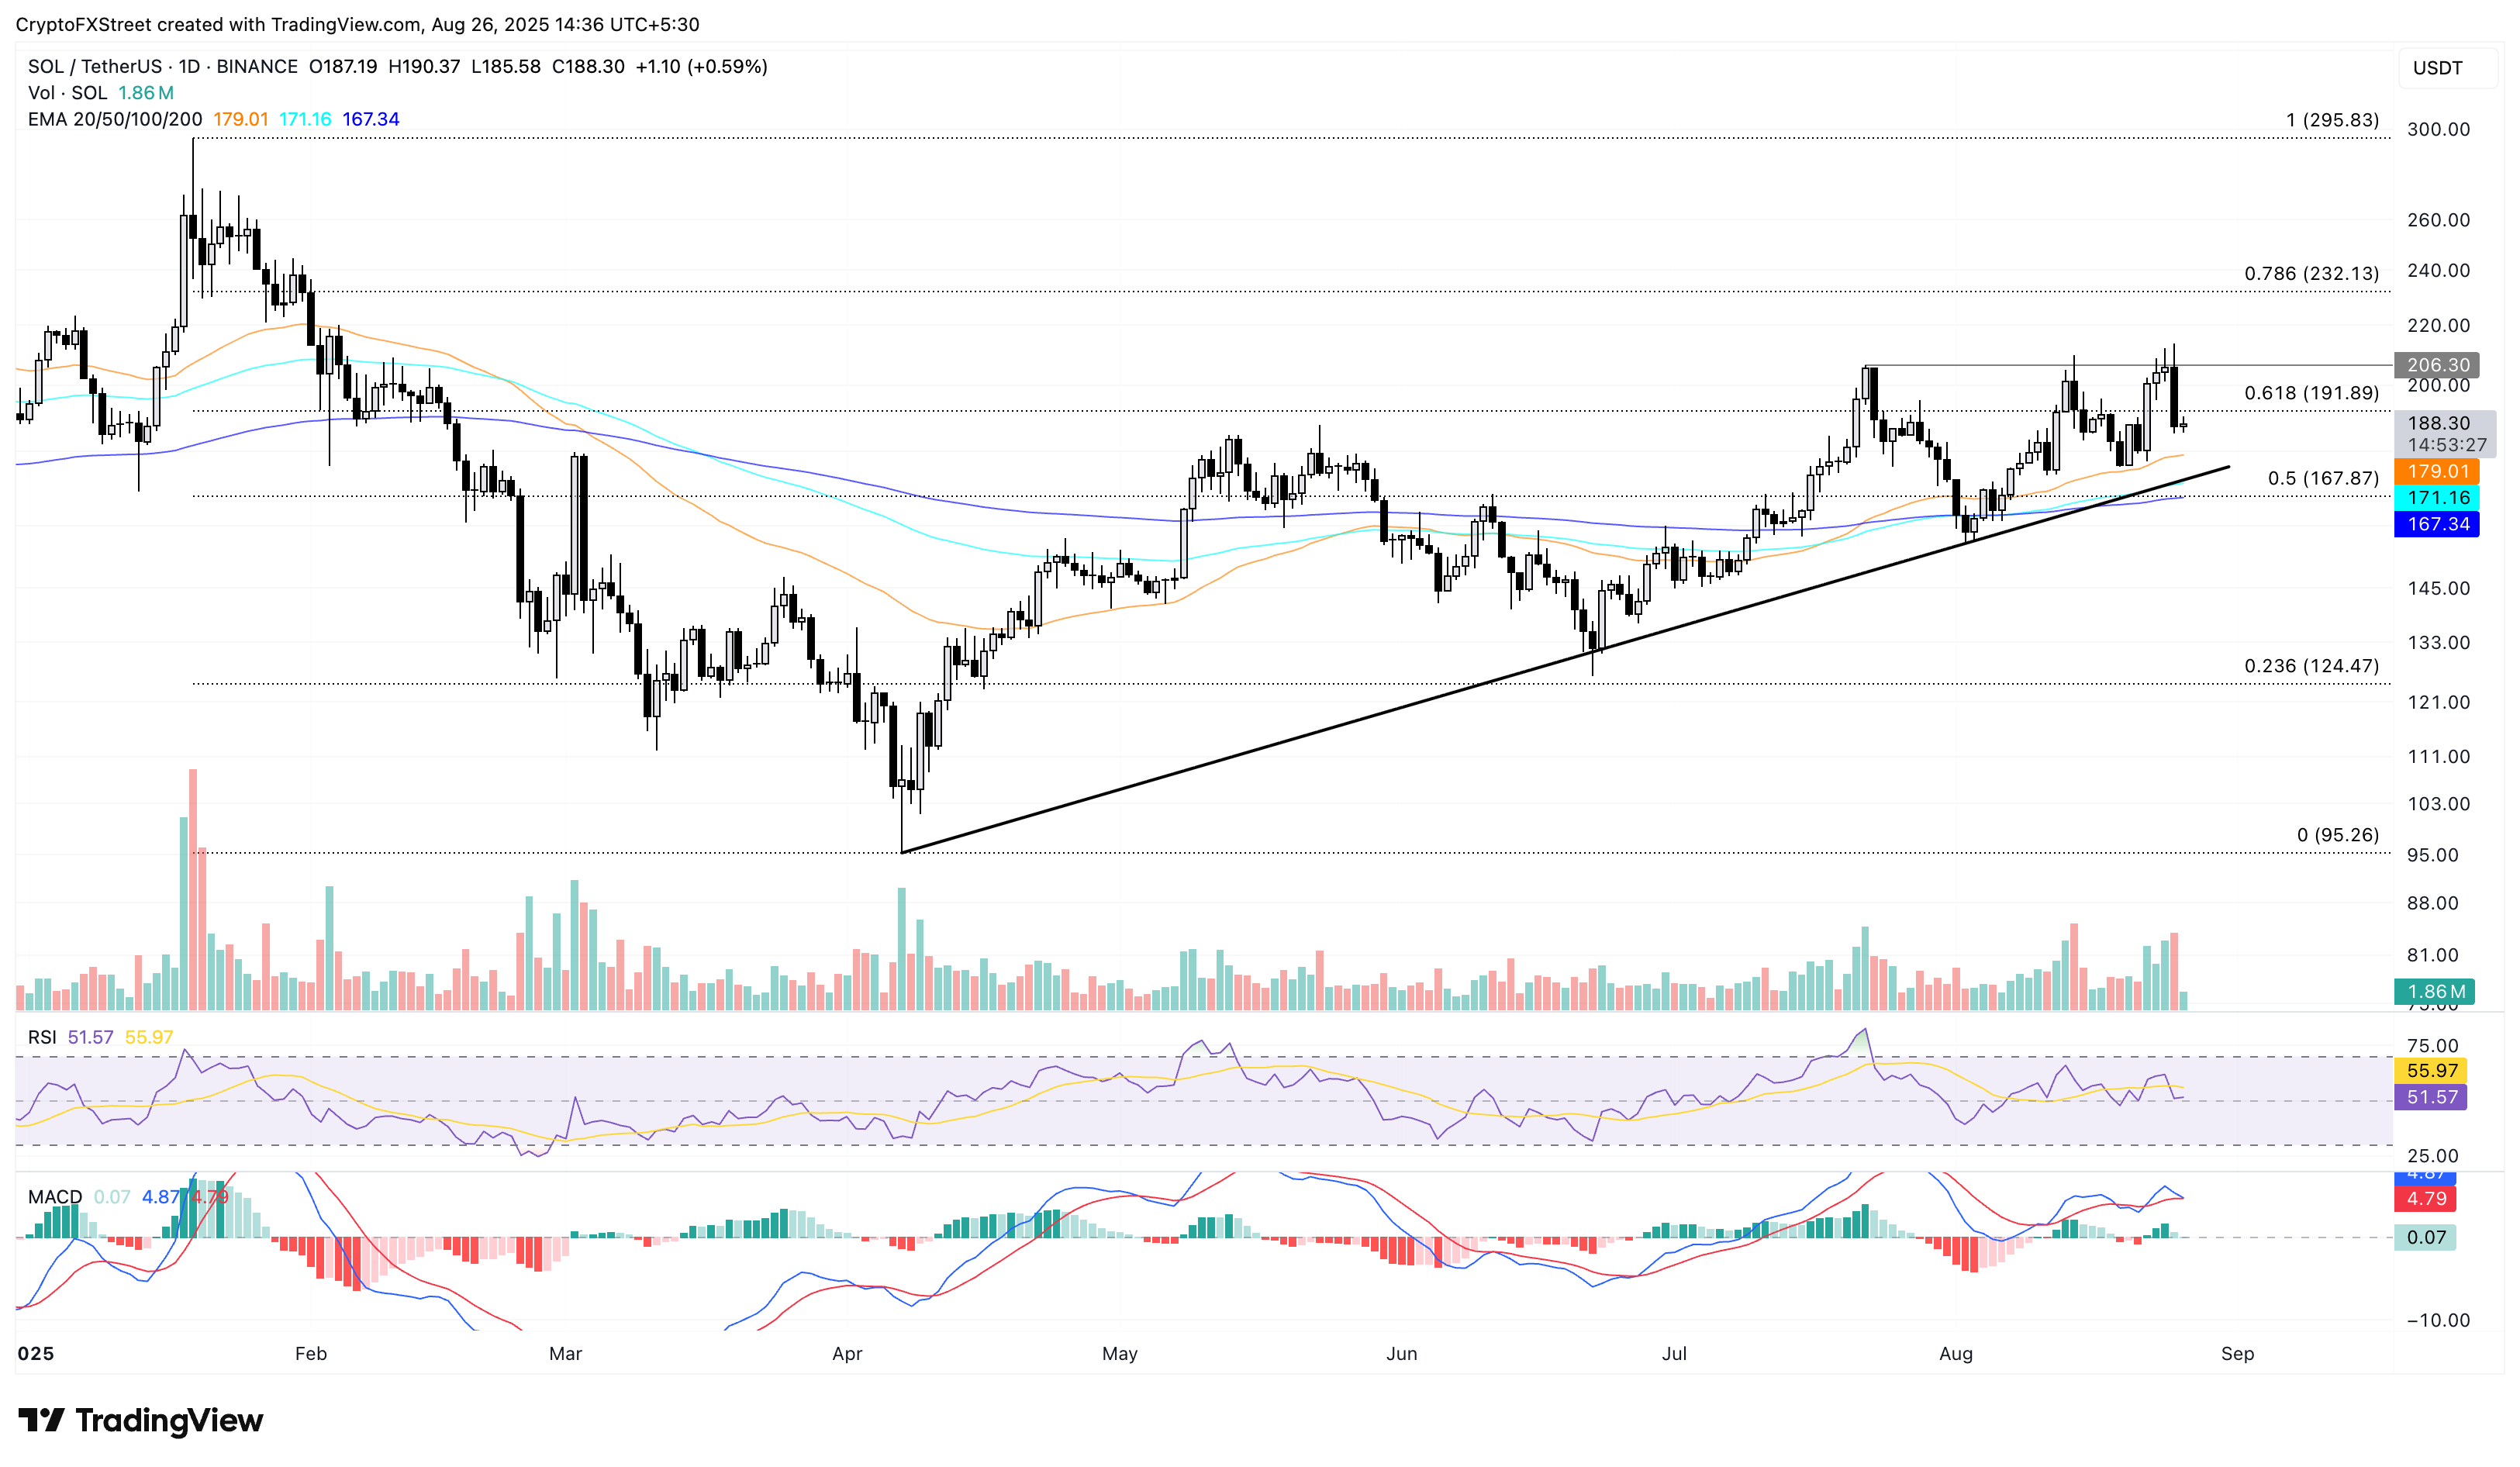
SOL/USDT daily price chart.
Looking up, Solana should surpass the July 22 high of $206 resistance level to target $232, aligning with the 78.6% Fibonacci retracement level drawn from the $295 high from January 19 to the $95 low from April 7.
