Crypto Carnage: $935M Liquidation Tsunami Hits Market as Fartcoin, OKB, and CRV Nosedive

Crypto markets just got steamrolled—massive liquidations trigger a domino effect across exchanges.
Blood in the Water
Traders watched in horror as leveraged positions got obliterated in minutes. Fartcoin’s infamous volatility struck again, while OKB and CRV led the decline with double-digit plunges. The result? A cool $935 million evaporated from accounts—mostly from overconfident longs.
Who’s Really Cashing In?
While retail gets rekt, market makers and short sellers pocket the difference. Classic crypto—the house always wins, especially when emotions override risk management. No surprise there—greed’s a hell of a drug, and the charts don’t lie.
Wake-Up Call or Just Tuesday?
This isn’t a blip—it’s a reminder. Crypto doesn’t sleep, and neither should your stop-losses. Stay sharp, or get liquidated. Your move.
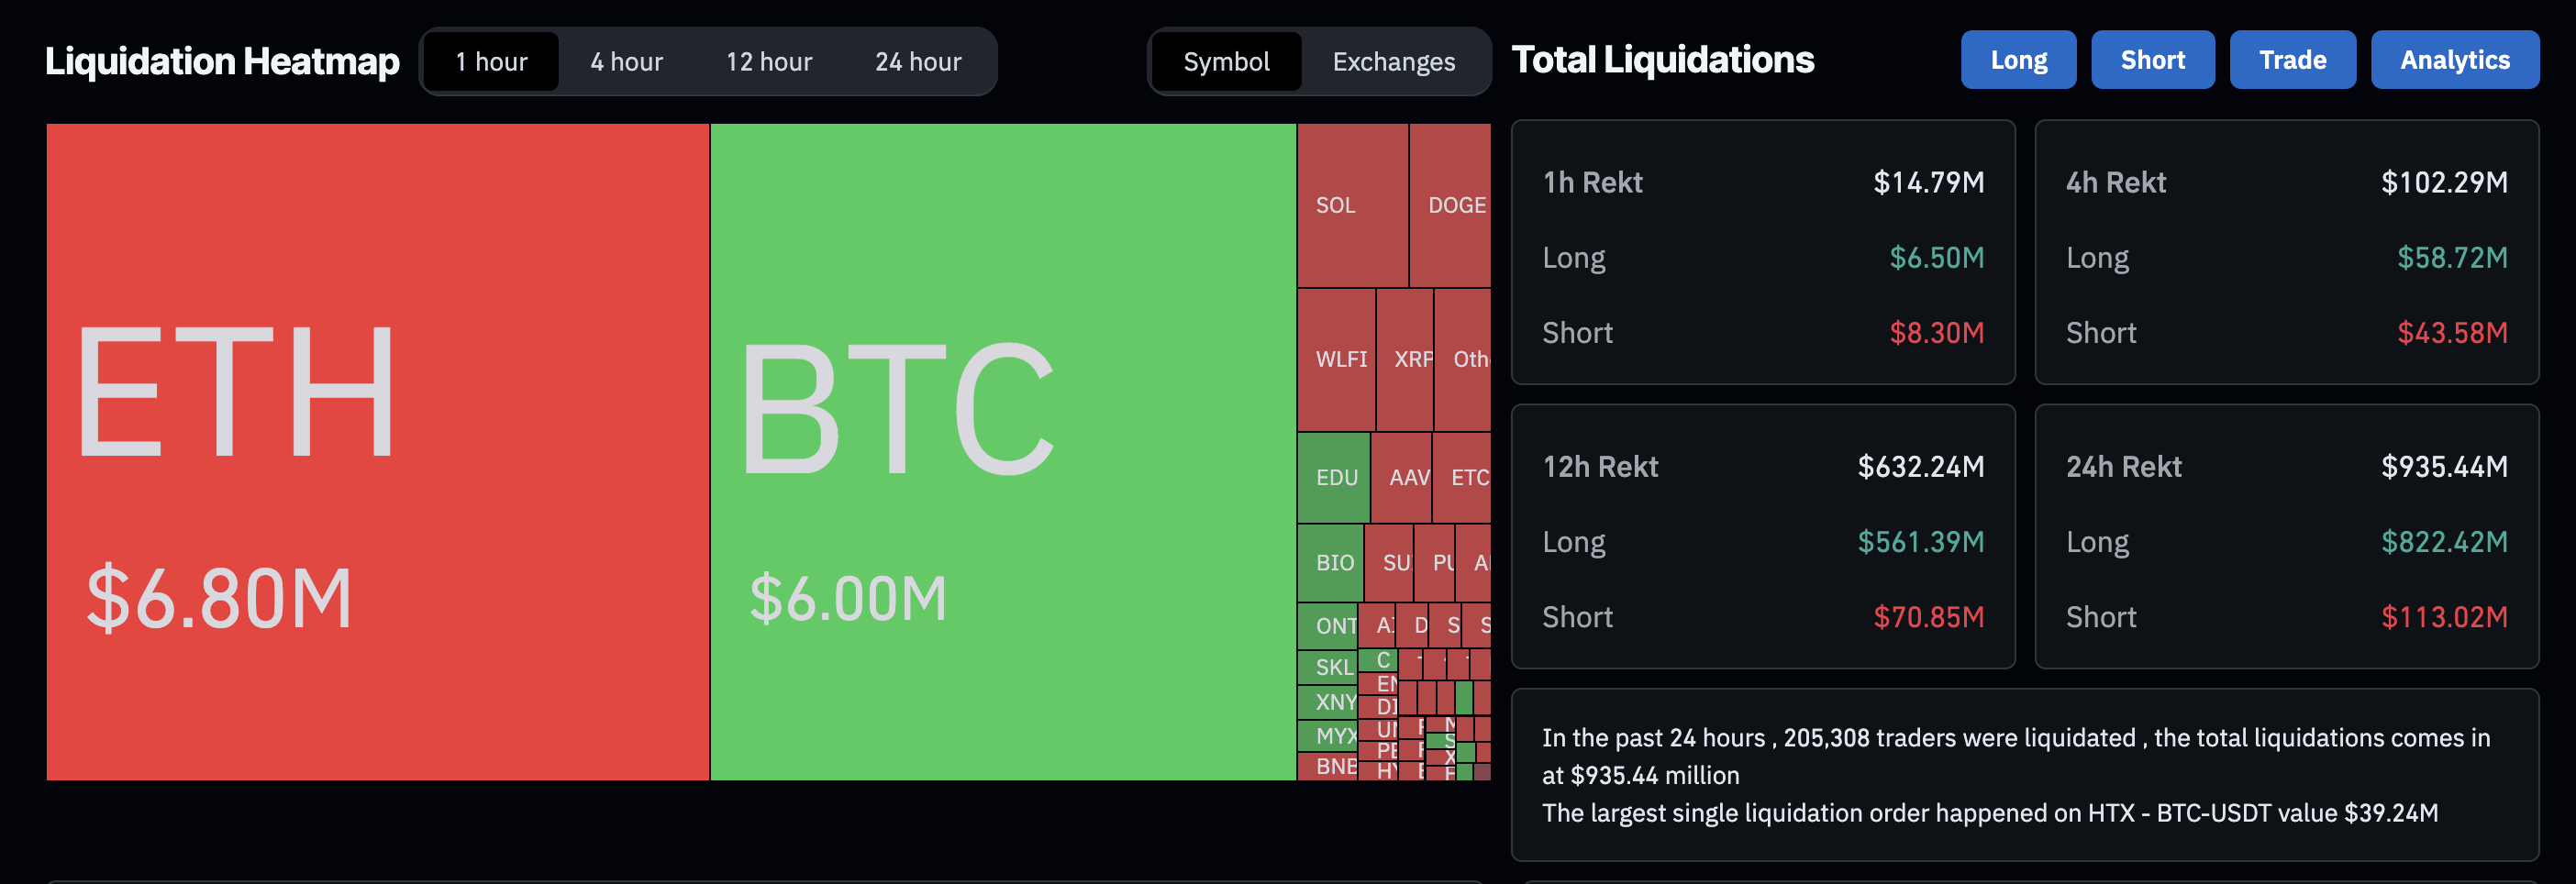
Total Liquidations. Source: Coinglass
Out of the $935.44 million liquidations, $822.42 million in long liquidations outpace the $113.02 million of short liquidations, indicating a larger bullish wipeout. Amid the wipeout, the crypto market Open Interest has declined by 6.98% to $202.42 billion, from $217.61 billion on Monday.
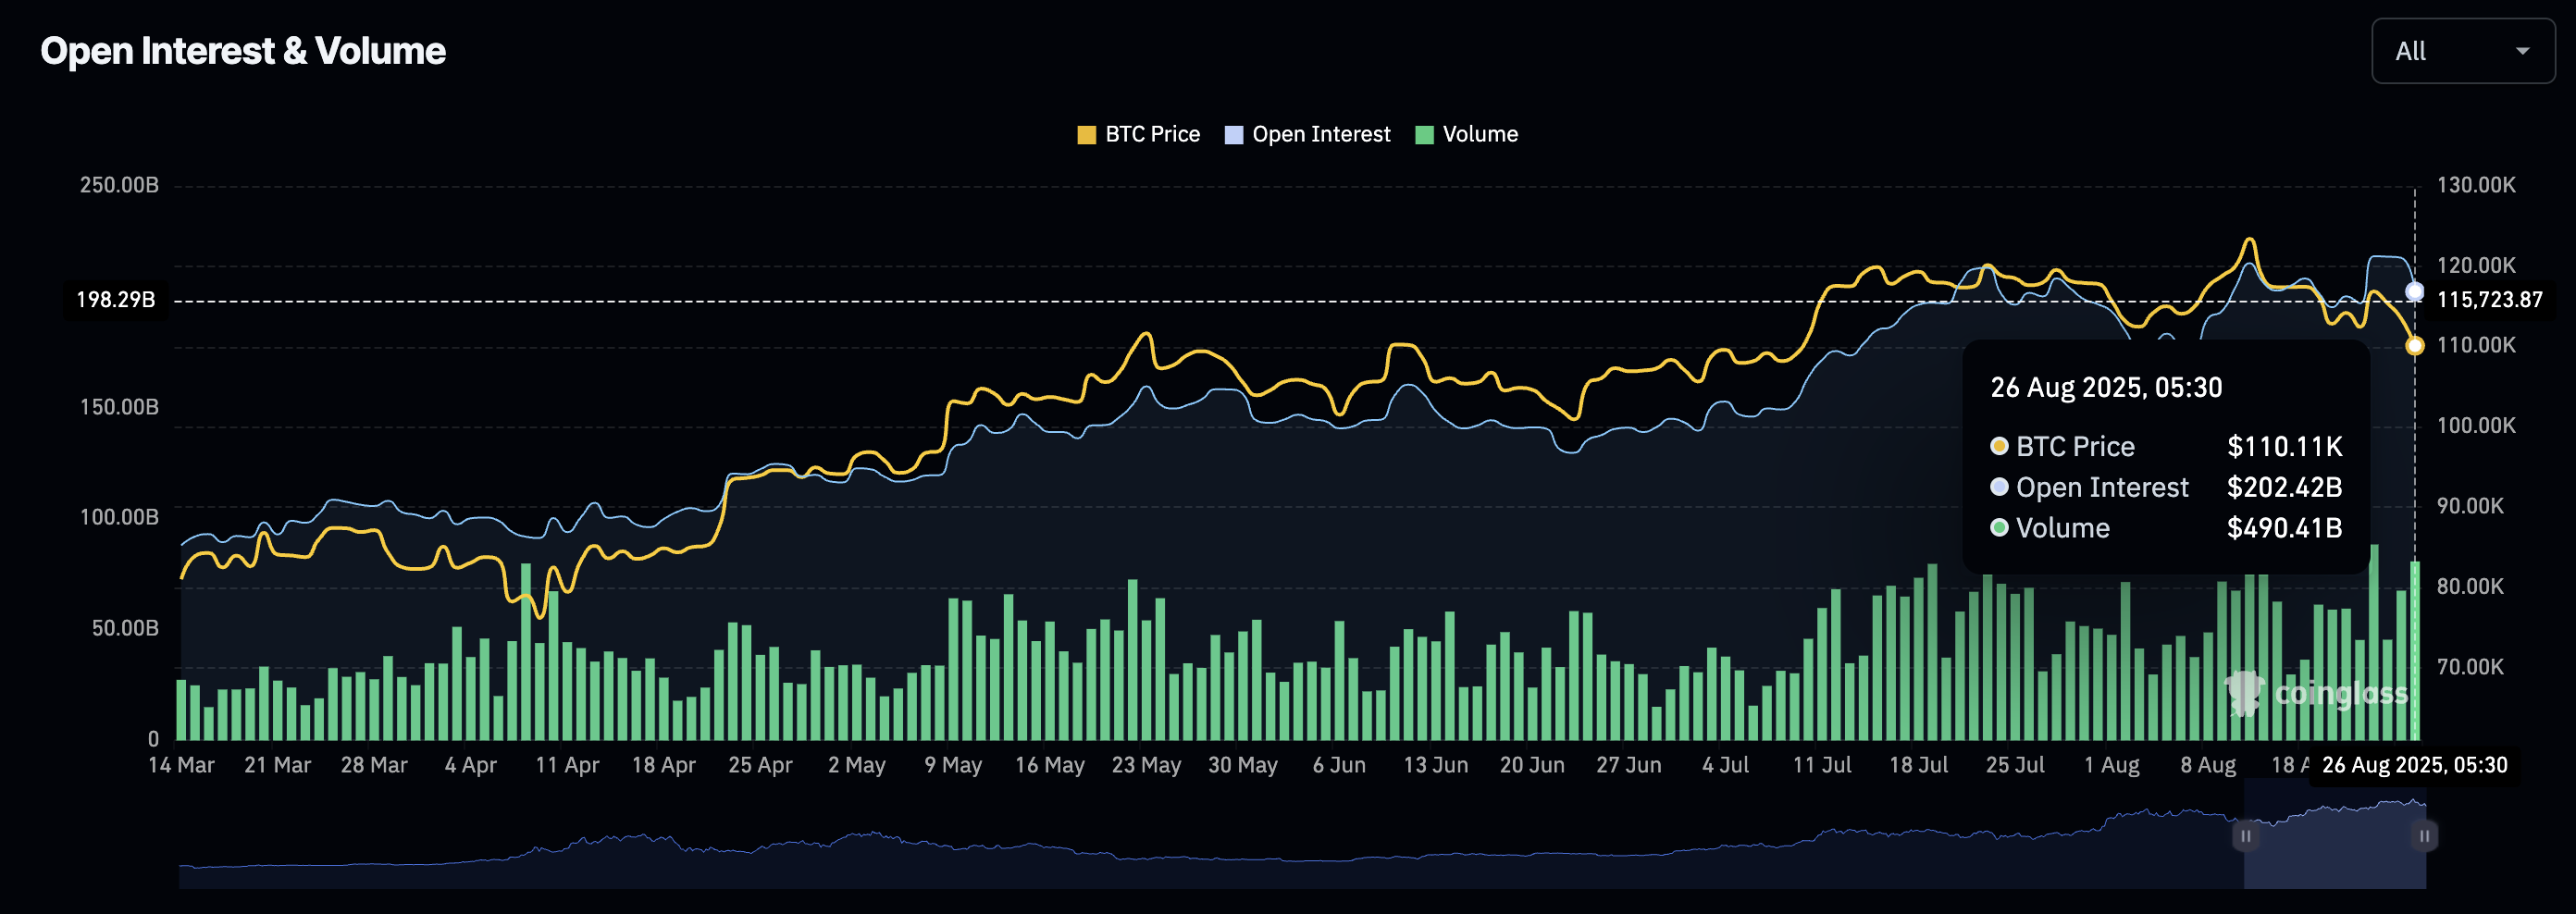
Open Interest. Source: Coinglass
The massive outflow from the broader crypto market highlights a shift in momentum ahead of September, which is a historically weaker month for Bitcoin.
Fartcoin’s declines reaches a crucial support level
Fartcoin trades at $0.7856 at press time on Monday, holding above the 50% retracement level at $0.7378, which is drawn between $2.74 on January 19 and $0.1986 on March 10. The 16.85% reversal from the 200-day Exponential Moving Average (EMA) on Monday puts this 50% retracement support at risk.
If Fartcoin extends the downtrend, a decisive close below this support could test the $0.5730 support, which previously acted as a resistance on April 8.
The Relative Strength Index (RSI) reads 38 on the daily chart, slipping below the halfway line, which indicates a lowered buying pressure. If the RSI slips to the oversold region, FARTCOIN could drop below the crucial support threshold.
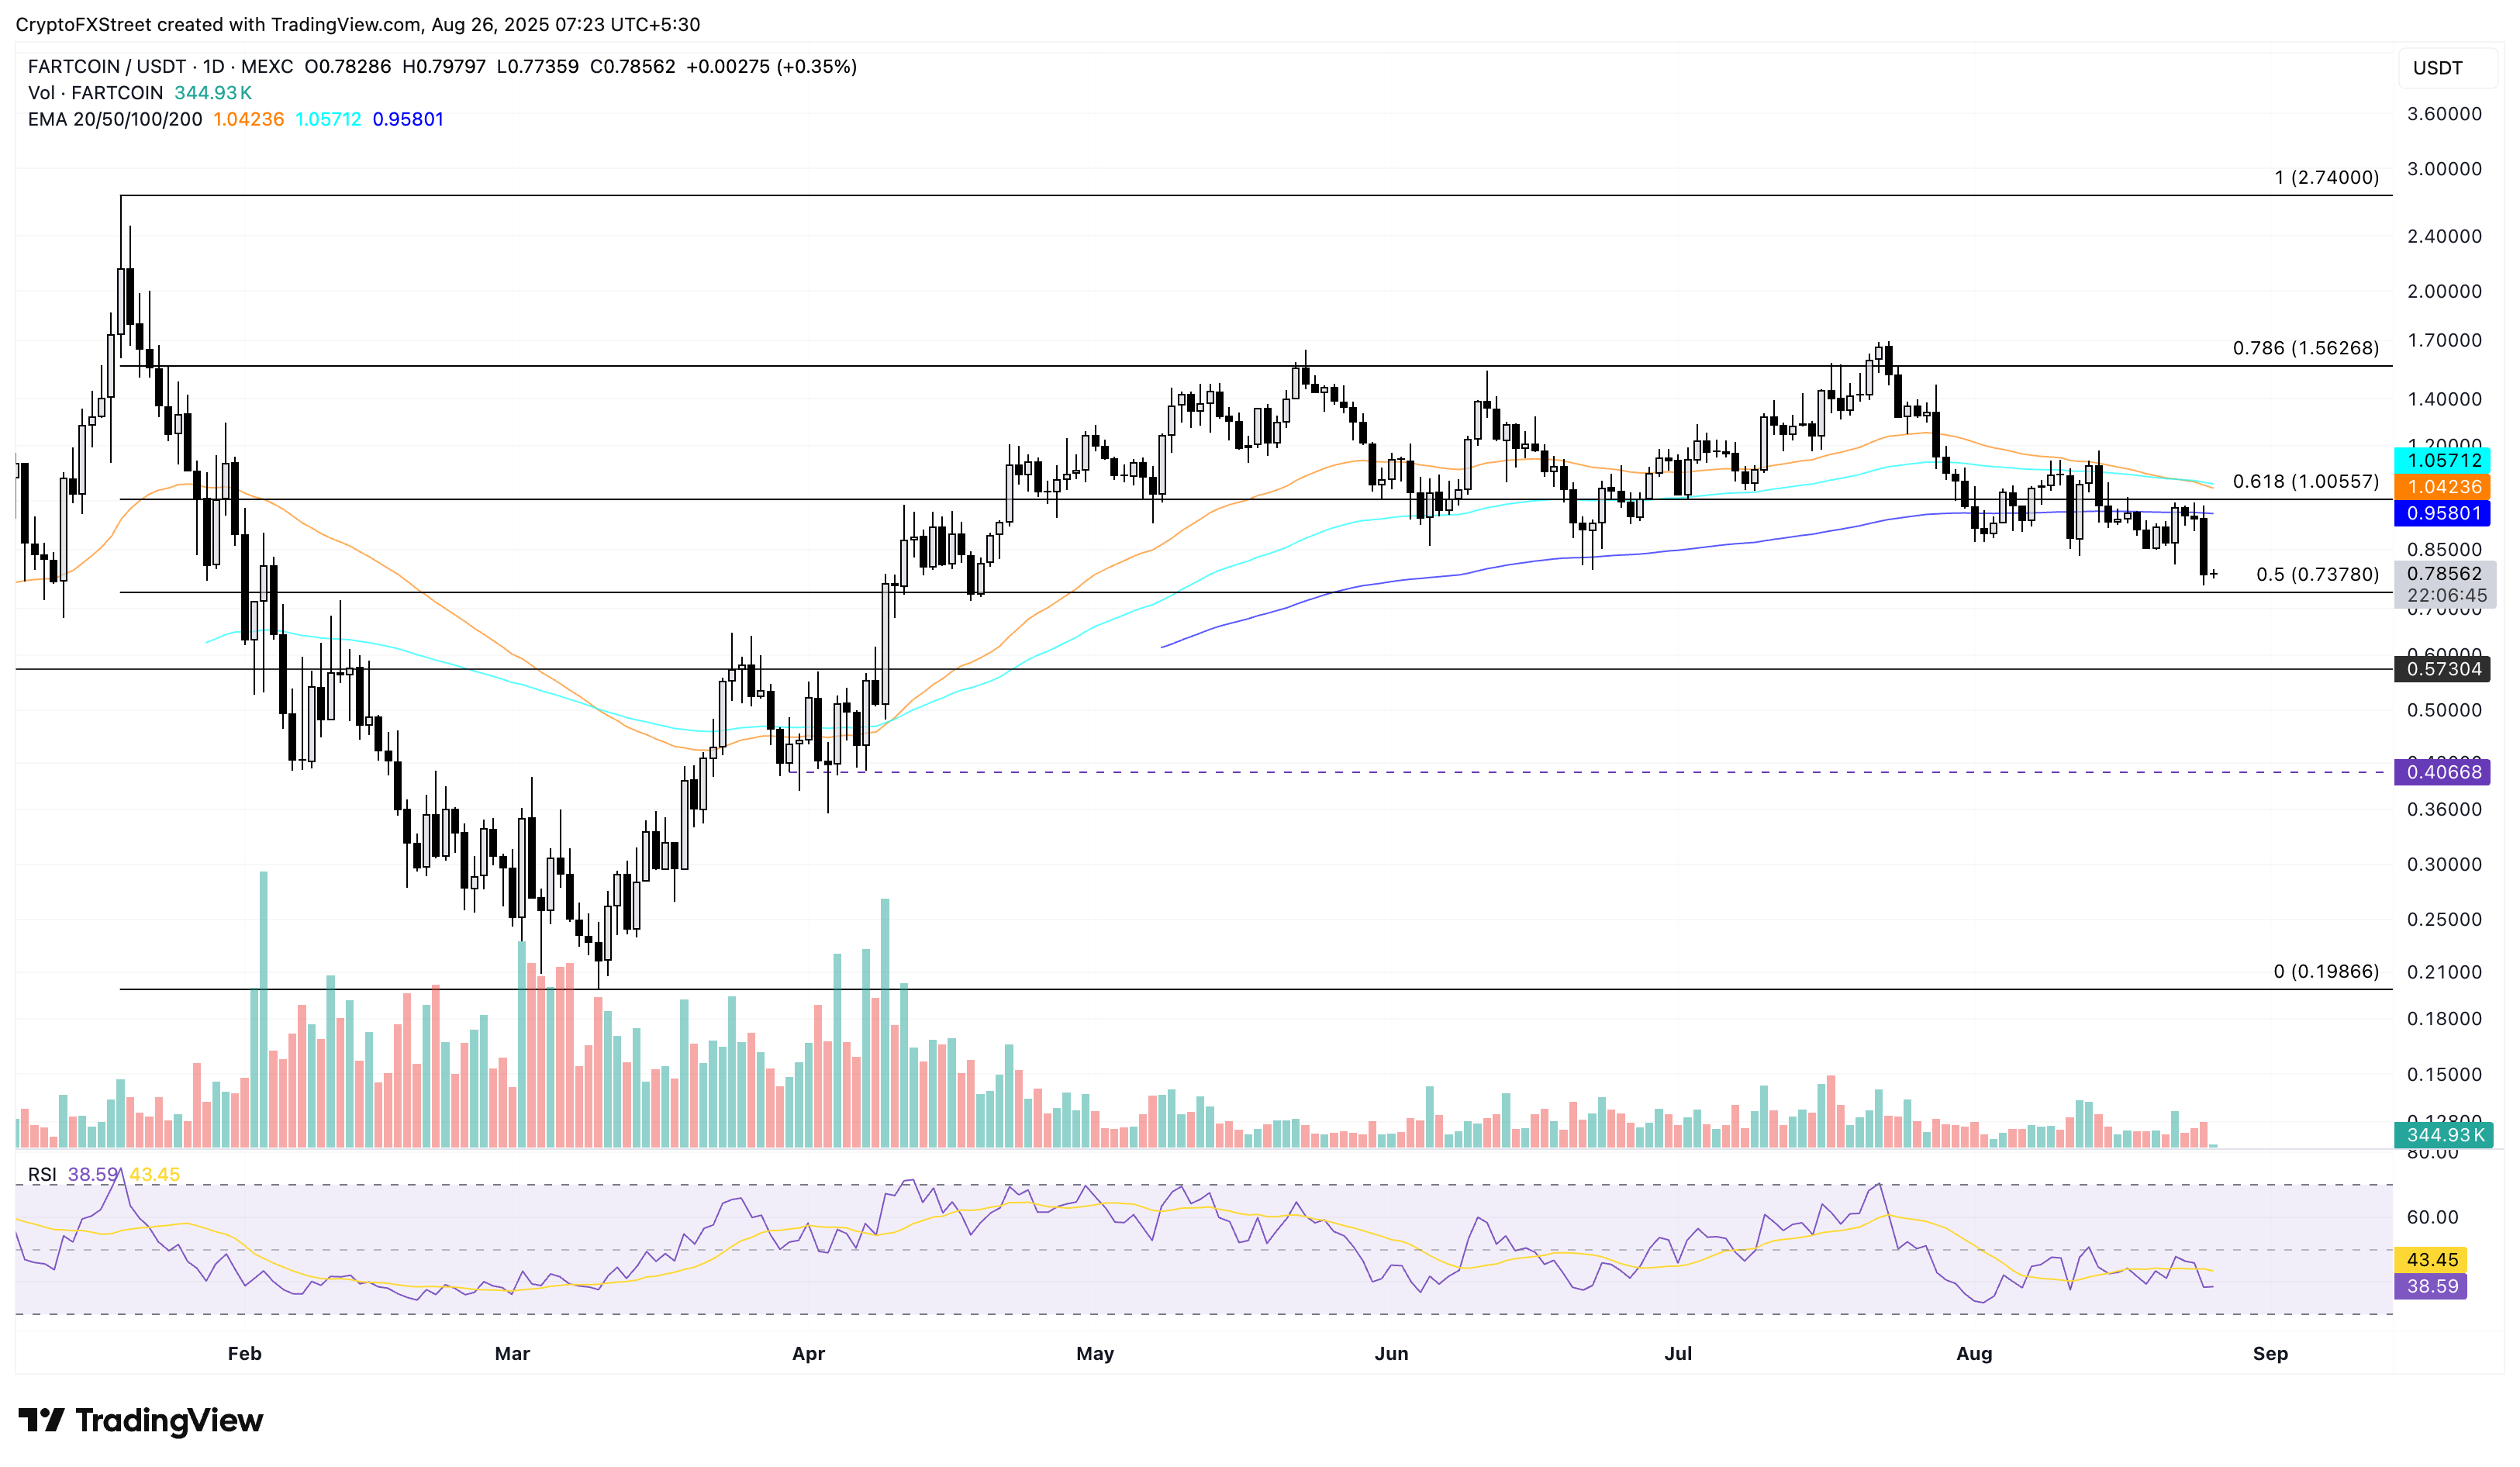
FARTCOIN/USDT daily price chart.
On the contrary, a potential reversal from the $0.7378 level, similar to the April 19 reversal, could result in a bounce back to the $1.0000 psychological level.
OKB could take a bearish exit out of a falling wedge pattern
The brilliant performance of OKB last week, driven by the 65 million token burn, takes a hit as the broader crypto market corrects. At the time of writing, OKB trades at $171 NEAR the 50-period EMA, which aligns with the falling wedge pattern’s lower support trendline on the daily chart (shared below).
If OKB drops below this support trendline near $165, a decisive close will signal the breakdown of the pattern. This could extend the downtrend to the $142 support, marked by the August 13 high.
The RSI on the same chart has dropped to 39, which indicates a bearish shift in trend. Additionally, the Moving Average Convergence Divergence (MACD) crosses below the zero line with its signal line mirroring the fall, which suggests a rise in bearish trend momentum.
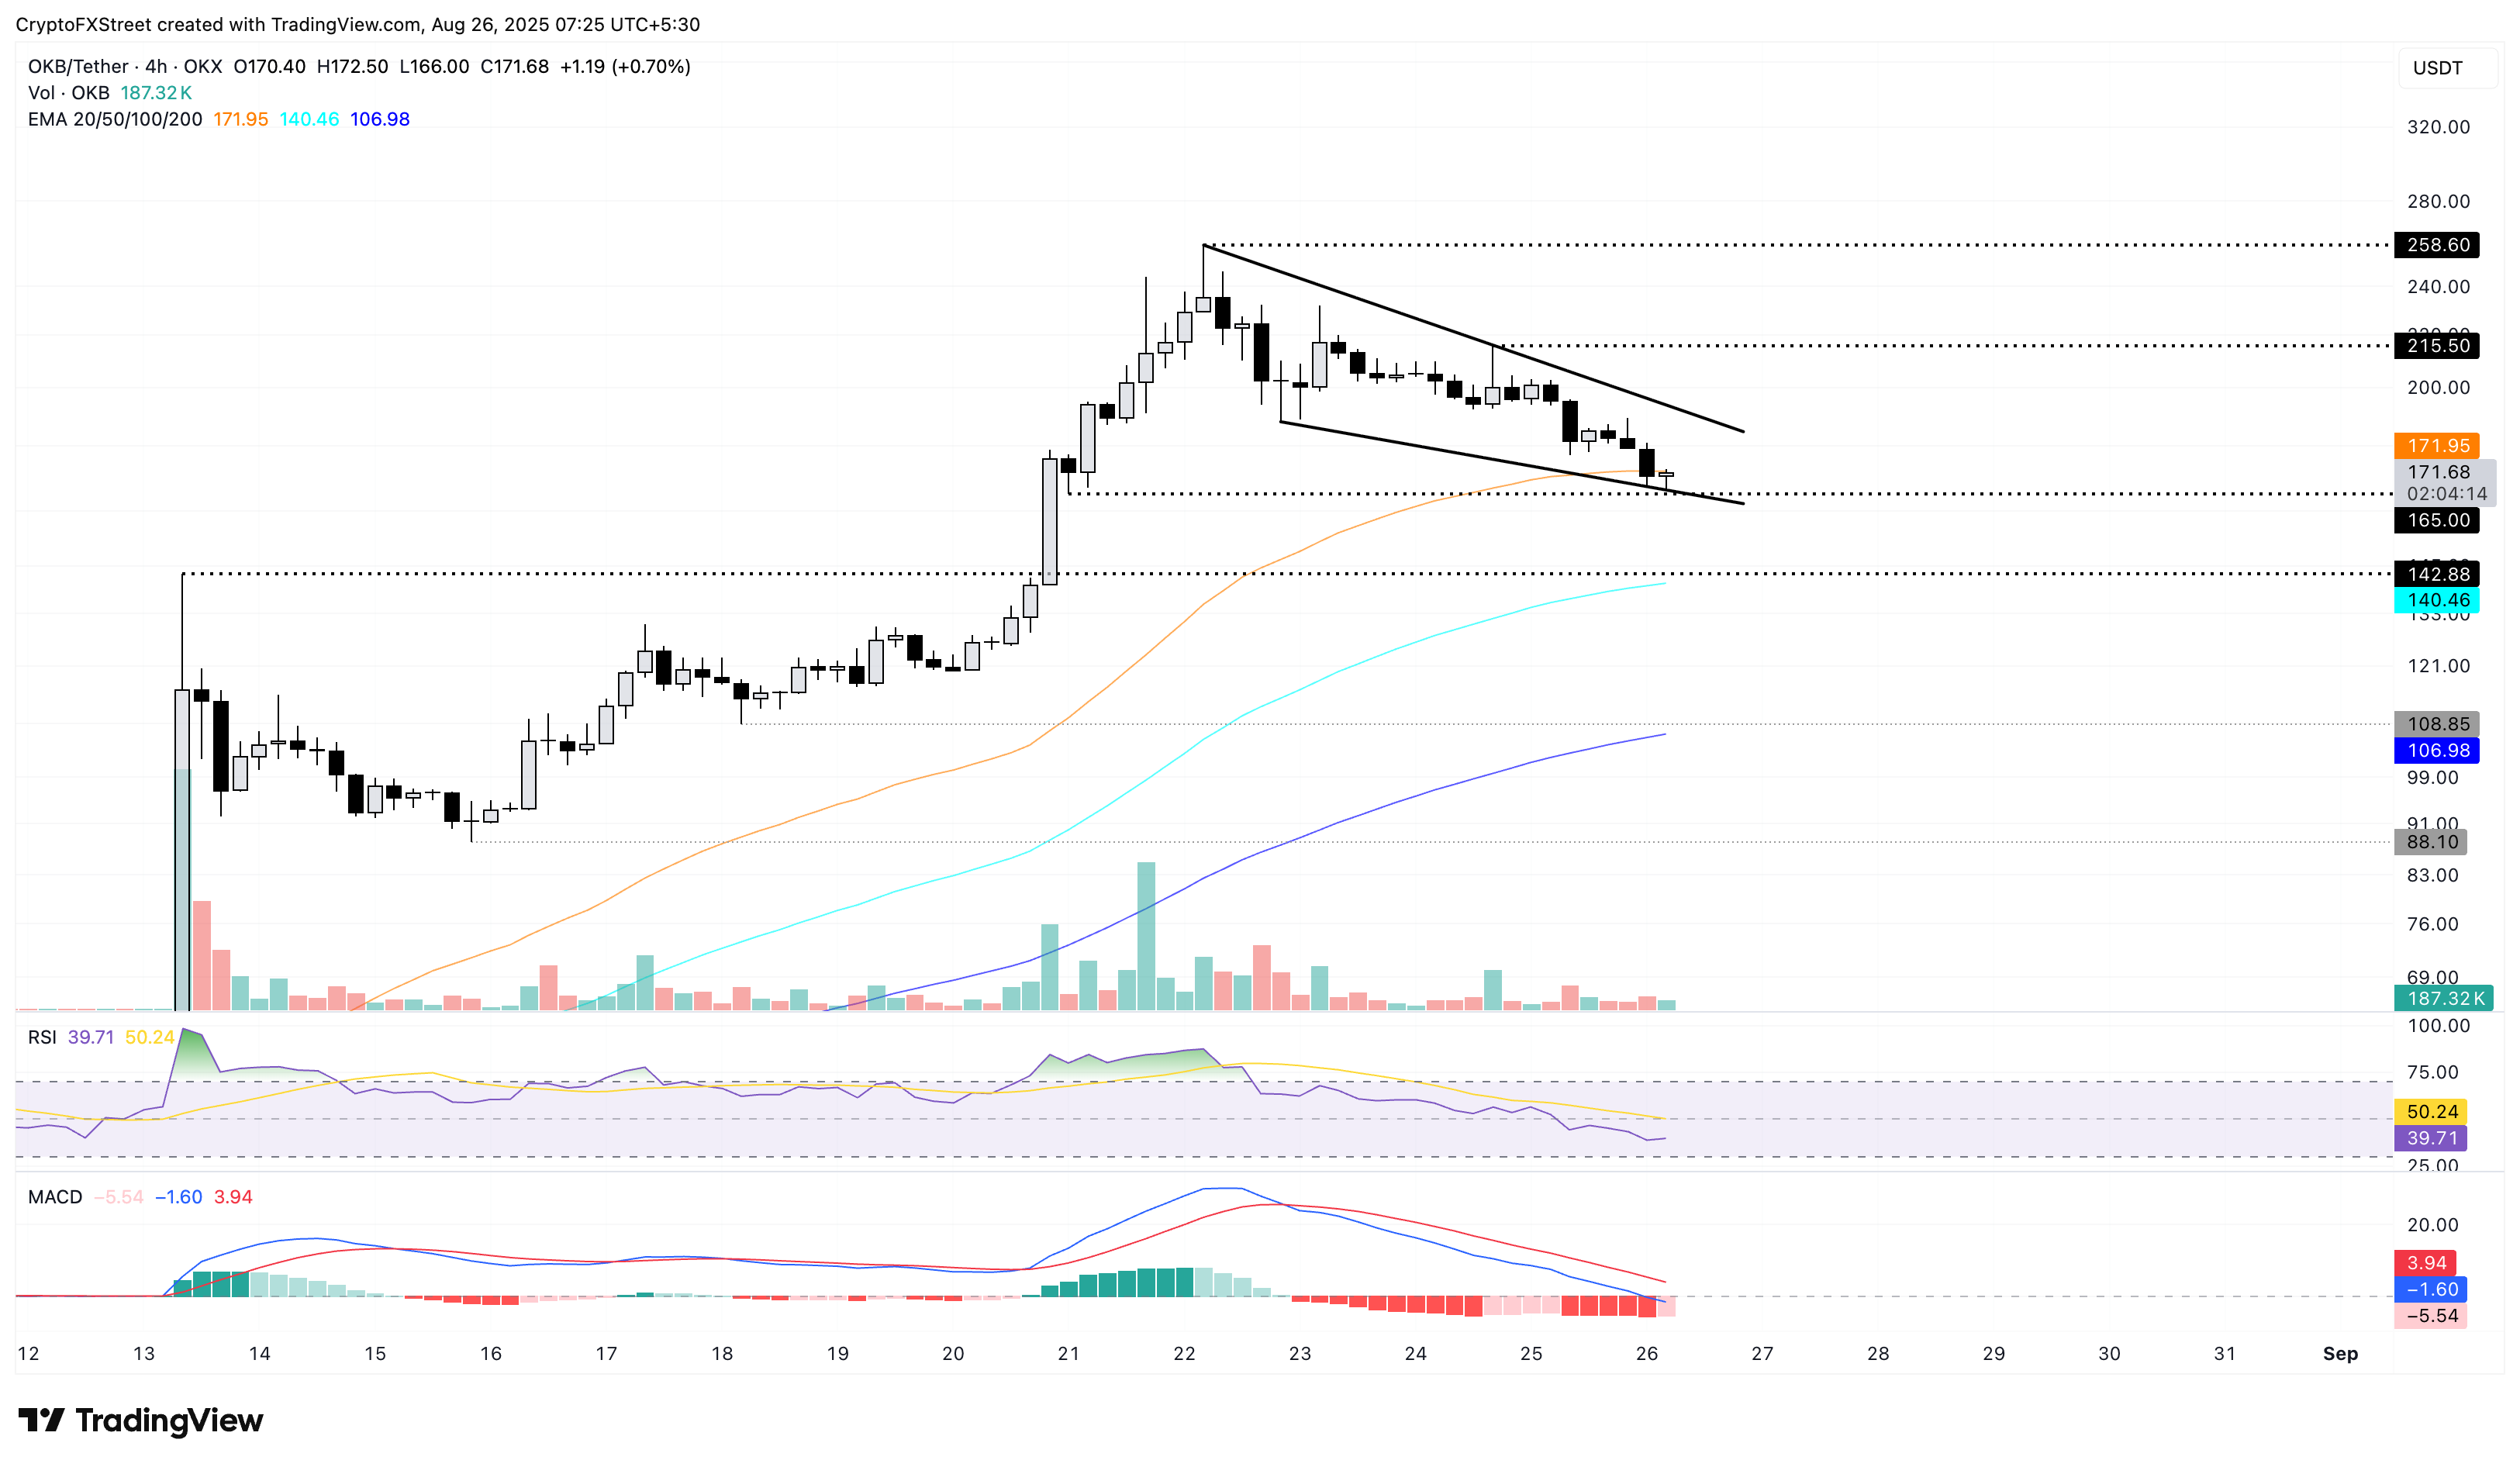
OKB/USDT daily price chart.
Looking up, if OKB bounces off the dynamic support of the 50-period EMA, it could test the upper ceiling at $195.
Curve DAO risks a falling channel pattern breakdown
Similar to OKB, CRV tests the lower boundary of a falling channel pattern formed on the daily chart (shared below). CRV trades at $0.7833 at press time near the 100-day EMA after breaching the 61.8% Fibonacci level at $0.7986, which is retraced between $1.3368 from December 7 and $0.3470 from March 11.
If CRV marks a daily close below the support trendline at $0.7626, it could extend the fall to the 50% retracement level at $0.6811.
The momentum indicators on the daily chart suggest a bearish tilt. The MACD and its signal line cross below the zero line, indicating a rise in bearish momentum, while the RSI, at 40, drops below the halfway line, suggesting room for further correction.
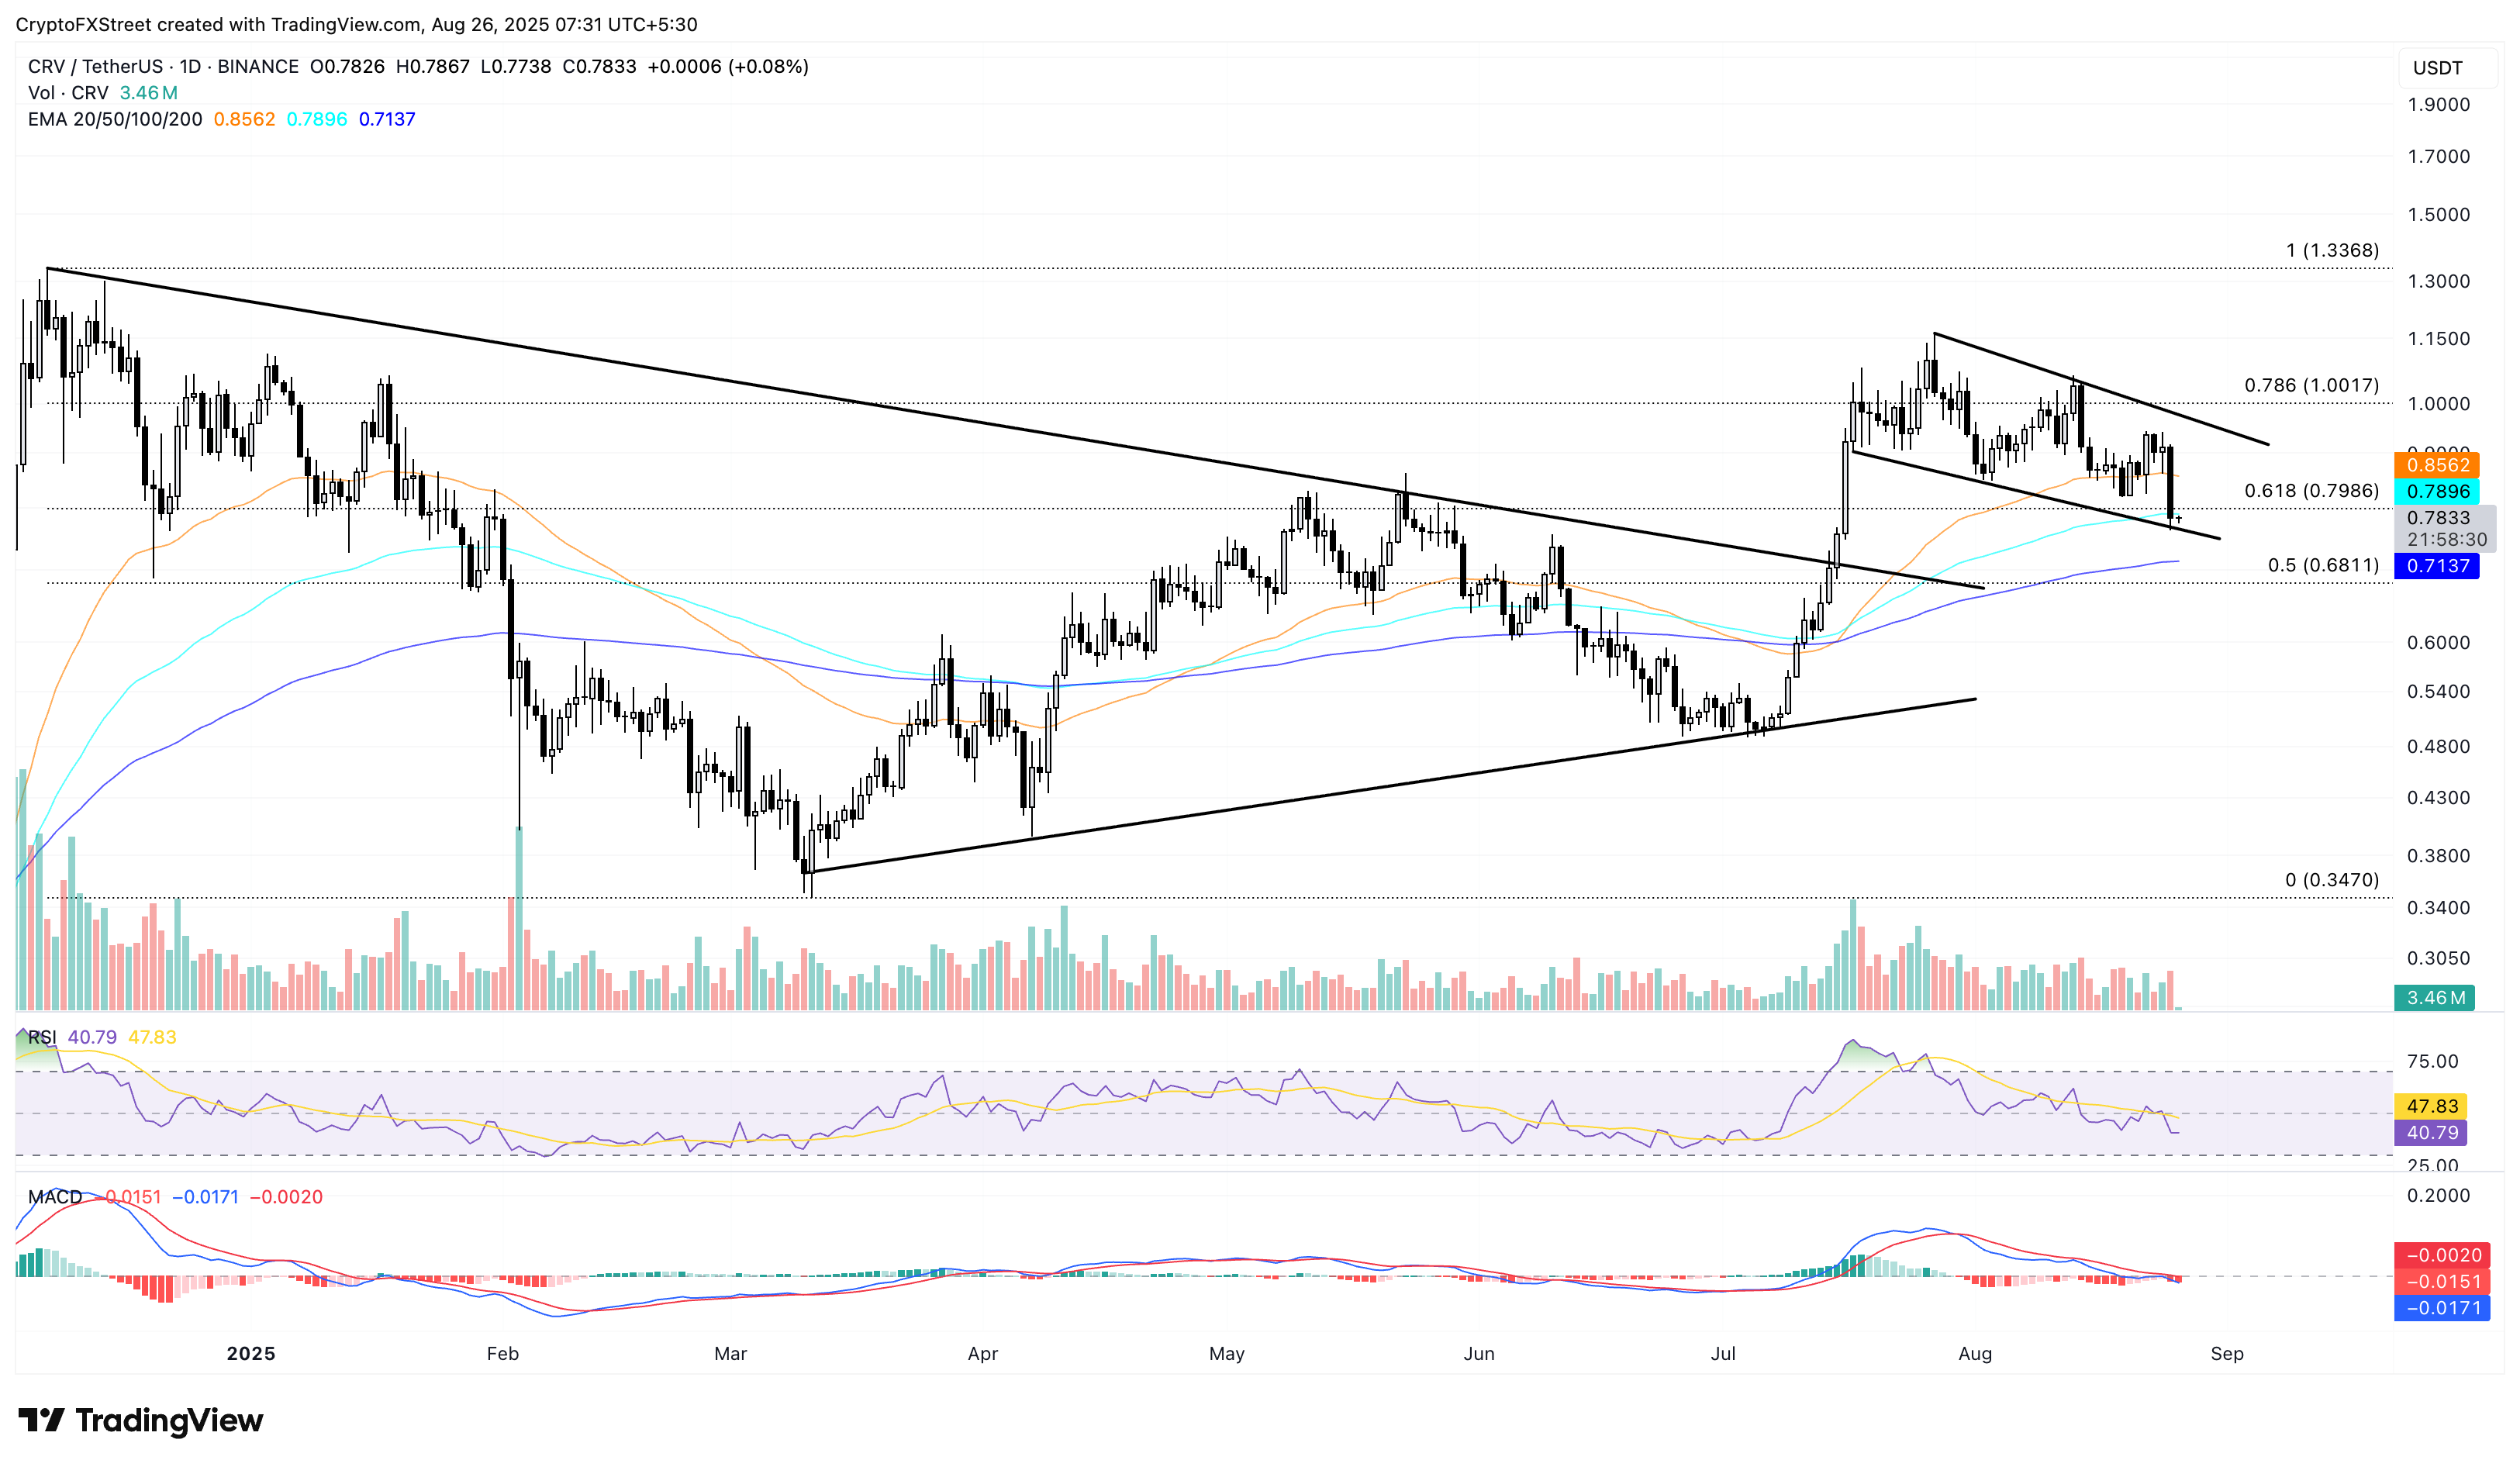
CRV/USDT daily price chart.
On the flip side, a bounce back within the falling channel pattern could test the upper trendline at $0.9650.
