Crypto Alert: Bitcoin, Ethereum, XRP Supply Profit Plunge Before Powell’s Fed Speech

Digital assets brace for impact as profitability drains from major cryptocurrencies.
SUPPLY PROFITABILITY CRASHES
Bitcoin, Ethereum, and XRP all show declining percentages of supply in profit—just as Federal Reserve Chair Jerome Powell prepares to address monetary policy. Traders sweat over potential hawkish signals that could further pressure crypto valuations.
FED WATCH MODE ACTIVATED
Market participants eye Powell's every word for clues on interest rates. Crypto's sensitivity to macro conditions means even subtle shifts in tone can trigger volatility. Traditional finance types smugly note 'we told you so' about crypto's dependence on cheap money.
PROFIT-TAKING OR PANIC SELLING?
The drop in profitable supply suggests either smart money cashing out or nervous holders cutting losses. Neither scenario paints a bullish short-term picture. Meanwhile, blockchain metrics flash warning signs as network activity slows.
CRYPTO'S REALITY CHECK
Powell's speech could deliver the cold shower crypto needs—or the liquidity injection it craves. Either way, the market's leaning defensive. Because nothing says 'store of value' like sweating over a central banker's dinner menu choices.
The supply in profit drops, signaling lowered confidence
The percentage of the total amount of coins held by investors in profit is a crucial on-chain trend indicator. An increase in percentage points WOULD mark an uptrend in motion, signaling increased confidence among investors and vice versa.
Santiment data shows that the percentage of BTC and XRP supply in profit has declined to 92.138% and 91.74%, respectively, from 100% (at Bitcoin’s all-time high) and 98.2% (XRP's monthly high) on August 8. This indicates a steep decline in investors’ conviction towards an uptrend.
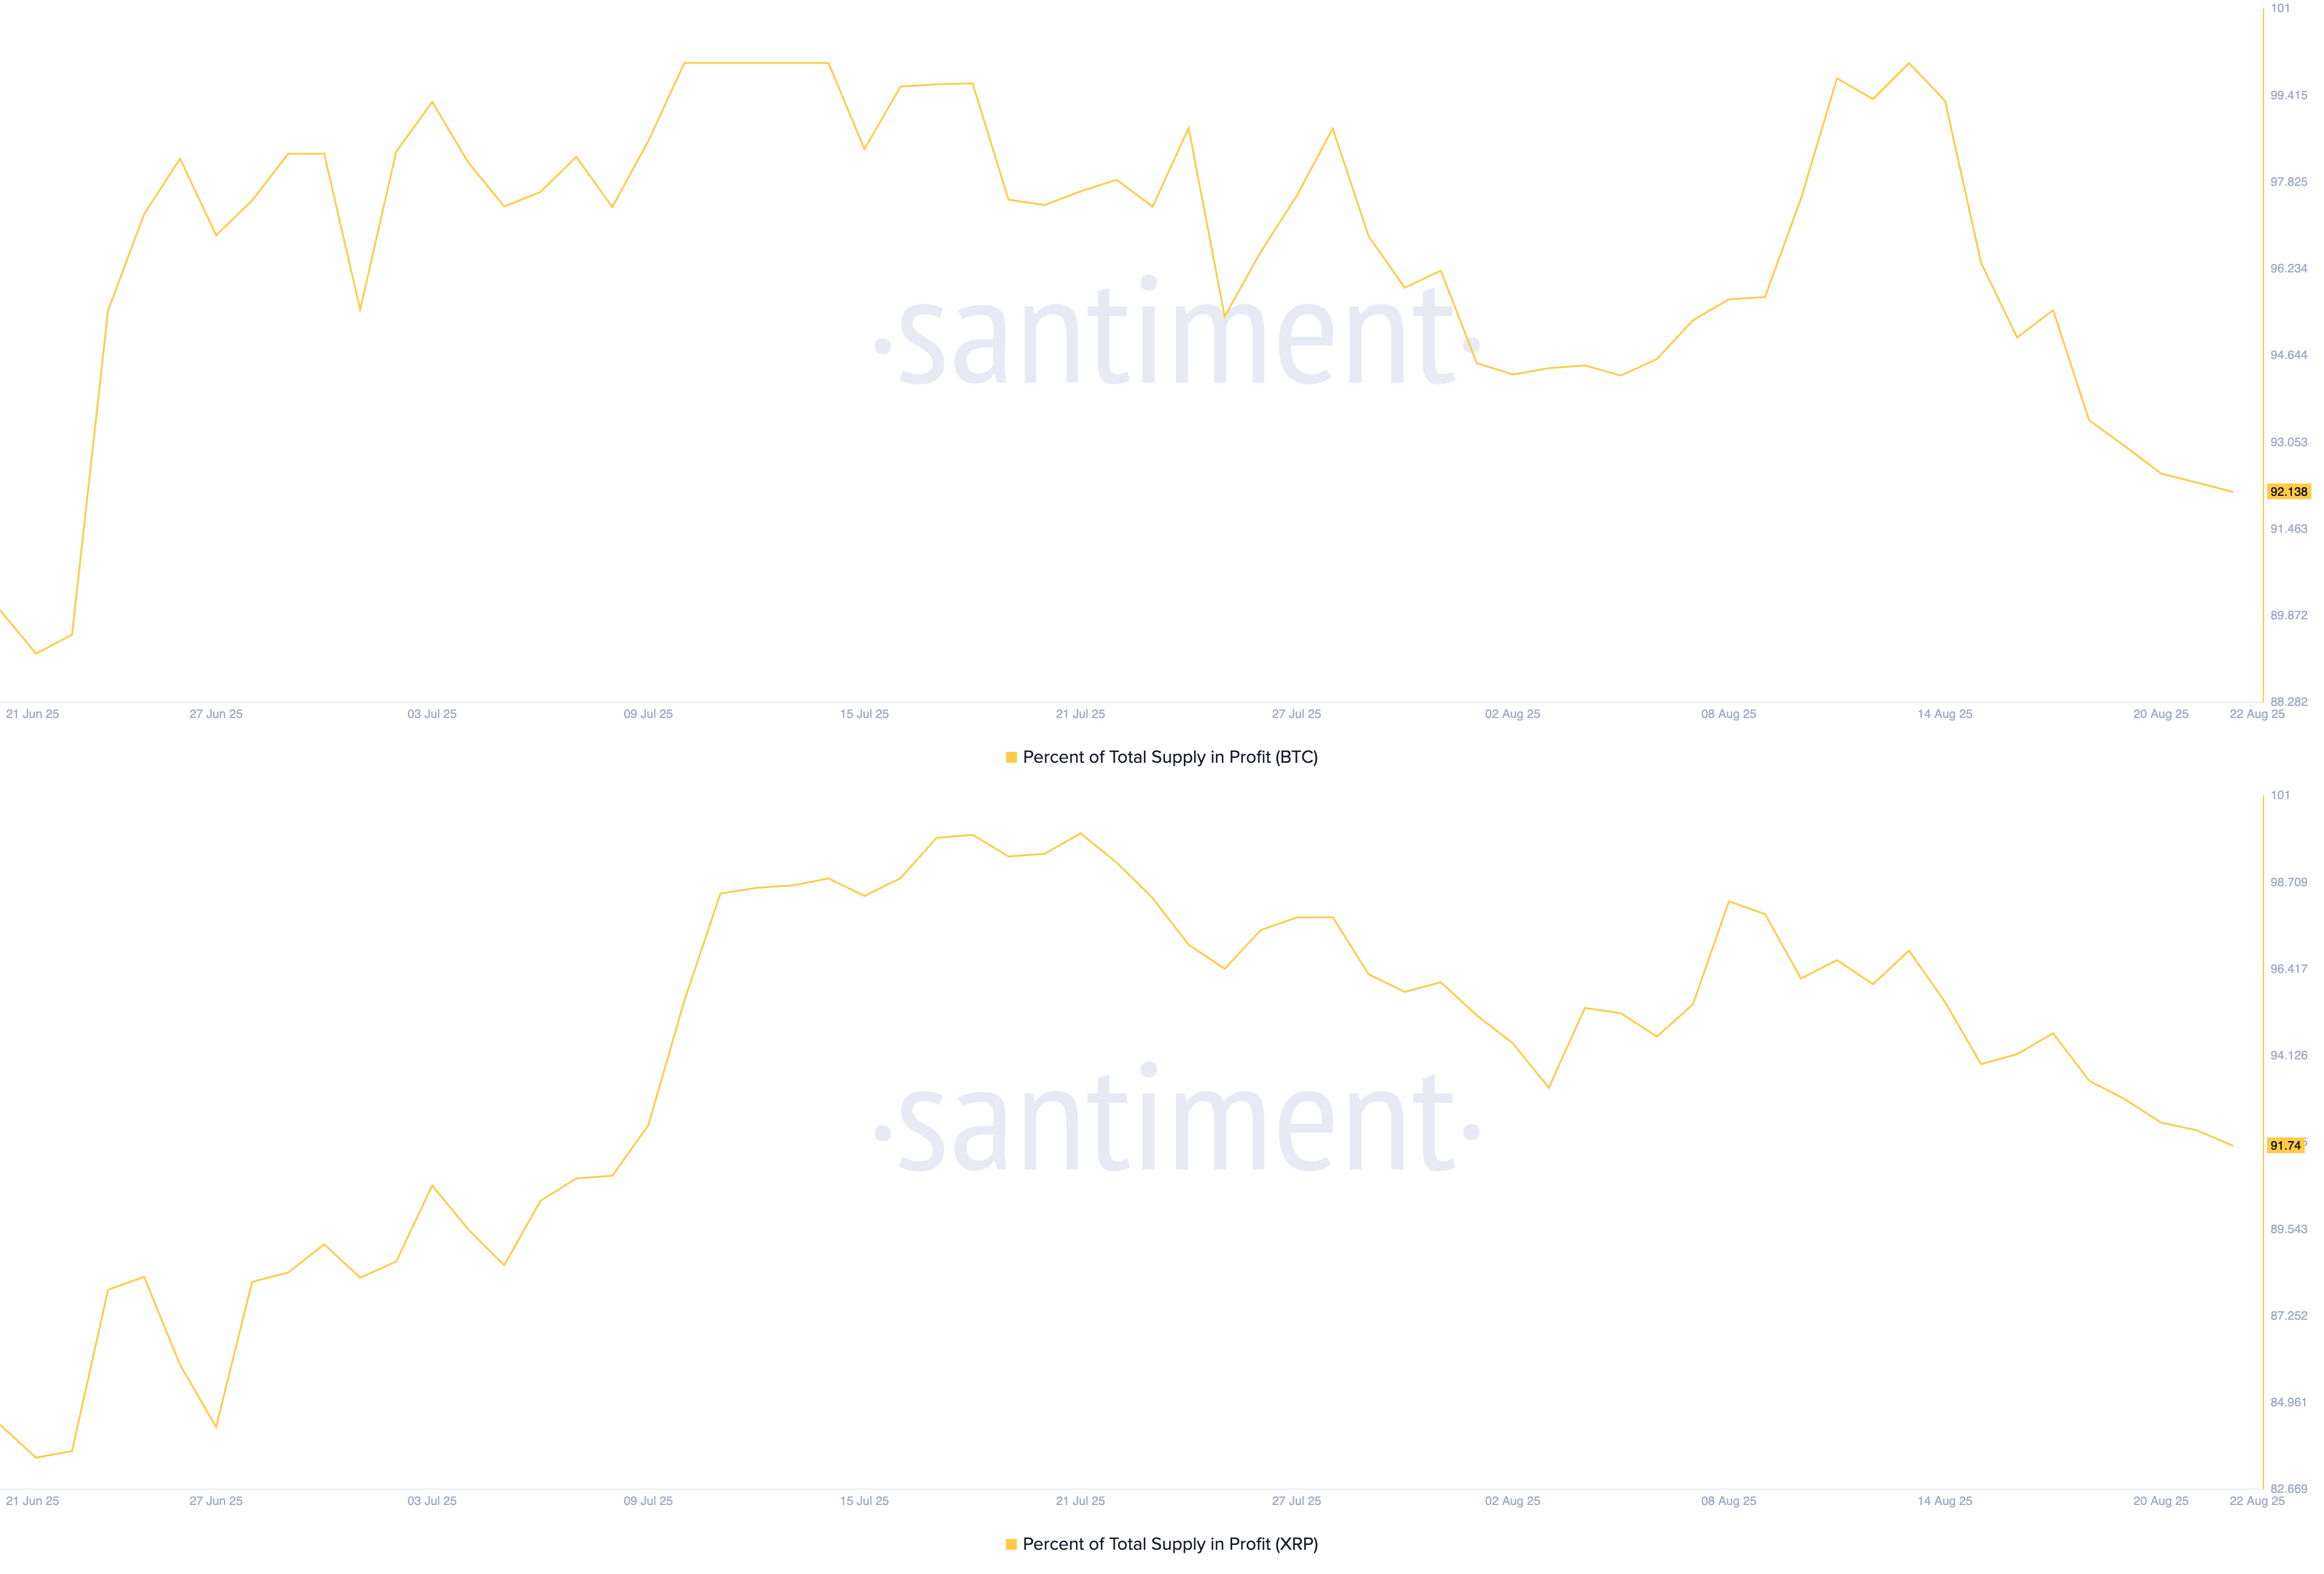
BTC, XRP supply in profit. Source: Santiment
Still, the euphoria in Ethereum is underpinned by institutional demand and altseason hype, retaining the percentage of supply in profit at 96.75%, slightly under the 99.86% high from August 13.
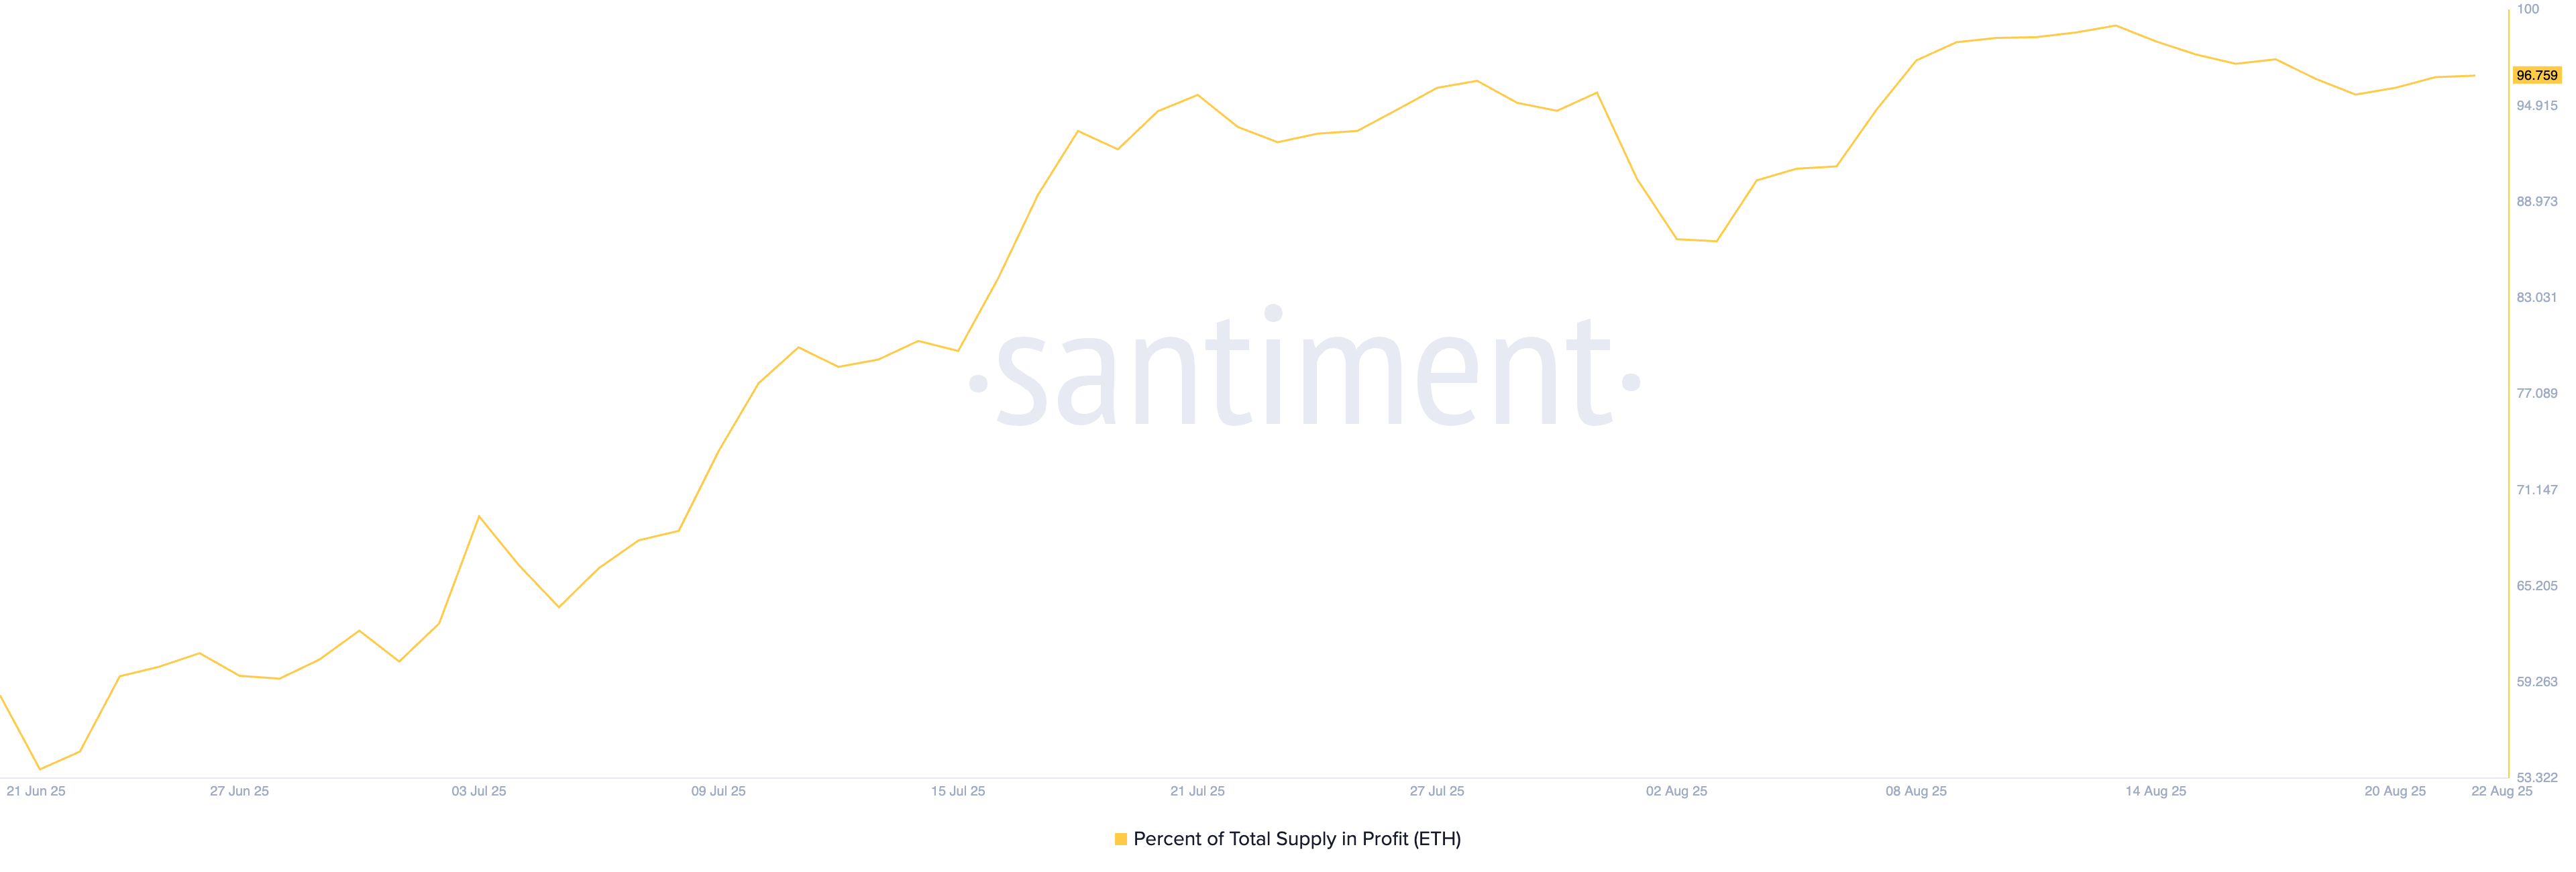
ETH supply in profit. Source: Santiment
Bitcoin at risk of further losses
Bitcoin edges lower to trade at $112,736 at the time of writing on Friday, retracing from the high of 113,525 earlier on the day. The loss of ground puts pressure on the $111,920 support level, a pivot point formed on August 3, which resulted in the early August recovery.
A potential daily close below this support level could ignite a freefall in BTC to the $107,245 level, marked by the July 4 low.
The momentum indicators flash mixed neutral to bearish signals on the daily chart. The Moving Average Convergence Divergence (MACD) falls below the zero line after crossing its signal line on Friday. A consecutive rise in red histogram bars indicates rising bearish momentum.
Still, the Relative Strength Index (RSI) at 41 holds above the oversold zone with a sideways shift. The slightly upwards-pointing RSI signals declining buying pressure struggling to absorb the incoming supply.
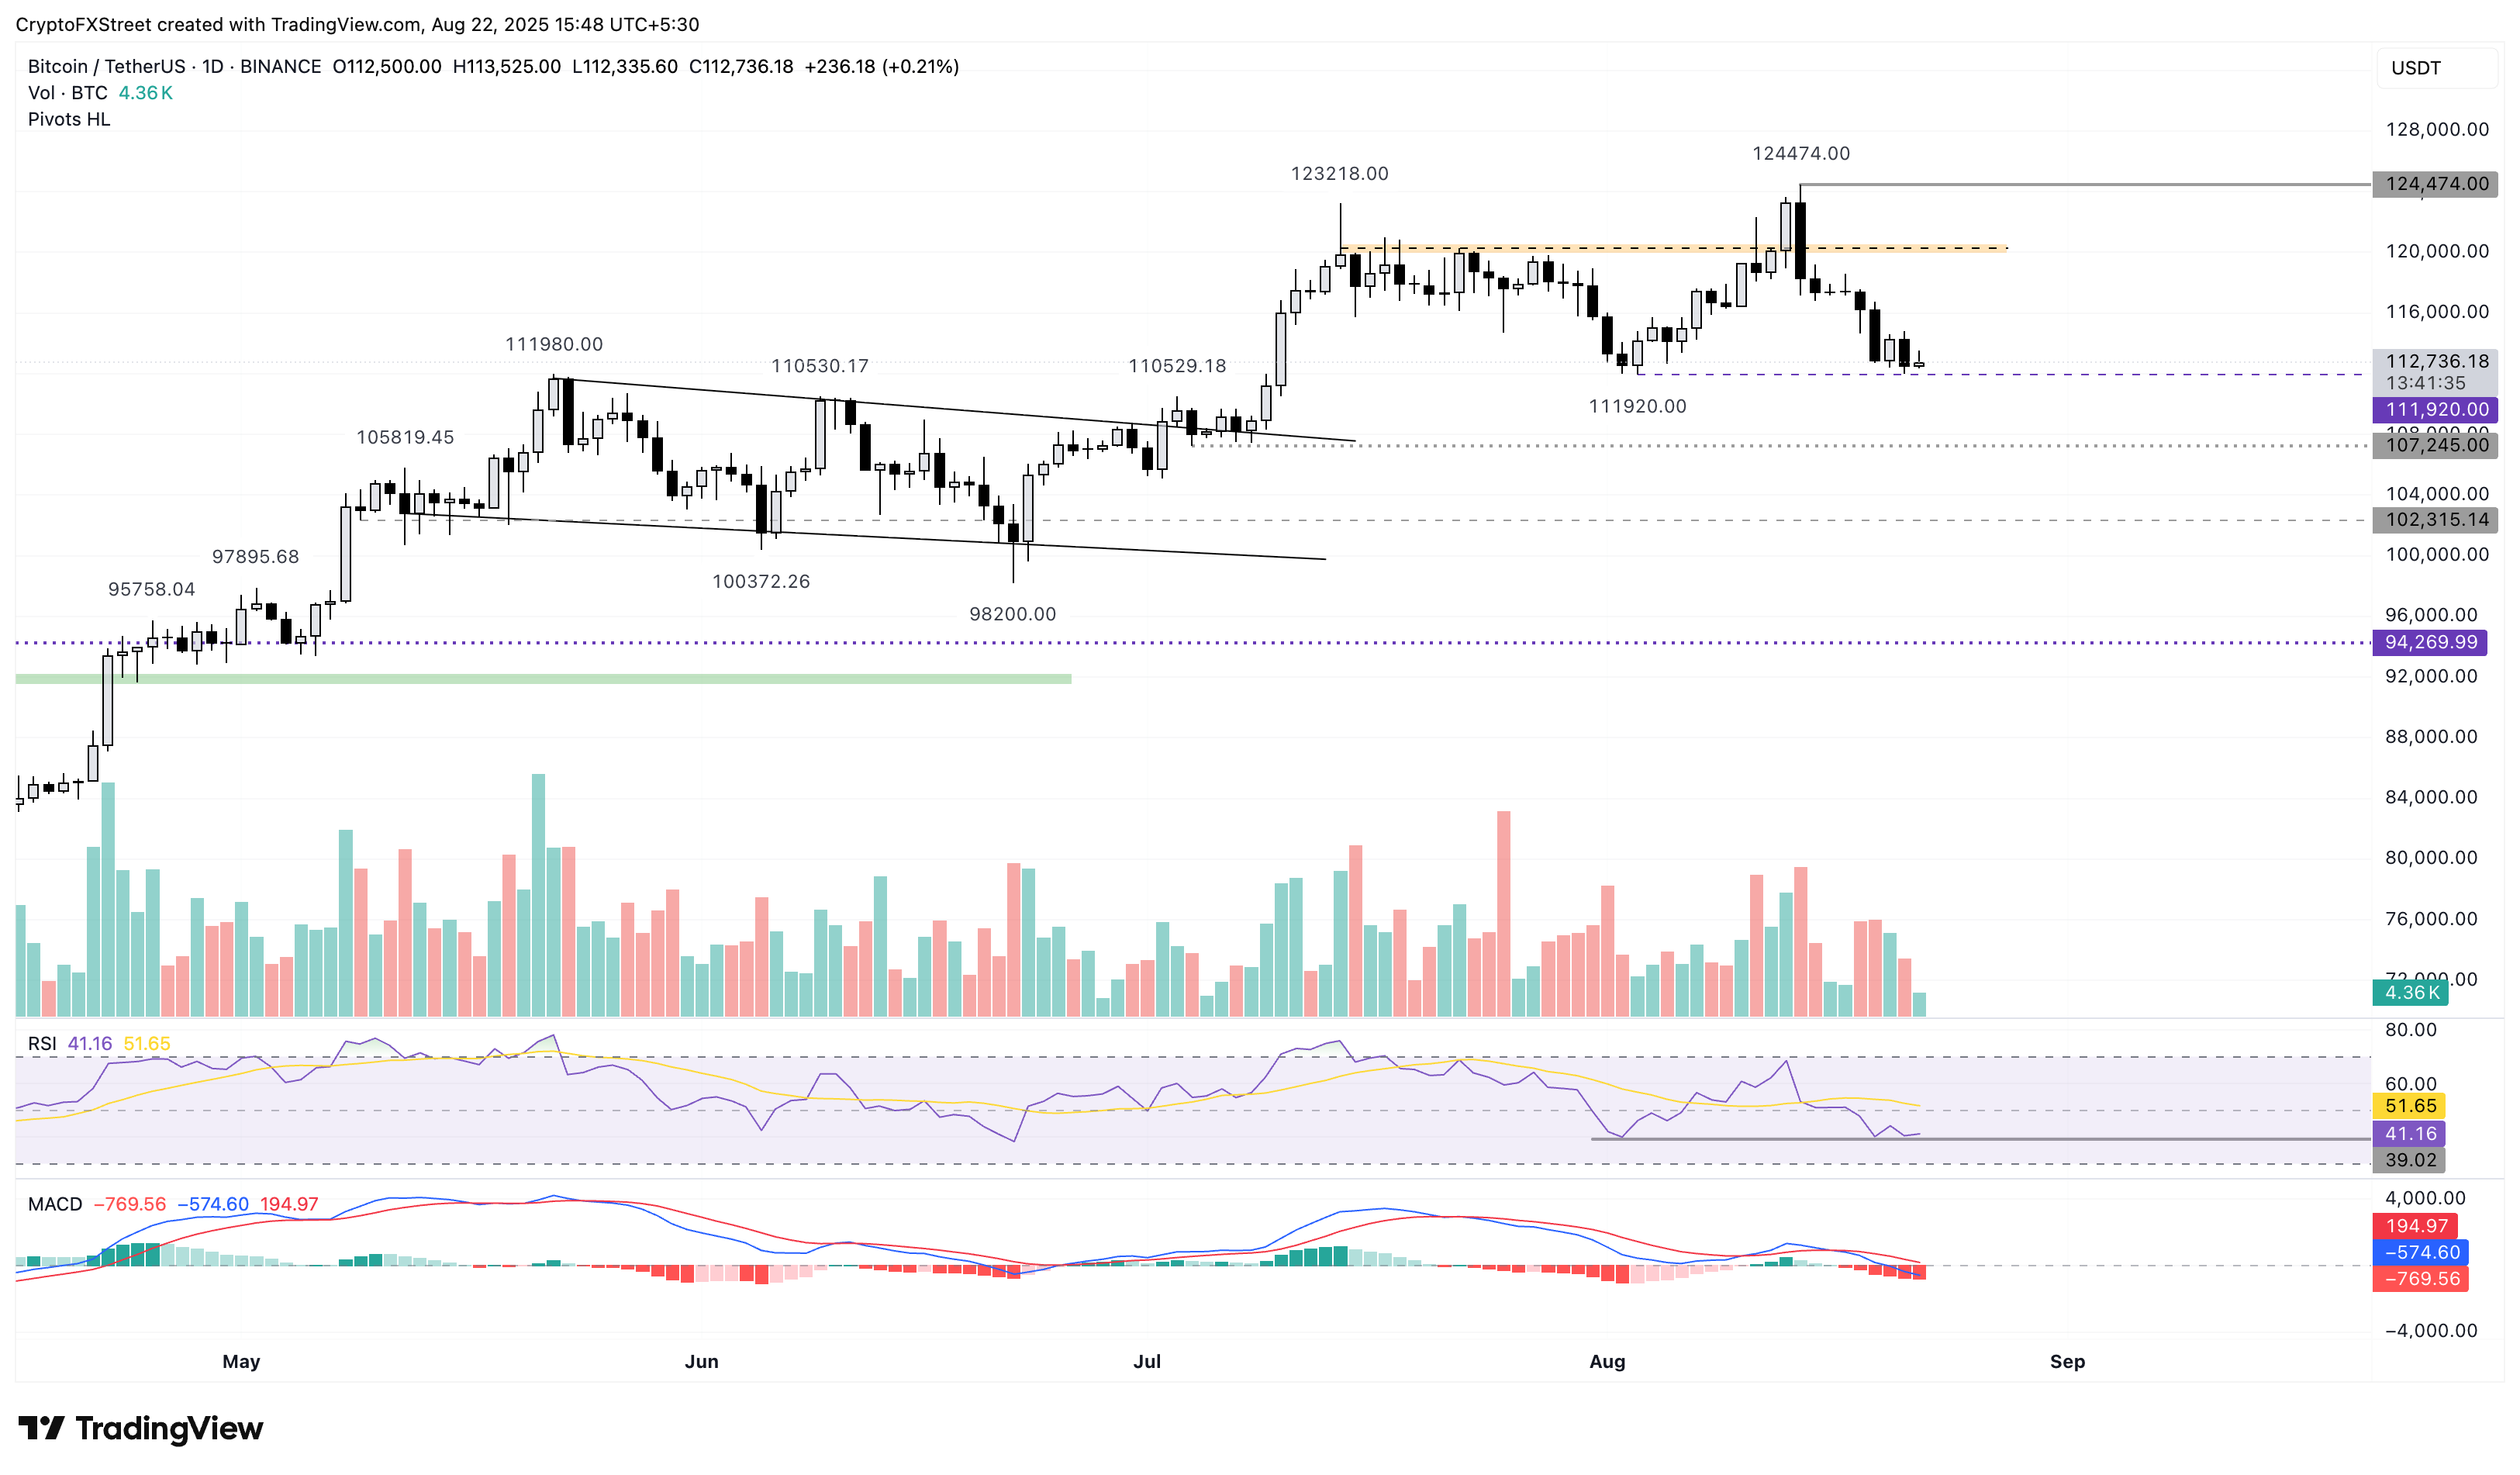
BTC/USDT price daily chart.
A bounce back in Bitcoin could kickstart the BTC rally, aiming towards the $120,000 supply zone.
Ethereum in a rising channel upholds optimism
Ethereum edges higher by over 1.50% at press time on Friday, following the 2.56% drop from the previous day. The largest altcoin by market capitalization, at $518 billion, struggles to retrace higher within a rising channel pattern.
A potential continuation of the uptrend in ETH could target the all-time high of $4,868.
The MACD indicator on the daily chart suggests a bearish bias as the average lines decline towards the zero line, accompanied by rising red histogram bars. Still, the RSI reads 56 on the same chart, pointing upwards, with room for growth above the neutral levels.
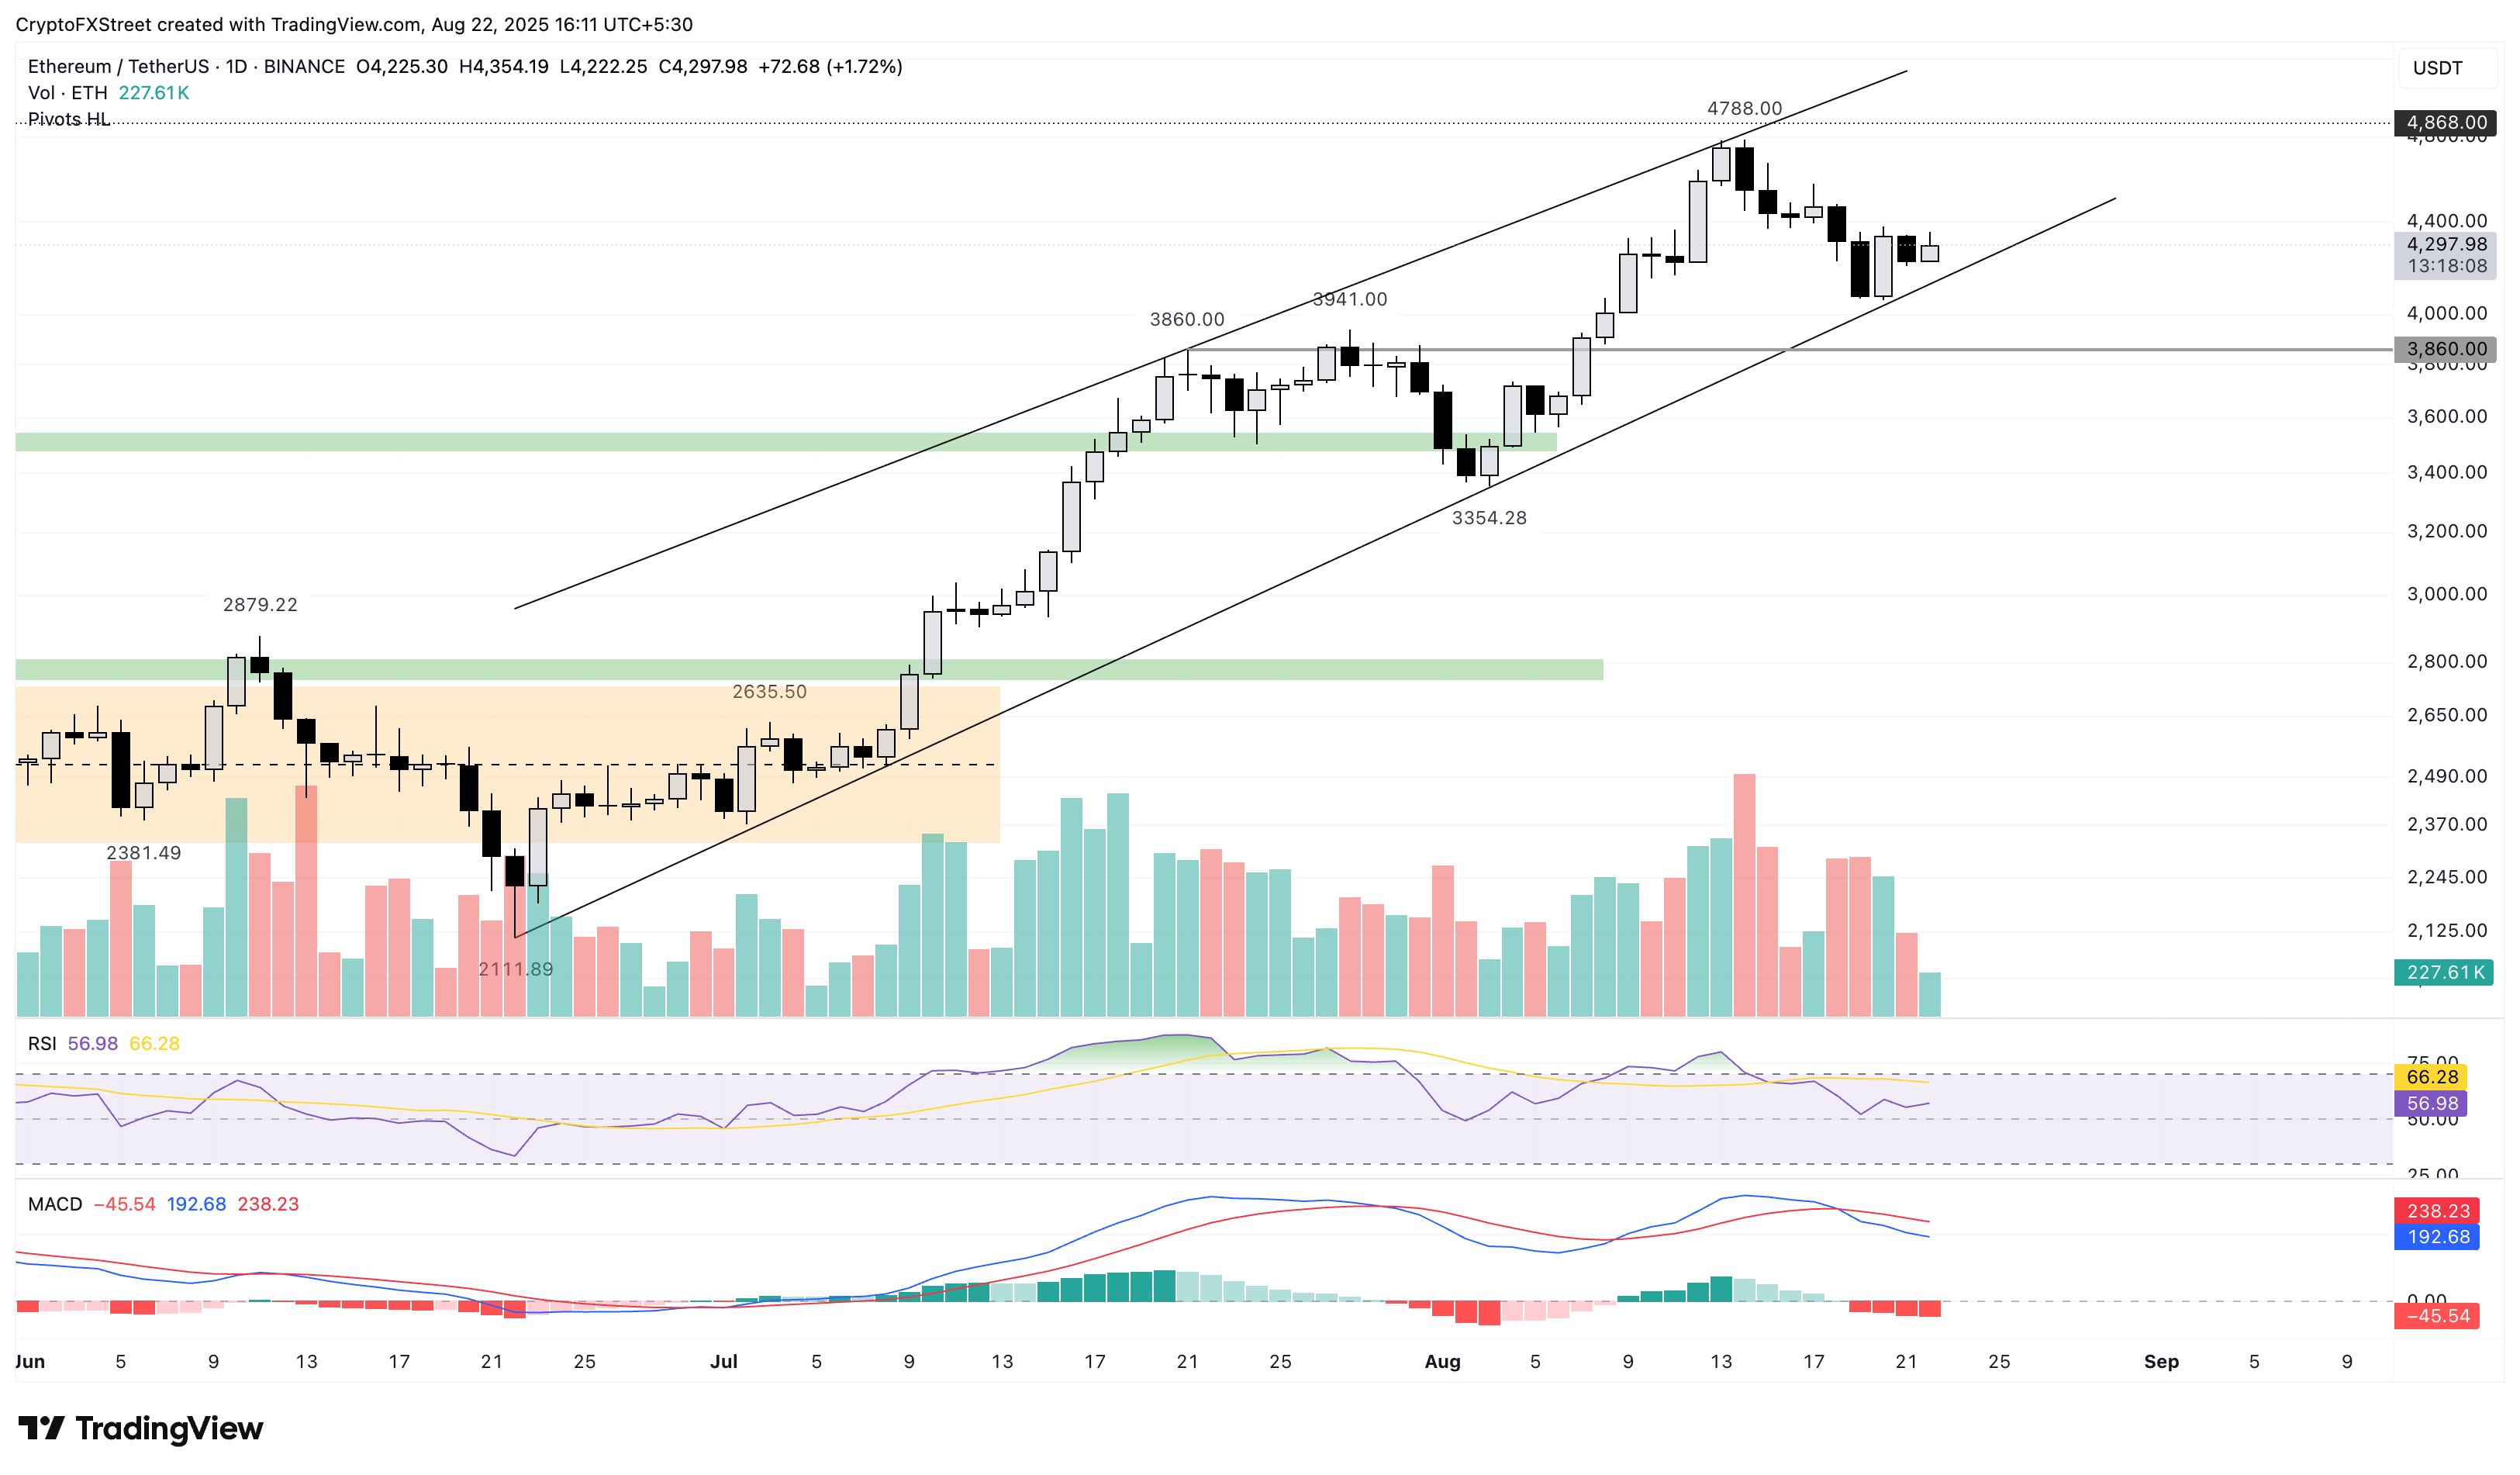
ETH/USDT price daily chart.
Looking down, a potential reversal in Ethereum below the support trendline, close to the $4,100 level, could cause prices to crash to the $3,860 level, marked by the high of July 21.
XRP eyes monthly low as selling pressure increases
XRP edges lower by under 0.50% at press time on Friday, extending the 3.36% loss from Thursday. The declining trend ticks below the 38.2% Fibonacci level at $2.85, which is drawn from the $1.90 low on June 22 to the $3.66 peak on July 18, risking further losses.
XRP could test the $2.75 demand zone, highlighted in yellow on the daily chart (shared below), if supply pressure increases.
The momentum indicators support double down on the downside risk as the MACD and its signal line trend lower amid rising red histogram bars. This indicates risk-off sentiment among investors.
Additionally, the RSI at 41, pointing downwards, eyes the oversold zone with further room for correction.
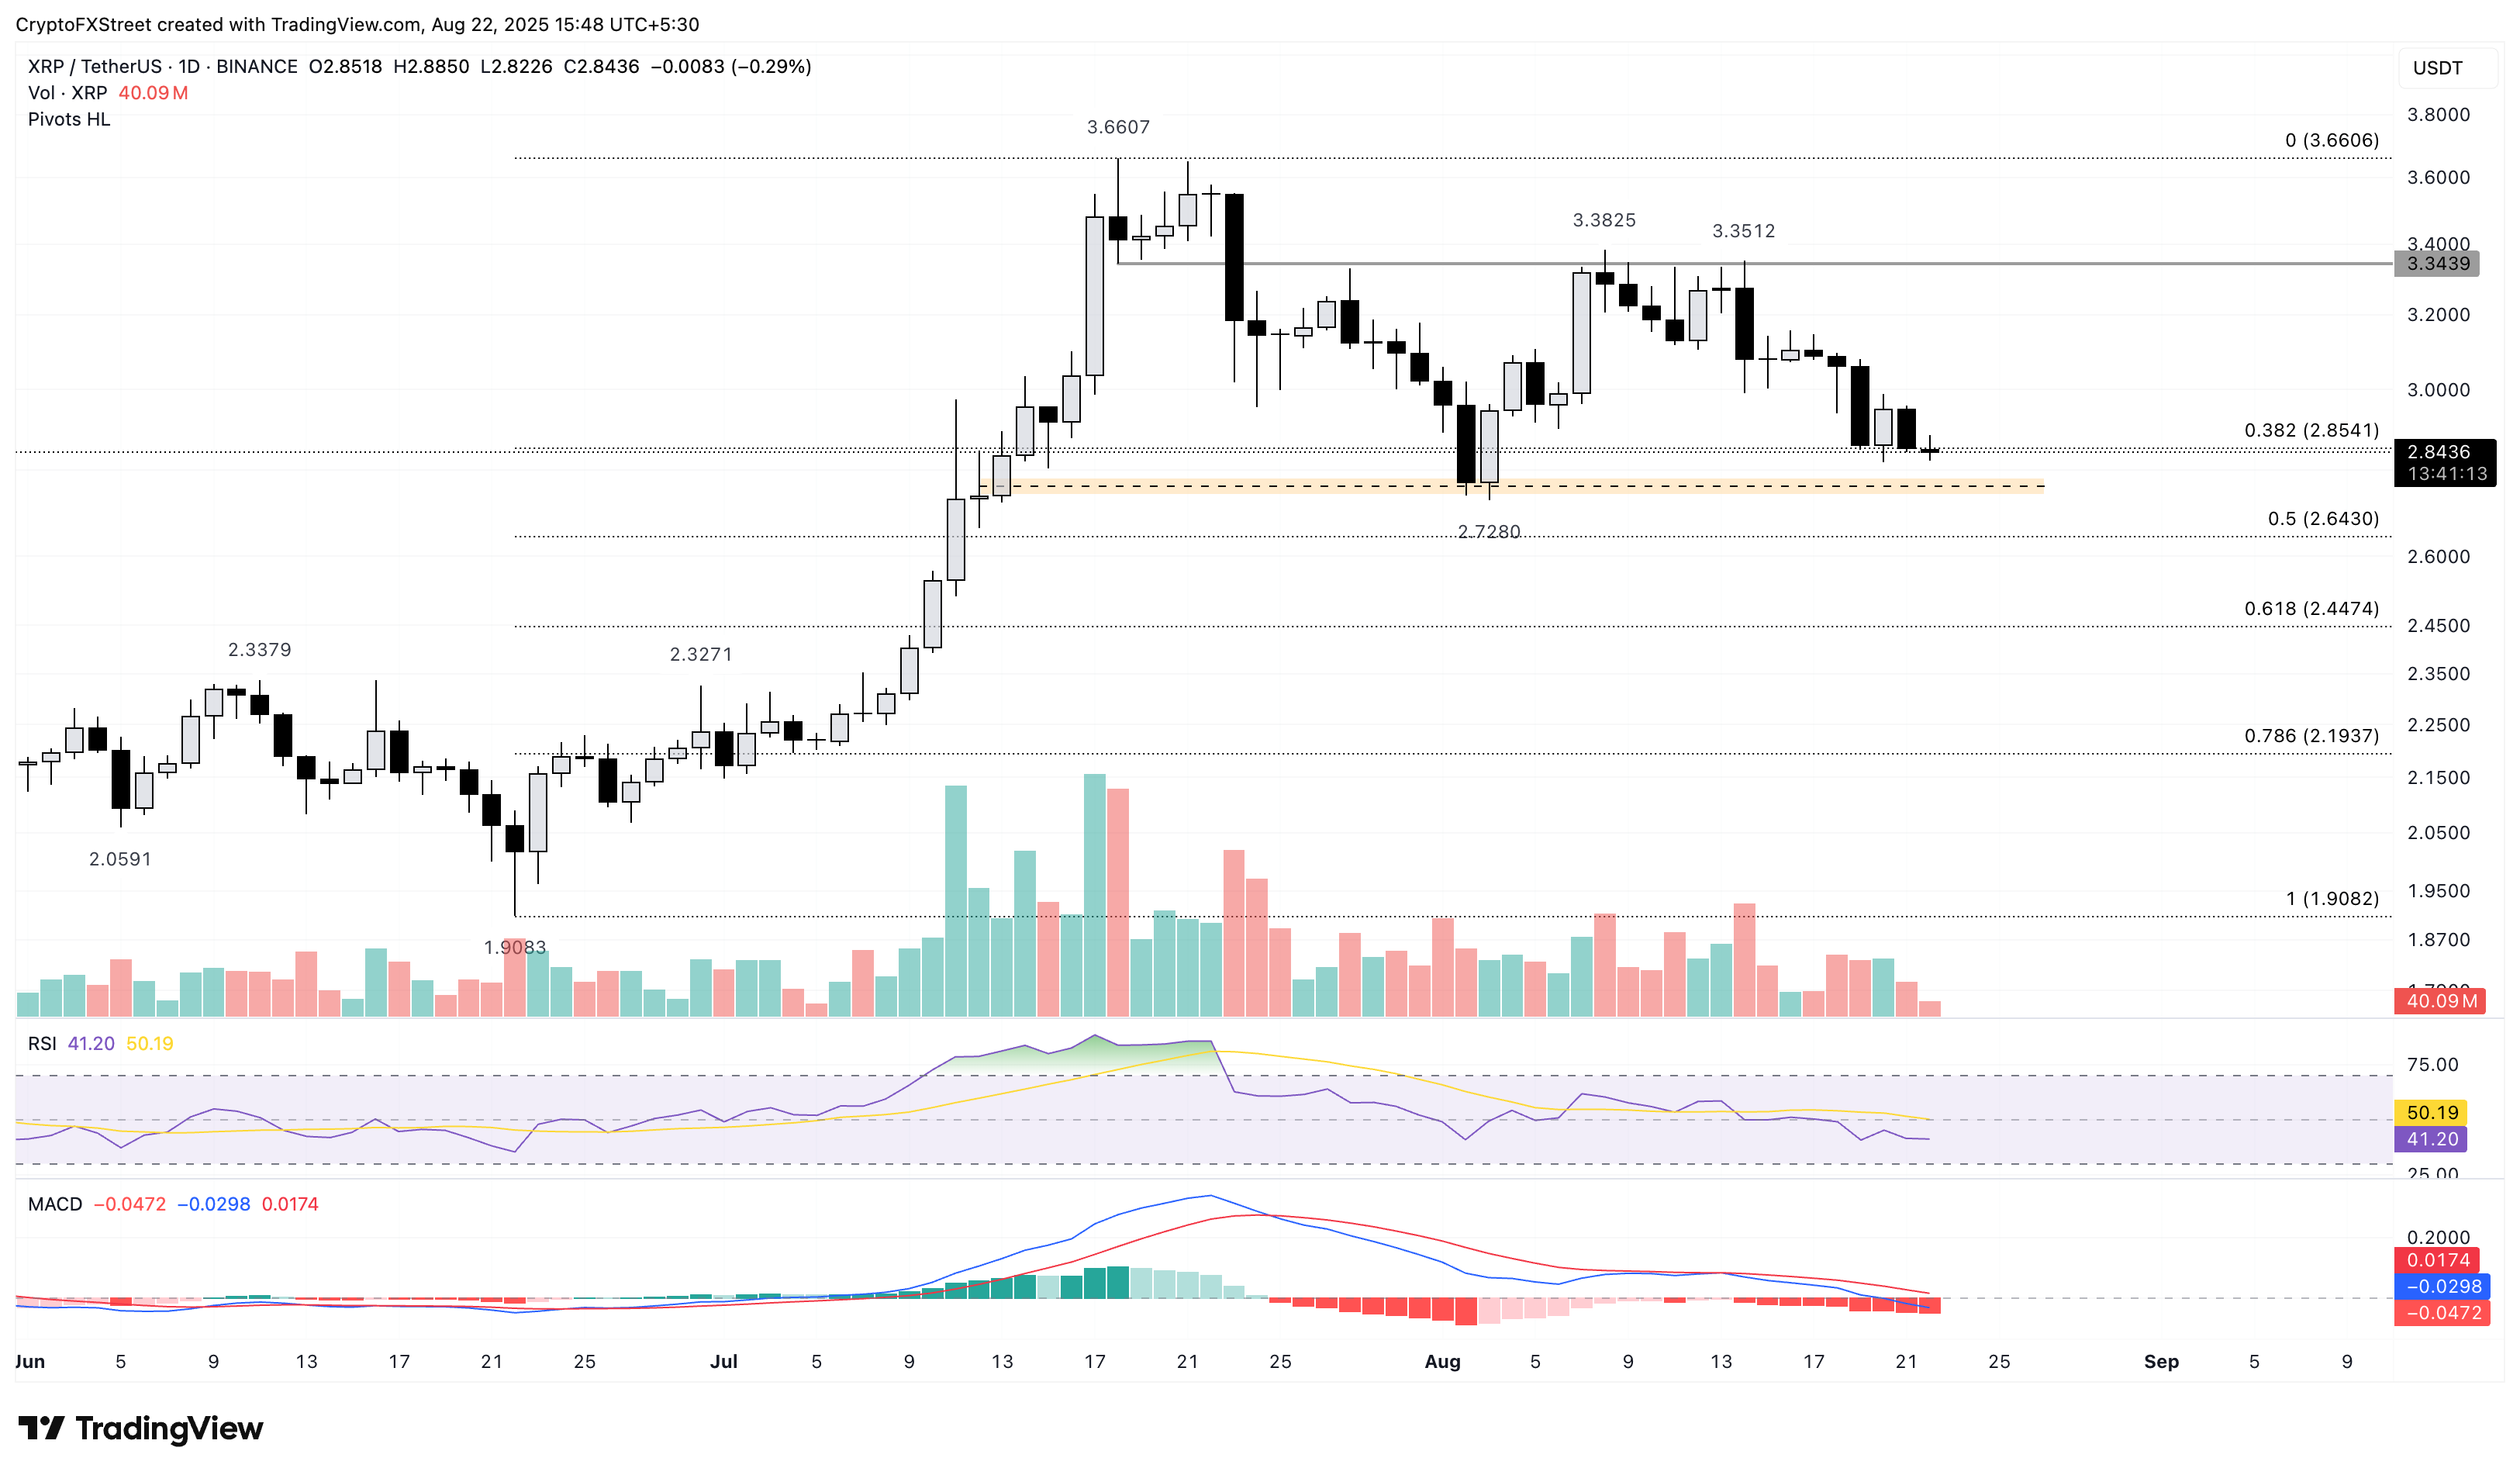
XRP/USDT price daily chart.
On the contrary, if XRP reclaims the $3.00 psychological level, the rejuvenated uptrend could target the $3.66 peak.
Bitcoin, altcoins, stablecoins FAQs
What is Bitcoin?
Bitcoin is the largest cryptocurrency by market capitalization, a virtual currency designed to serve as money. This form of payment cannot be controlled by any one person, group, or entity, which eliminates the need for third-party participation during financial transactions.
What are altcoins?
Altcoins are any cryptocurrency apart from Bitcoin, but some also regard Ethereum as a non-altcoin because it is from these two cryptocurrencies that forking happens. If this is true, then Litecoin is the first altcoin, forked from the Bitcoin protocol and, therefore, an “improved” version of it.
What are stablecoins?
Stablecoins are cryptocurrencies designed to have a stable price, with their value backed by a reserve of the asset it represents. To achieve this, the value of any one stablecoin is pegged to a commodity or financial instrument, such as the US Dollar (USD), with its supply regulated by an algorithm or demand. The main goal of stablecoins is to provide an on/off-ramp for investors willing to trade and invest in cryptocurrencies. Stablecoins also allow investors to store value since cryptocurrencies, in general, are subject to volatility.
What is Bitcoin Dominance?
Bitcoin dominance is the ratio of Bitcoin's market capitalization to the total market capitalization of all cryptocurrencies combined. It provides a clear picture of Bitcoin’s interest among investors. A high BTC dominance typically happens before and during a bull run, in which investors resort to investing in relatively stable and high market capitalization cryptocurrency like Bitcoin. A drop in BTC dominance usually means that investors are moving their capital and/or profits to altcoins in a quest for higher returns, which usually triggers an explosion of altcoin rallies.

Log in to Reply
Log in to comment your thoughtsComments
Related Articles
|Square
Get the BTCC app to start your crypto journey
Get started today Scan to join our 100M+ users