Bitcoin Elliott Wave Analysis: Mapping the Next Bull Run Trajectory
Bitcoin's chart patterns scream opportunity—Elliott Wave theory points to explosive growth ahead.
Wave patterns don't lie. The current consolidation sets up for a massive fifth-wave extension that could shatter previous all-time highs.
Technical indicators align perfectly with historical bull market structures. Each retracement creates stronger support levels while institutional accumulation continues unabated.
Traders watching Fibonacci extensions should prepare for targets well beyond conservative estimates. The wave count suggests we're barely halfway through this cycle.
Traditional analysts still don't get it—they're busy calculating P/E ratios for companies that'll be obsolete before their reports print. Meanwhile, Bitcoin's mathematical certainty keeps printing generational wealth for those who understand the waves.
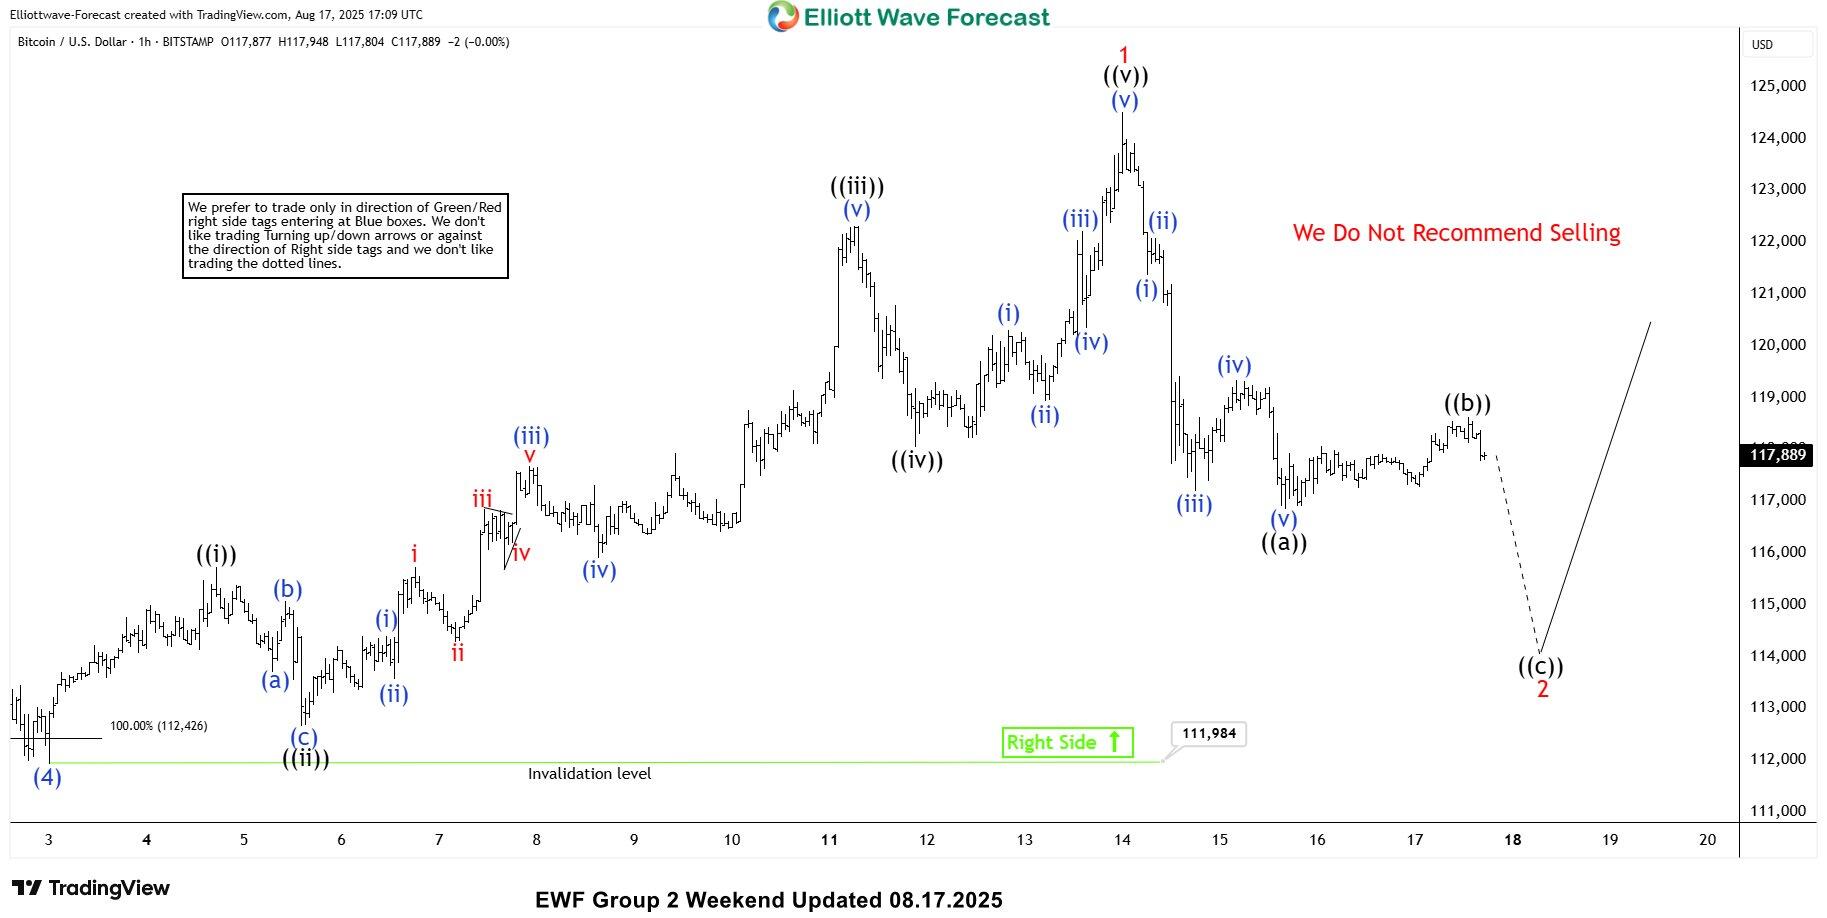
BTC/USD Elliott Wave one-hour weekend chart 08.17.2025
Current view suggests Bitcoin is doing a correction against the 111,984 low. We can count clear 5 waves in the drop from the peak which indicates we have got most likely on the first leg of pull back thaat is unfolding as a Zig Zag 5-3-5 structure. So,we expect another leg down to retest the 111,984 low.

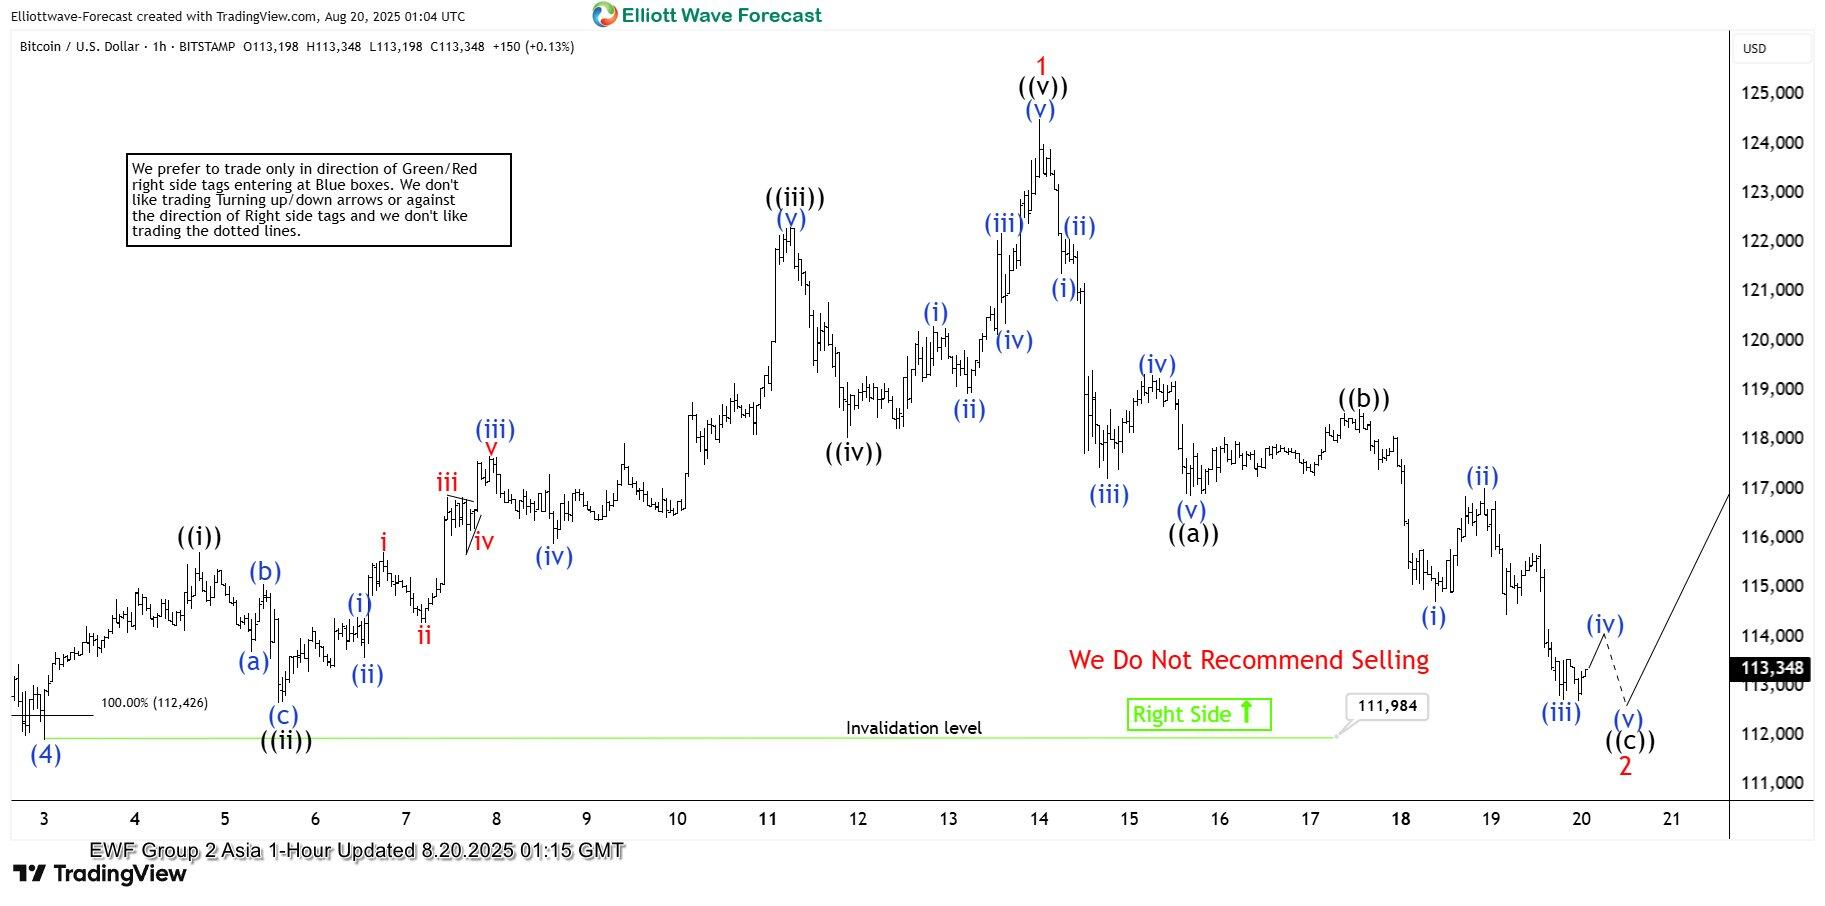
BTC/USD Elliott Wave one-hour weekend chart 08.17.2025
Bitcoin made the drop as expected. So far, we can count only three waves from the peak, which is an incomplete structure for the ((c)) leg. We expect a short-term bounce followed by a final push down to complete five waves in the ((c)) leg. If the price breaks below the 111,984 low, it will invalidate the Elliott Wave count.


