Crypto Bloodbath: Bitcoin, Ethereum, XRP Face $500M Liquidation Storm—Buying Opportunity or Doom Loop?

Crypto markets just got steamrolled—half a billion in liquidations triggers panic. Here’s what’s next.
### The Domino Effect: Leverage Wipes Out Traders
Liquidations scream 'overleveraged gamblers'—classic crypto. Bitcoin leads the nosedive, Ethereum and XRP caught in the undertow.
### Whales vs. Minnows: Who’s Really Bleeding?
Retail traders got rekt (again), but institutional cold wallets barely flinch. Same old story—weak hands fold first.
### Bottom Fishing or Dead Cat Bounce?
Technicals say 'oversold.' Macro says 'risk-off.' Crypto says 'hold my margarita.' One thing’s certain: volatility isn’t retiring.
---
PS: Traders who ‘diversified’ into shitcoins now discovering the hard way that 99% correlation isn’t a strategy—it’s a suicide pact.
Crypto market bleeds over $500 million within 24 hours
CoinGlass data indicate that the broader cryptocurrency liquidations totaled $552.42 million, comprising $483.23 million in long positions and $69.06 million in short positions.
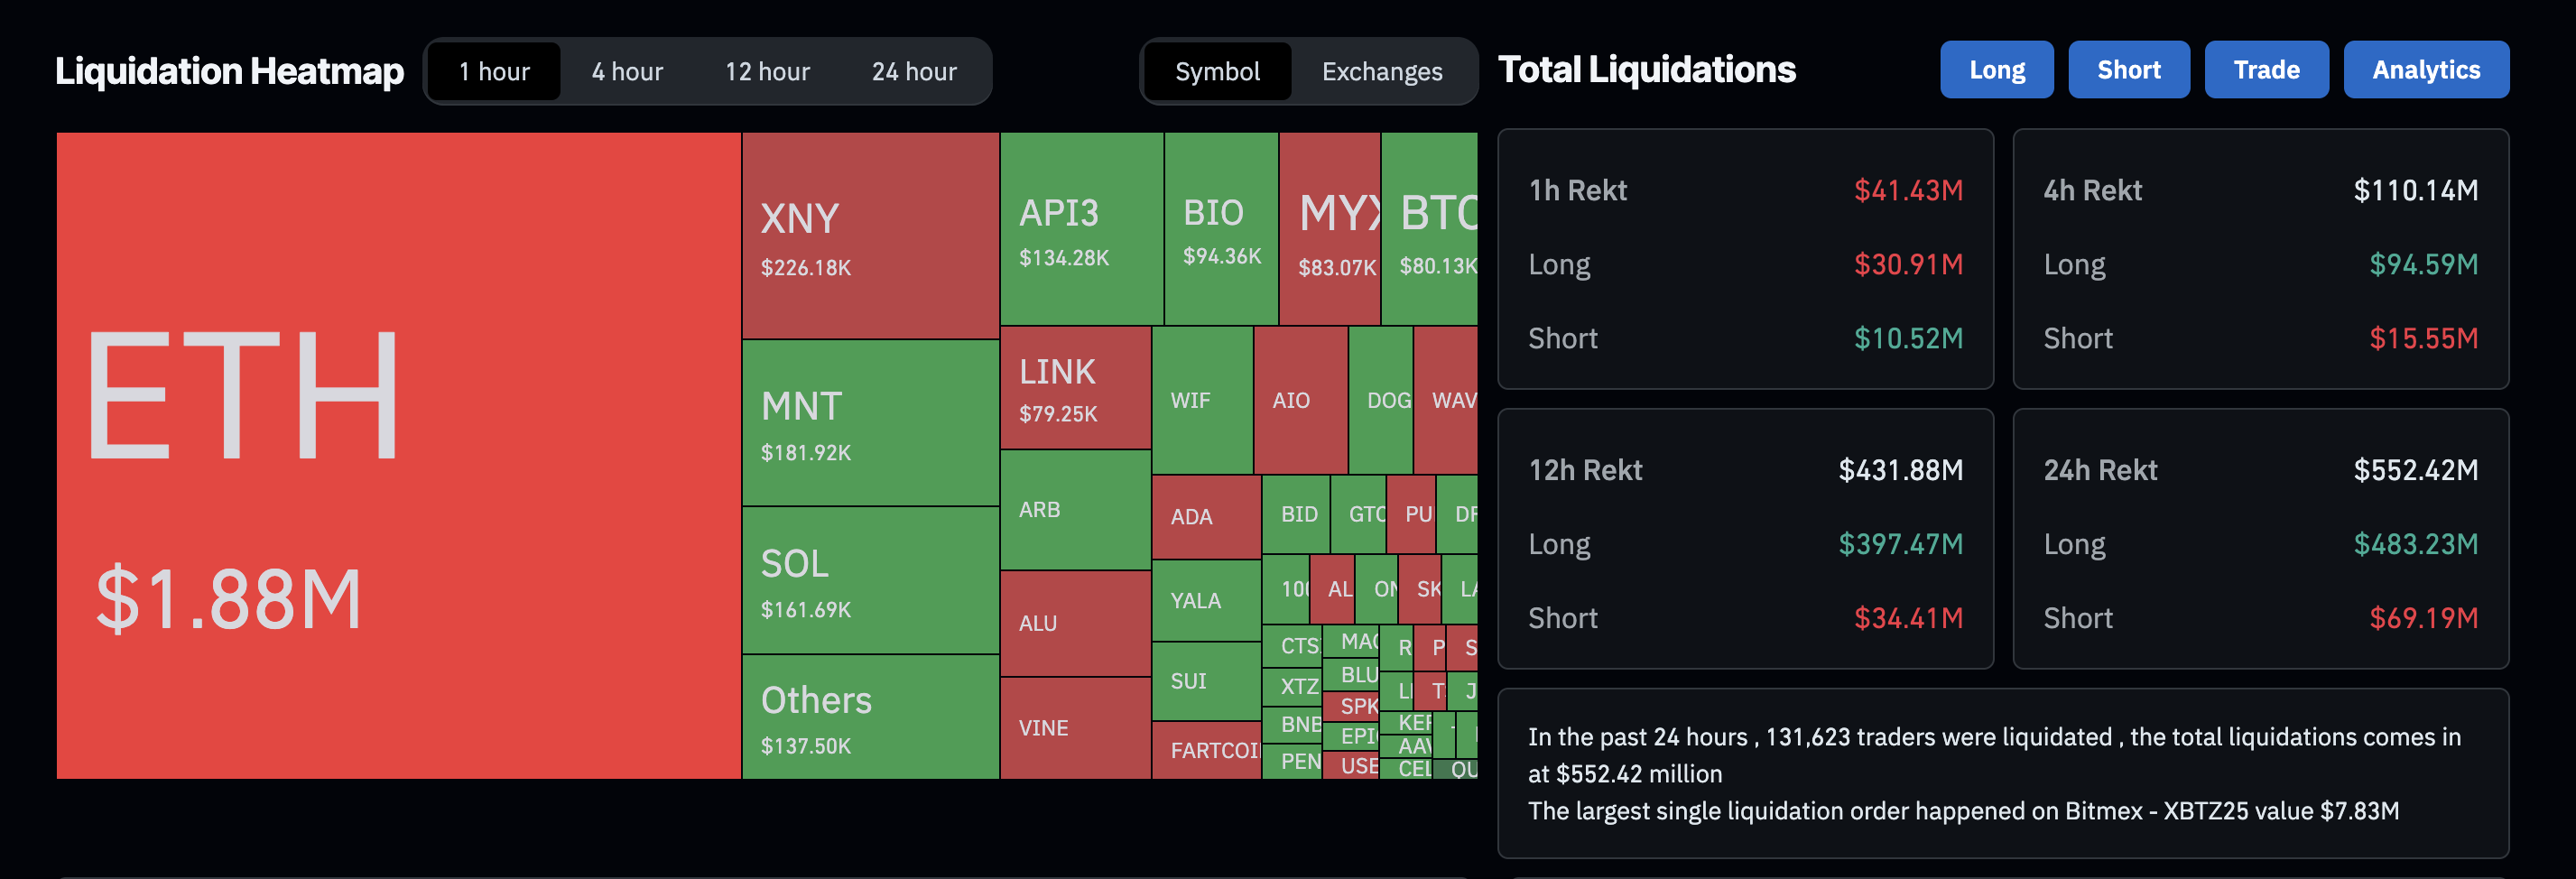
The clear imbalance of massive long liquidations suggests a shift to risk-off sentiment among investors. Amid such conditions, the crypto market could face further correction as fear tightens its grip.
Institutions uphold confidence in Bitcoin and Ethereum
Despite the pullback at the end of last week, Bitcoin and Ethereum were able to attract significant funds from US institutions. This marks an increase in confidence among institutional investors, which will be put to the test as Bitcoin and Ethereum experience steep declines this Monday.
Sosovalue data shows Ethereum marking its largest weekly net inflow of $2.85 billion, marking its fourteenth consecutive week of positive flows.
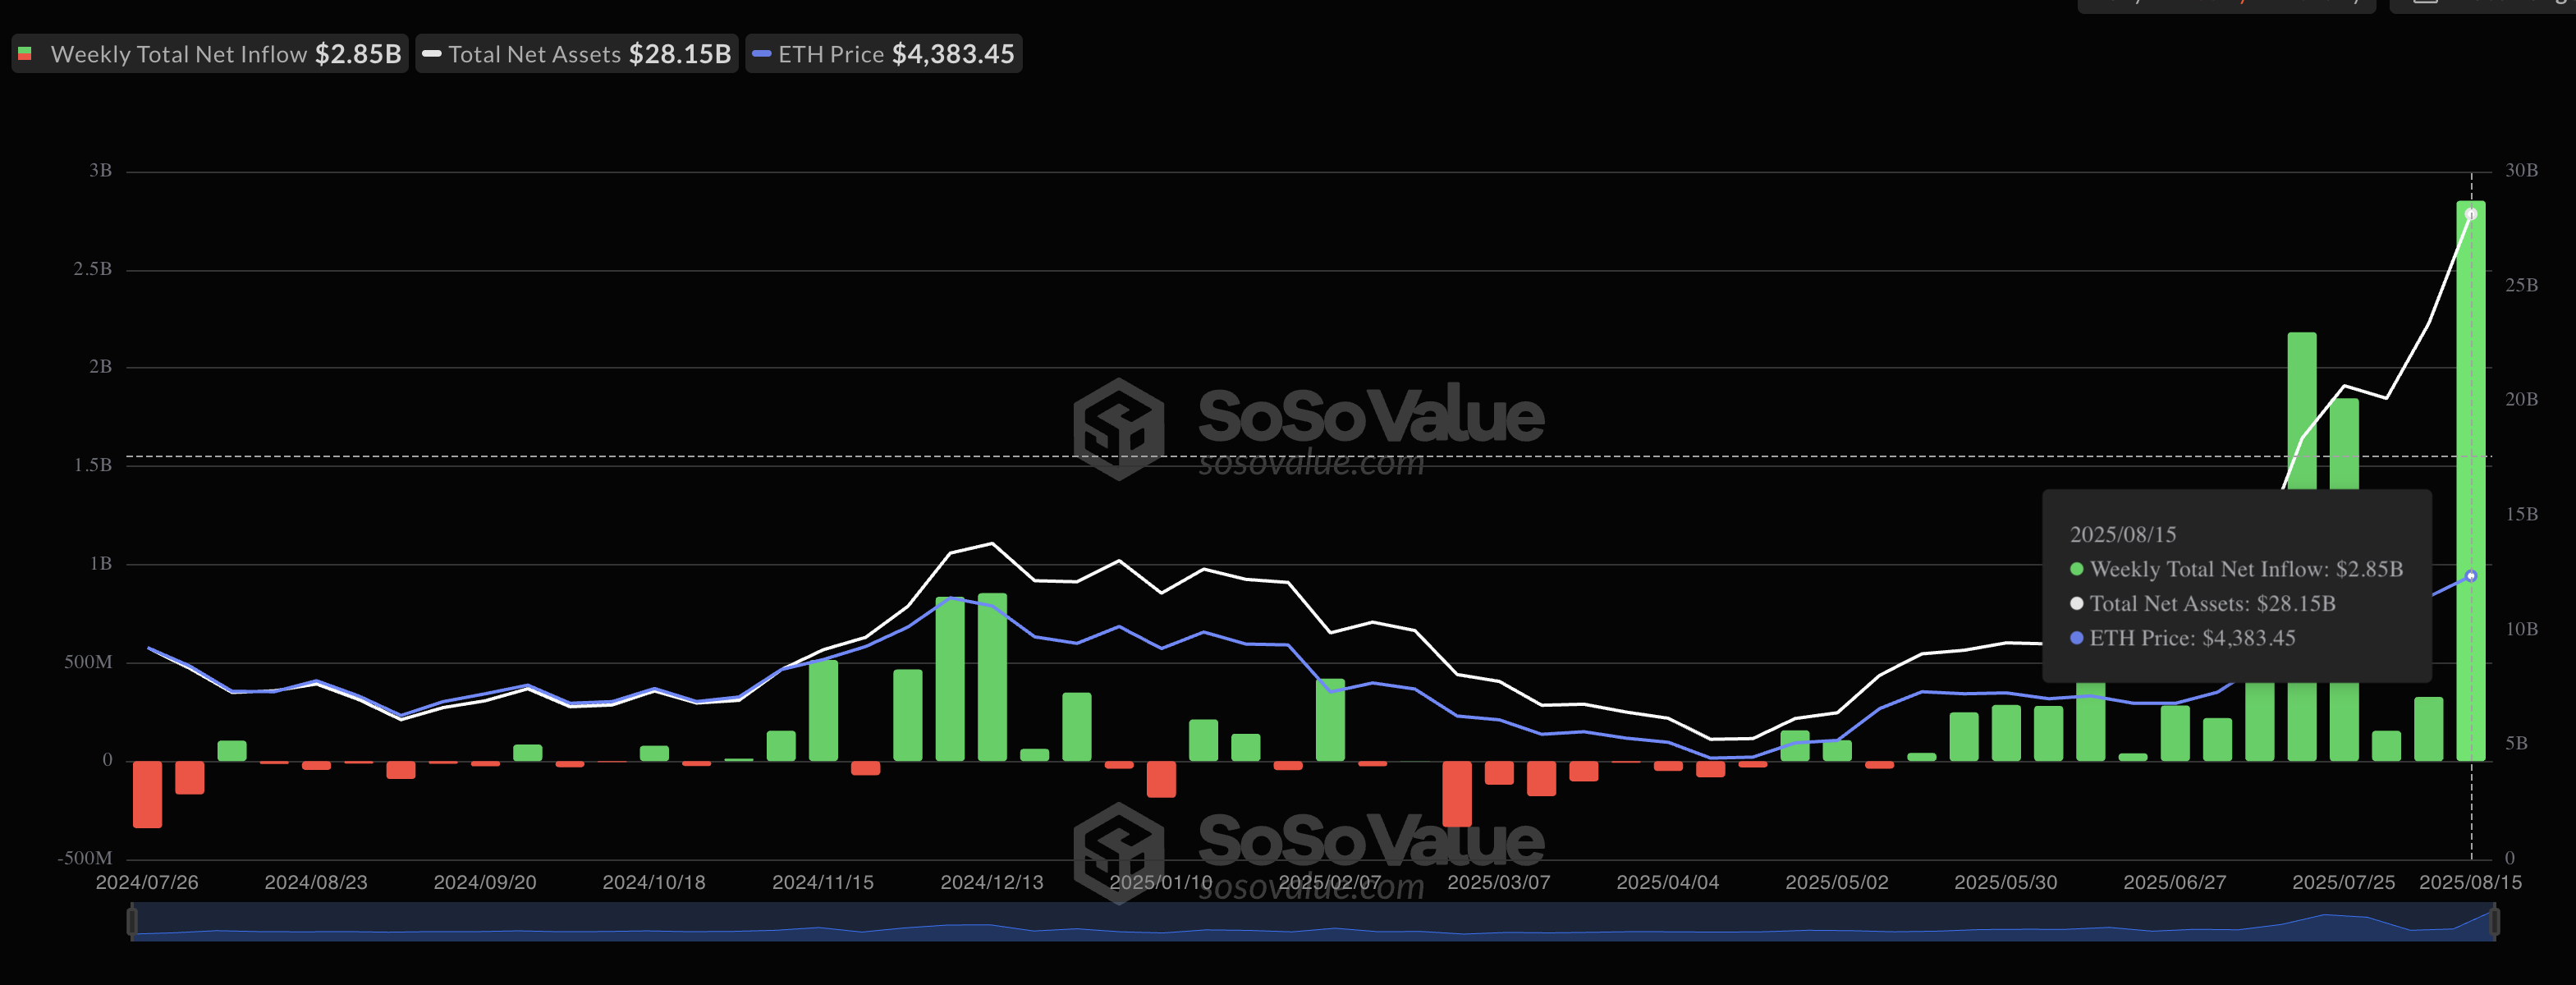
Ethereum spot ETF data | Source: SoSoValue
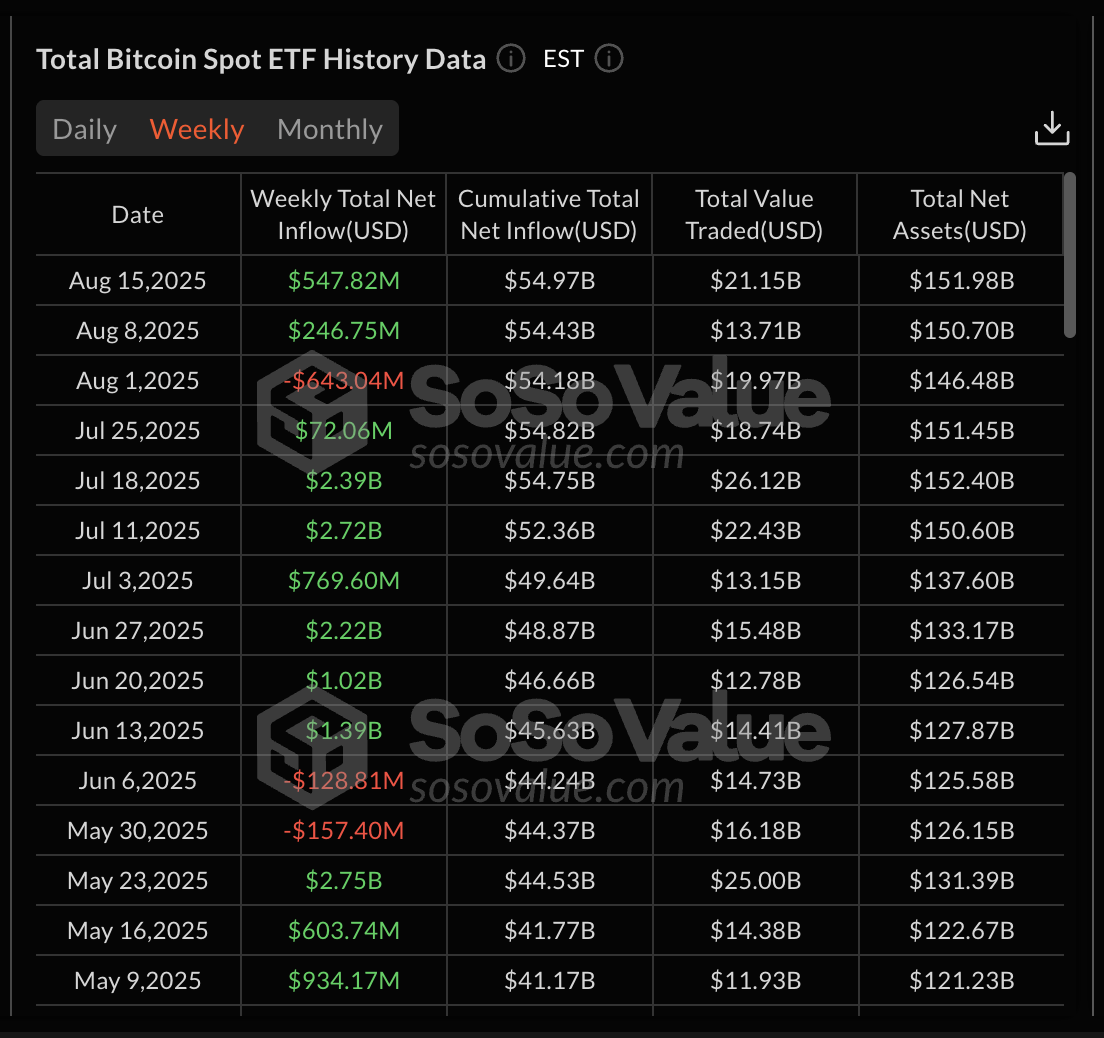
Bitcoin, on the other hand, maintained steady growth, with $547.82 billion in net inflows, surpassing the $246.75 billion in net inflows from the previous week.
Bitcoin spot ETF data | Source: SoSoValue
The US-based Bitcoin and Ethereum ETFs hold total assets worth $151.98 billion and $28.15 billion, respectively.
Bitcoin loses strength, bears target $111,980
Bitcoin ticks lower by 2% at press time on Monday, crossing under the 50-day EMA at $115,001. Bitcoin’s bullish run from last week's peak at $124,474 on Thursday, resulting in a 4% drop on the day, ignited the ongoing pullback.
The path of least resistance targets the $111,980 support level, last tested on August 3, as pressure on bitcoin intensifies.
The momentum indicators flash a sell signal as bullish momentum fades. On the daily chart, the Moving Average Convergence Divergence (MACD) crosses below its signal line. Additionally, the Relative Strength Index (RSI) is at 44, below the halfway line, indicating a decline in buying pressure.
The 100-day and 200-day EMAs at $110,362 and $102,939, respectively, could act as dynamic support levels if the downtrend continues.
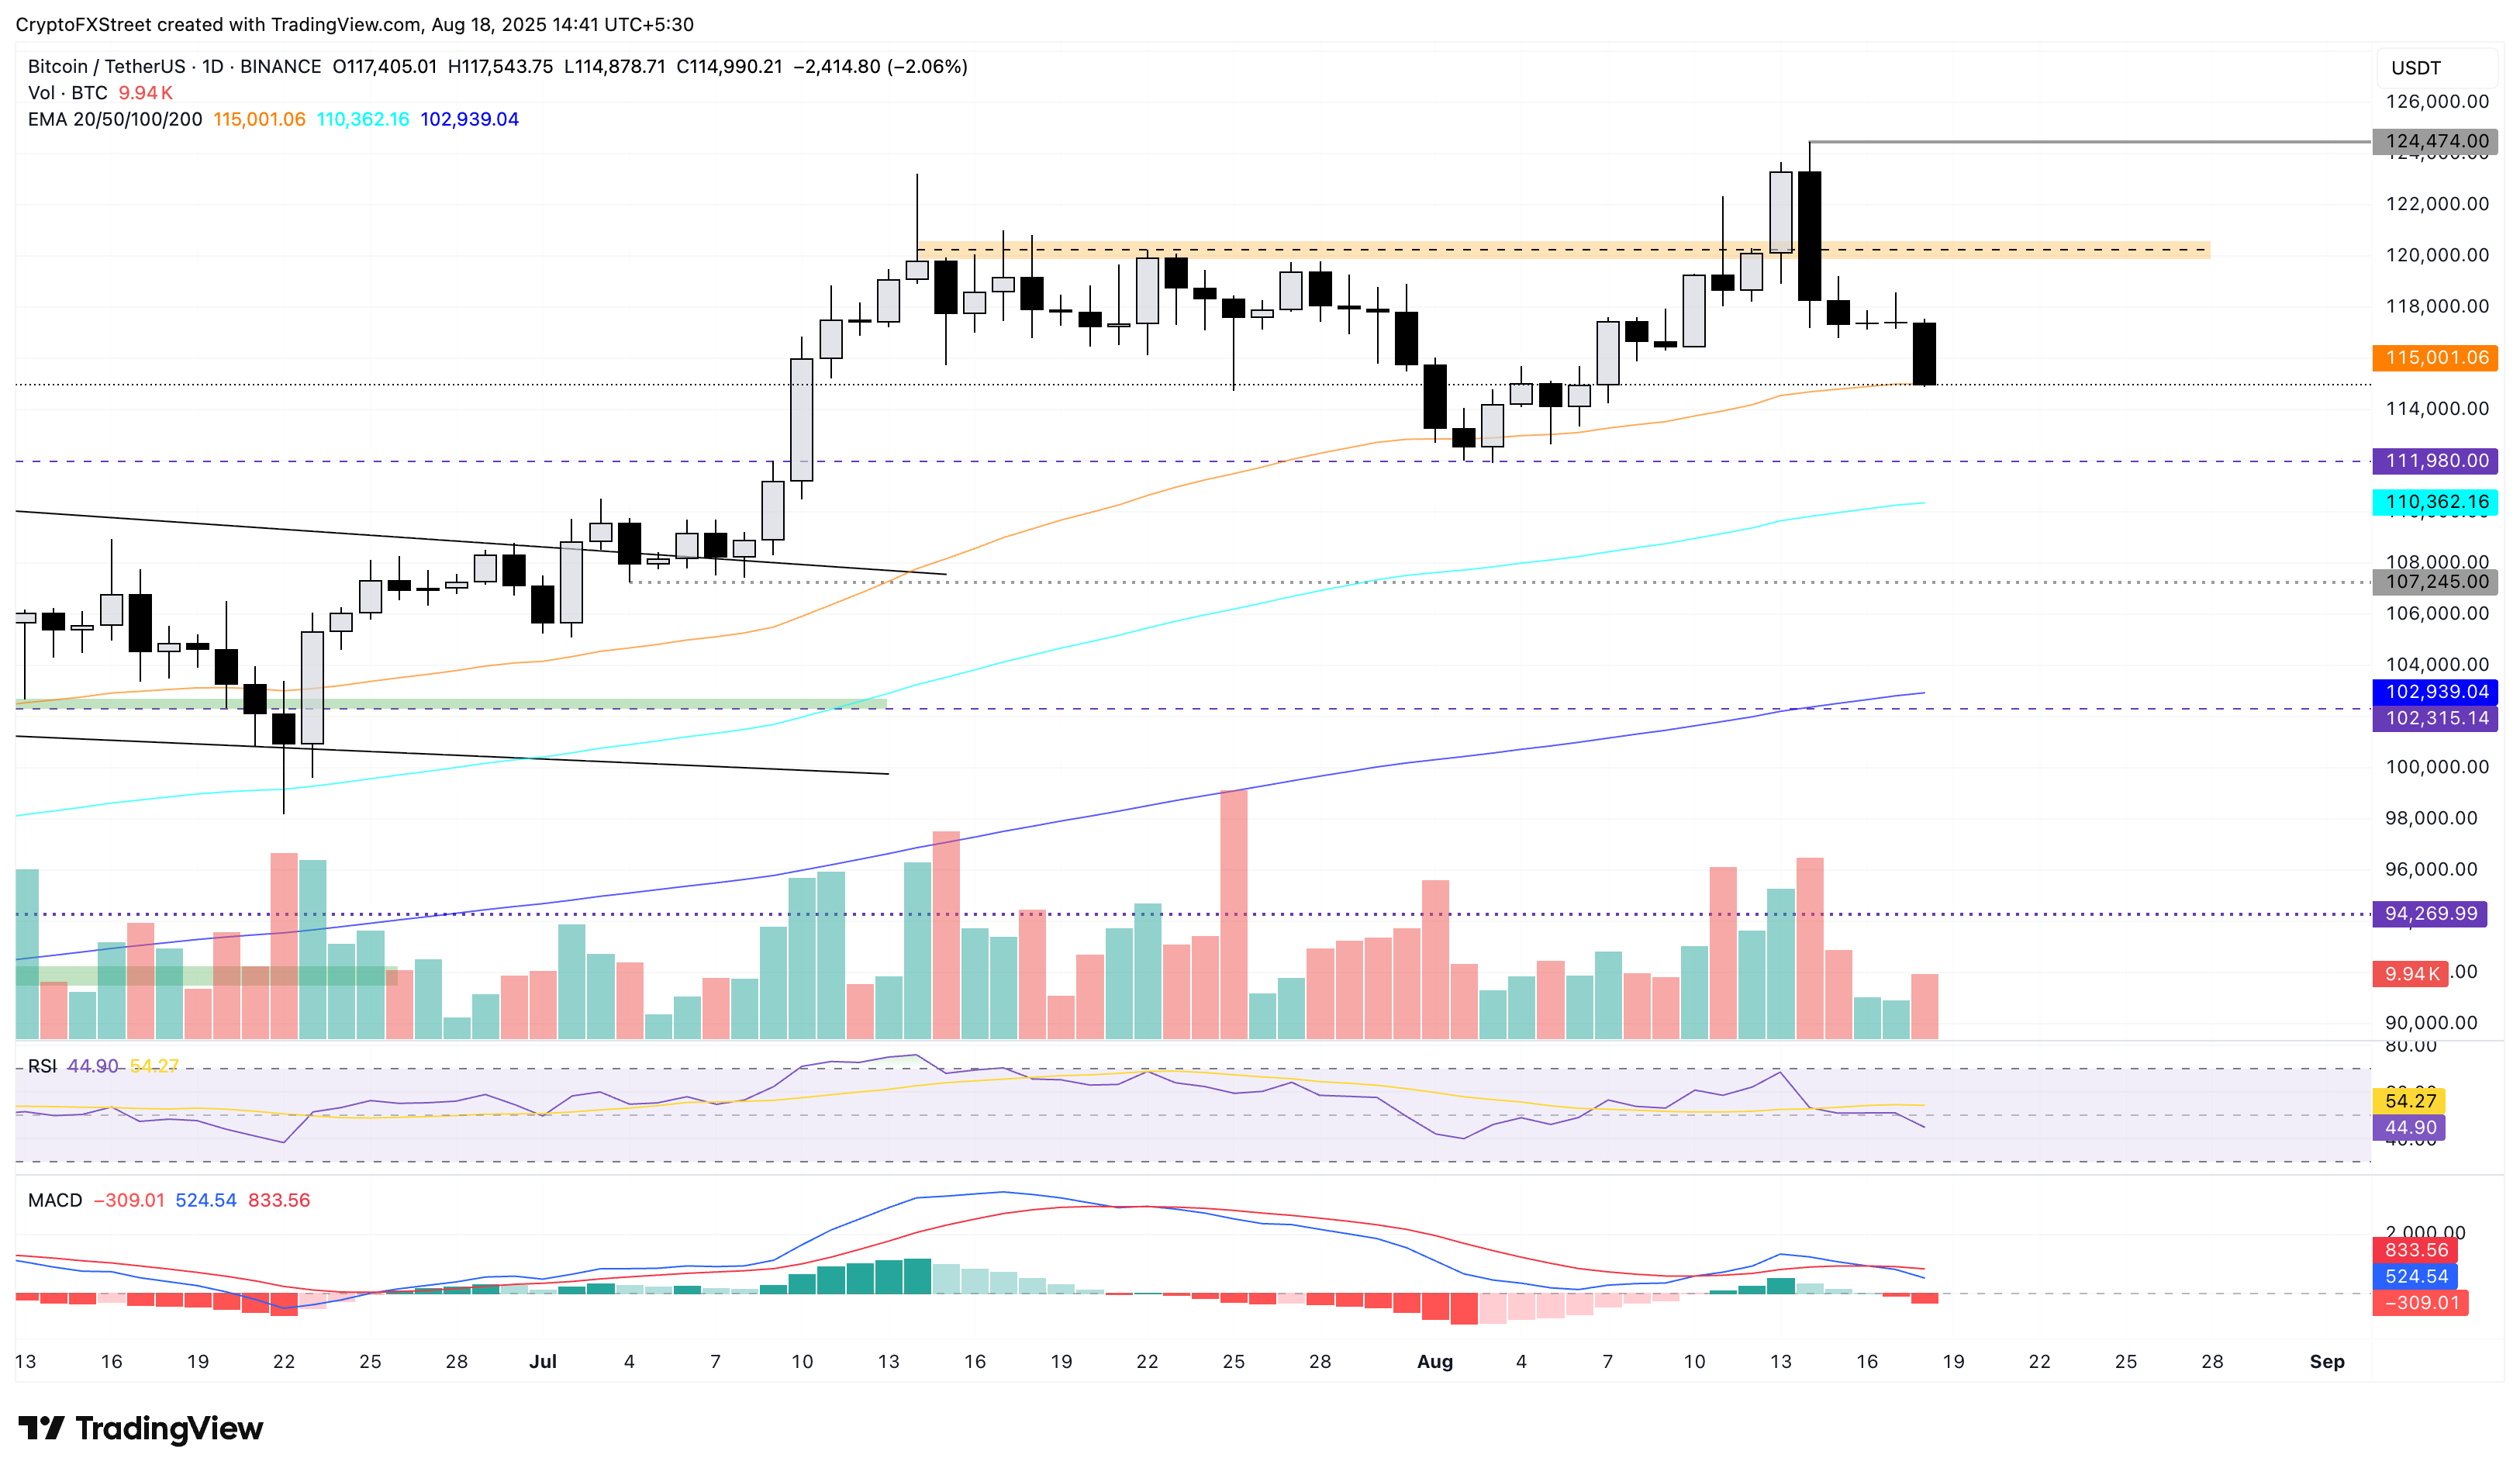
BTC/USDT daily price chart.
Looking up, a bounce back from the 50-day EMA at $115,001 could target the $120,000 supply zone.
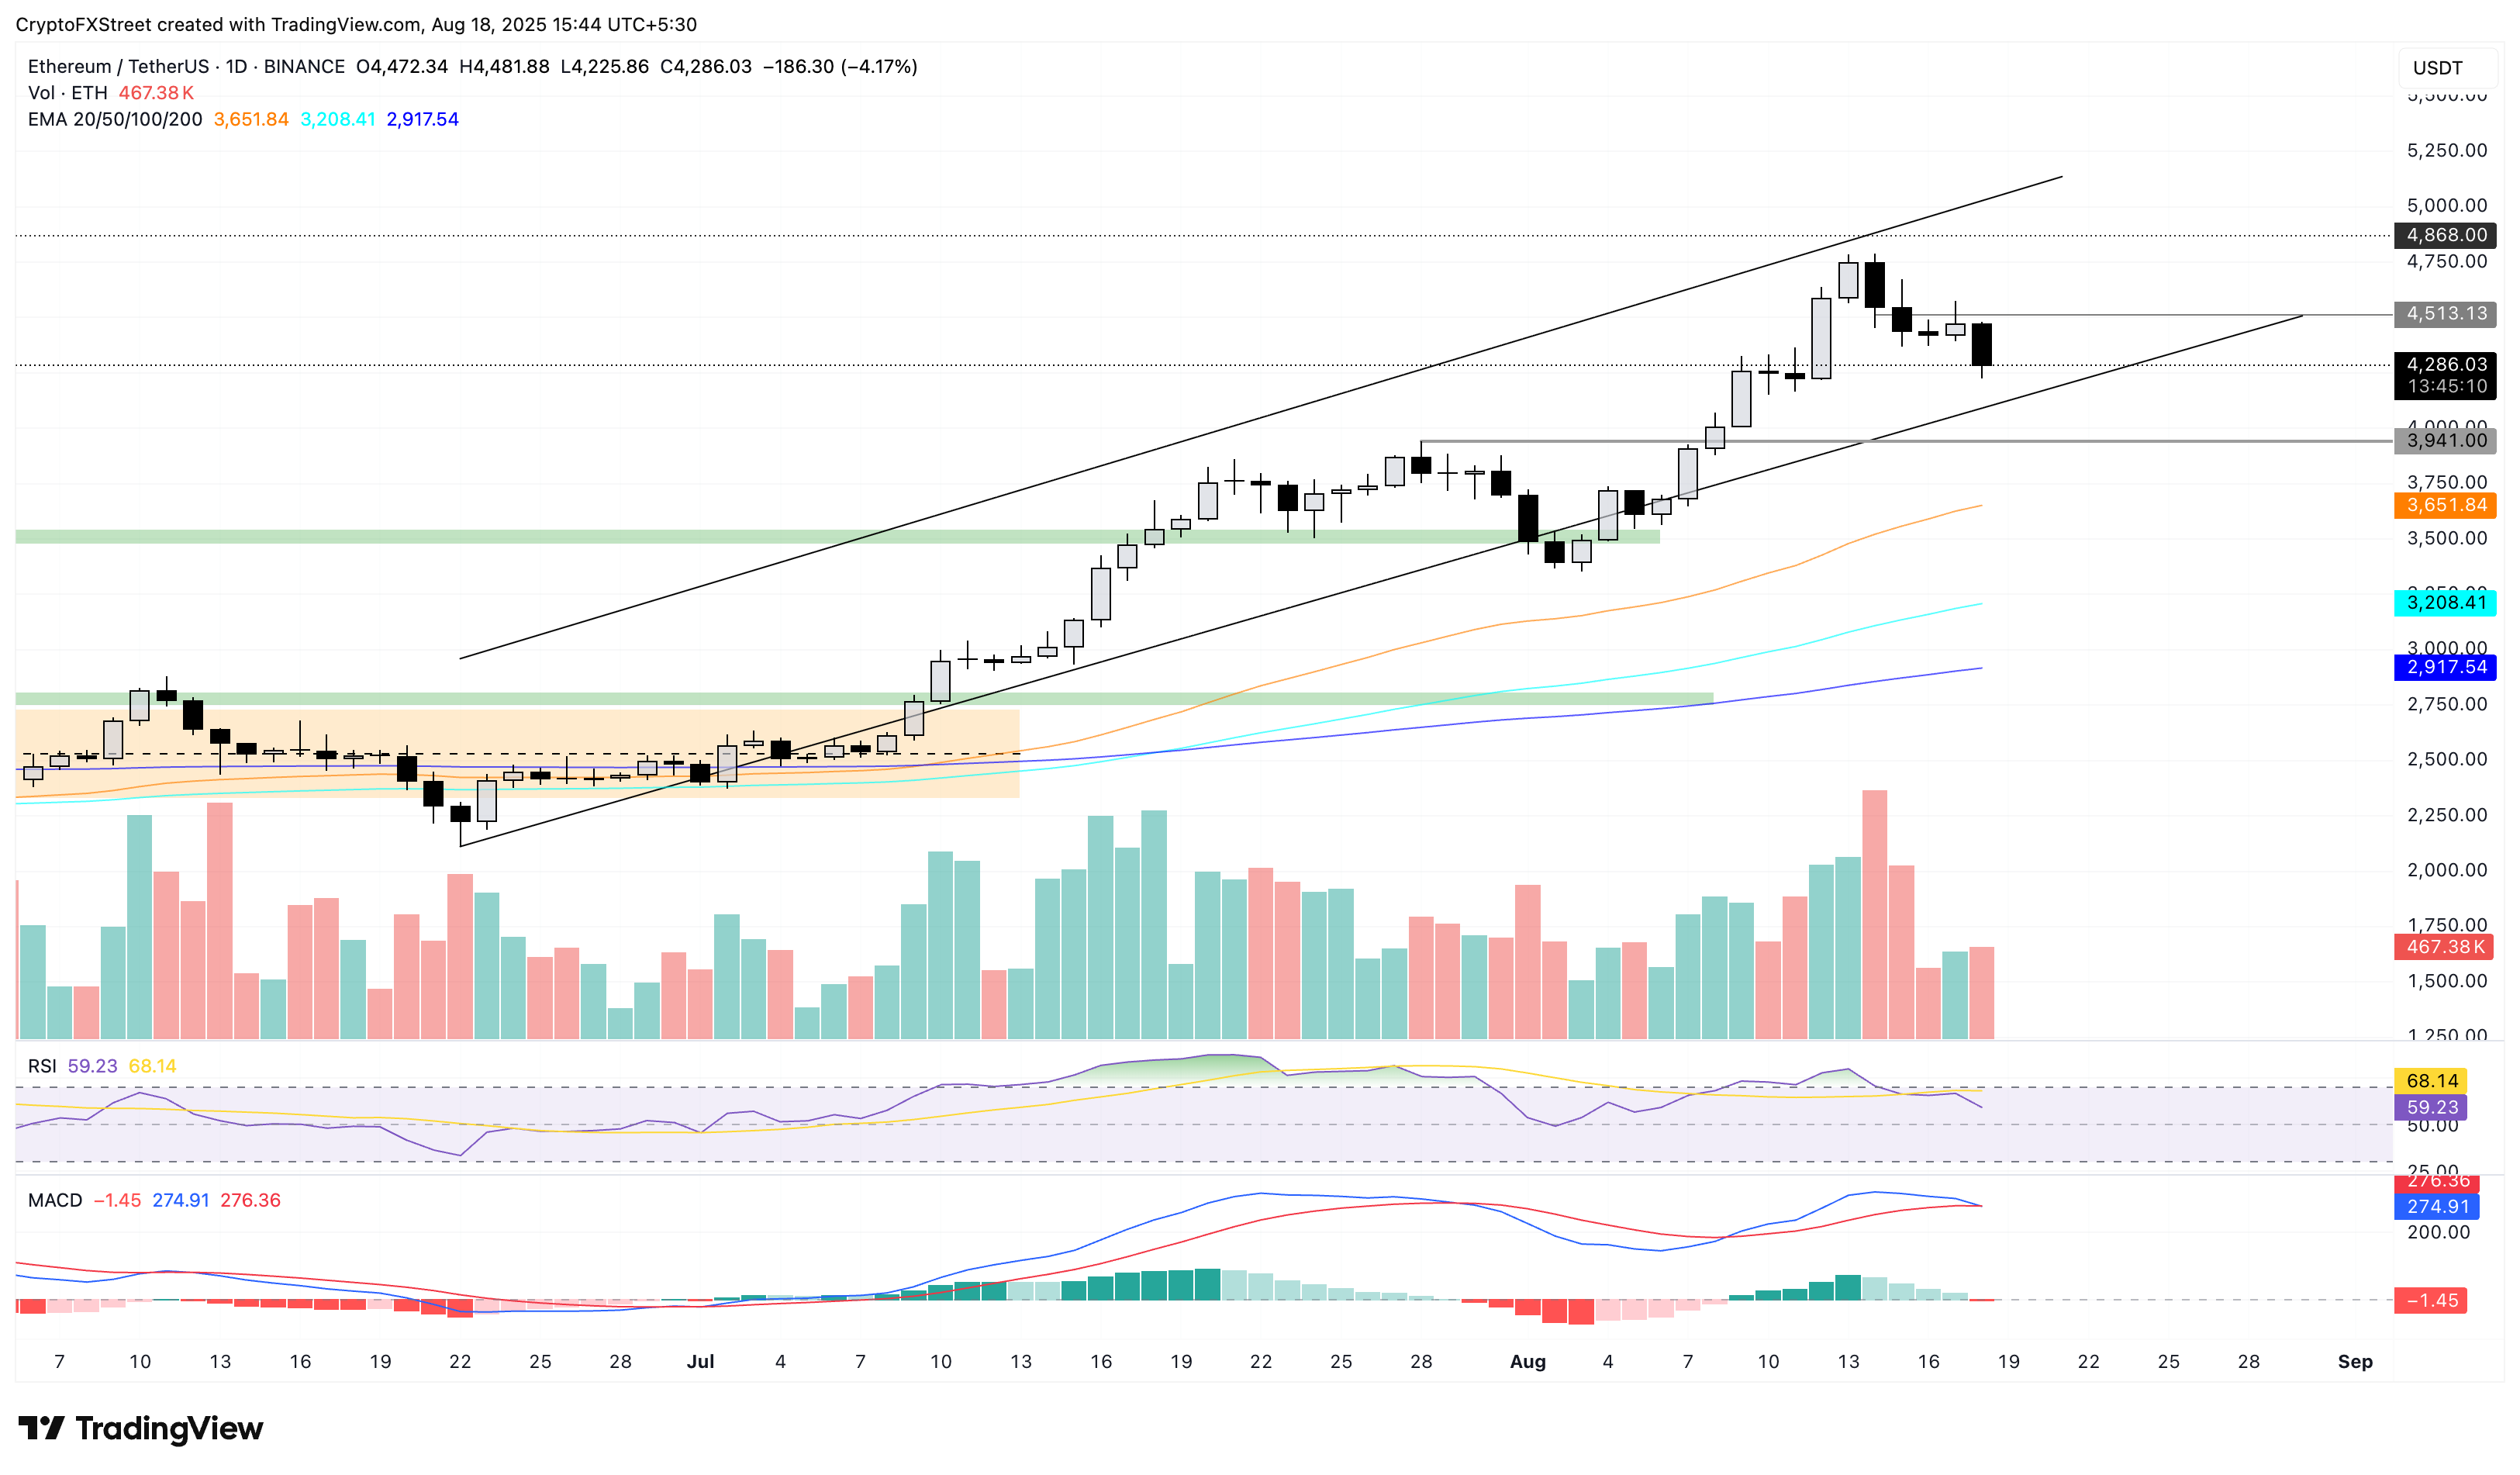
Ethereum declines within a channel, targeting $4,000
Ethereum bulls fail to hold over $4,300 as the altcoin depreciates by over 4% at the time of writing on Monday. The altcoin falls towards the support trendline of a rising channel on the daily chart (shared below) after reversing from the previous week’s high at $4,868.
Amid the sell-off, ETH targets the $3,941 level, marked by the high of July 28, which coincides with the lower boundary of the rising channel.
The MACD approaches its signal line, hinting at a potential trend reversal, as declining green histograms suggest that bullish momentum is fading. Additionally, the RSI reads 58 on the daily chart, dropping below the overbought zone and indicating a sharp decline in buying pressure.
ETH/USDT daily price chart.
On the other hand, an intraday reversal securing a positive close for the day could test the $4,500 psychological resistance.
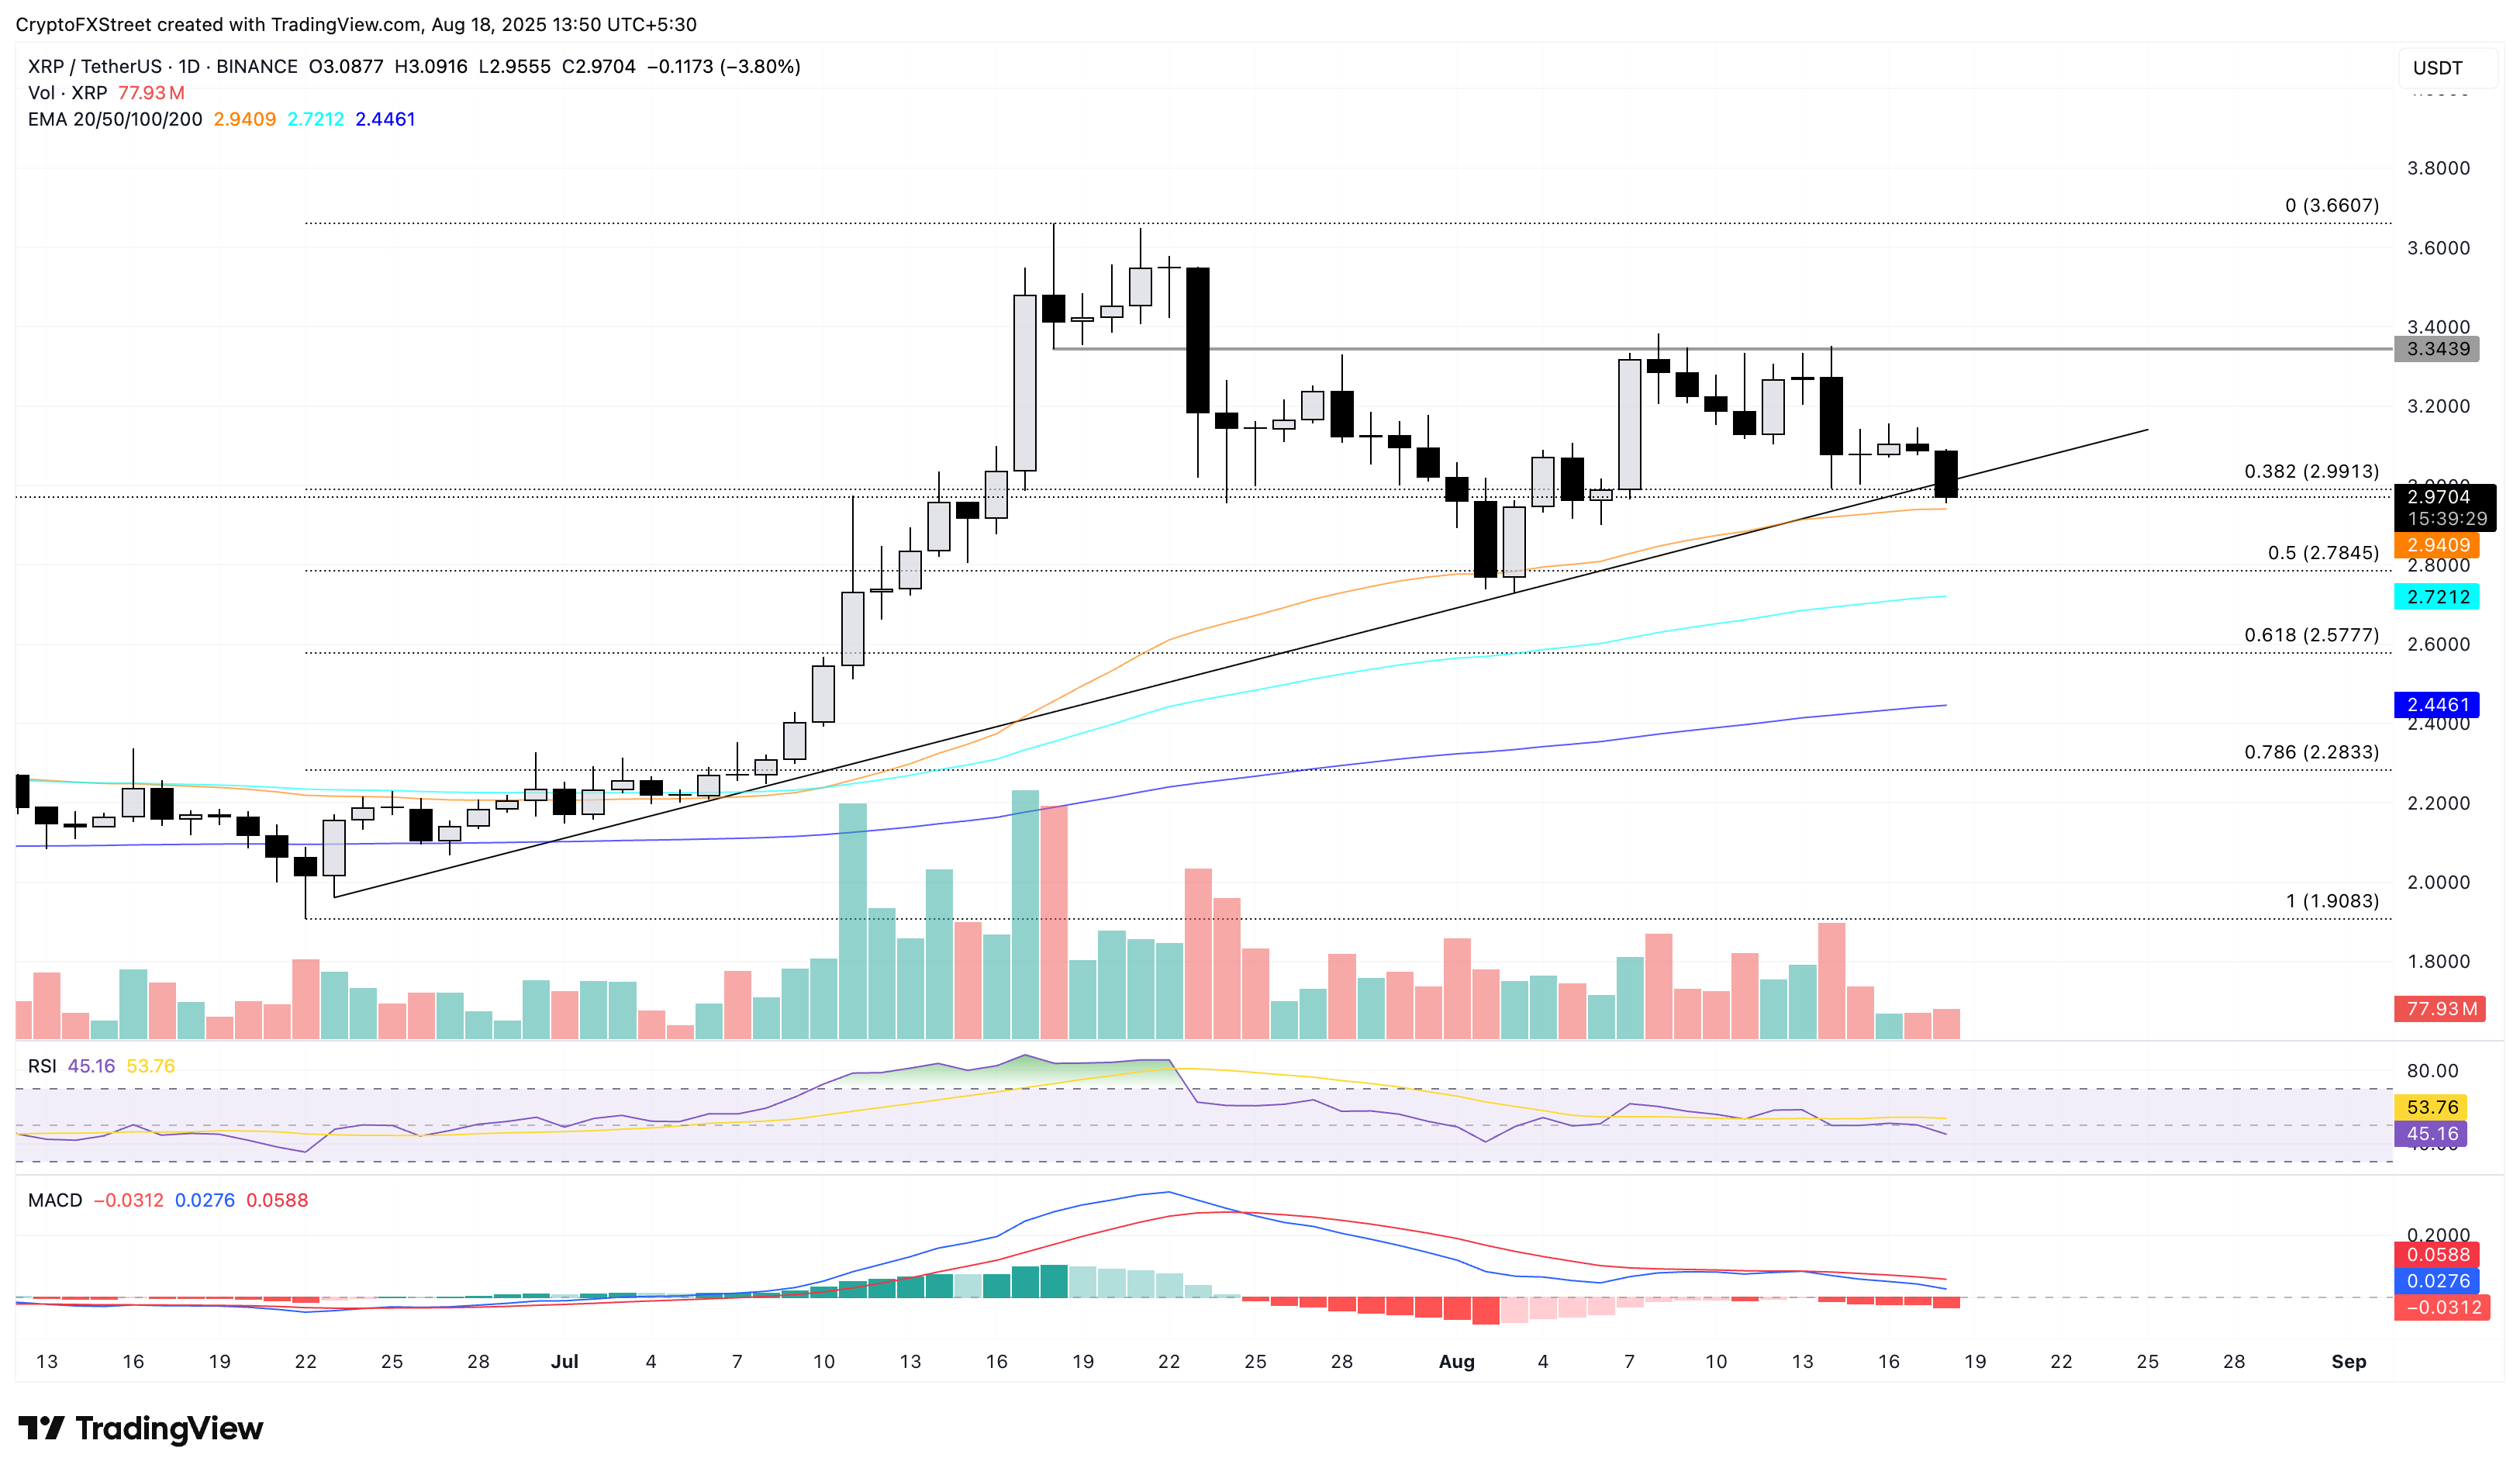
XRP’s trendline breakdown risks further losses
Ripple drops below the $3.00 mark, trading at $2.97 at press time on Monday with a loss of 3.8%. XRP’s pullback puts a long-standing resistance trendline formed by connecting the June 23 and August 3 lows, and the 50-day EMA at $2.94 to test.
The cross-border remittance token also tests the 38.2% Fibonacci level at $2.99, which is drawn from the low of $1.90 on June 22 to the high of $3.66 on July 18. A decisive close below the 50-day EMA could test the 50% retracement level $2.78.
The momentum indicators hold a bearish bias as the RSI at 45 leans below the halfway line, indicating a tired-out buying pressure. Additionally, the MACD and its signal extend the declining trend, pointing to increased bearish momentum.
XRP/USDT daily price chart.
On the flip side, if XRP holds above the support trendline at $3.00, a bounce back could retest the $3.34 resistance, last tested on Thursday.
Bitcoin, altcoins, stablecoins FAQs
What is Bitcoin?
Bitcoin is the largest cryptocurrency by market capitalization, a VIRTUAL currency designed to serve as money. This form of payment cannot be controlled by any one person, group, or entity, which eliminates the need for third-party participation during financial transactions.
What are altcoins?
Altcoins are any cryptocurrency apart from Bitcoin, but some also regard Ethereum as a non-altcoin because it is from these two cryptocurrencies that forking happens. If this is true, then Litecoin is the first altcoin, forked from the Bitcoin protocol and, therefore, an “improved” version of it.
What are stablecoins?
Stablecoins are cryptocurrencies designed to have a stable price, with their value backed by a reserve of the asset it represents. To achieve this, the value of any one stablecoin is pegged to a commodity or financial instrument, such as the US Dollar (USD), with its supply regulated by an algorithm or demand. The main goal of stablecoins is to provide an on/off-ramp for investors willing to trade and invest in cryptocurrencies. Stablecoins also allow investors to store value since cryptocurrencies, in general, are subject to volatility.
What is Bitcoin Dominance?
Bitcoin dominance is the ratio of Bitcoin's market capitalization to the total market capitalization of all cryptocurrencies combined. It provides a clear picture of Bitcoin’s interest among investors. A high BTC dominance typically happens before and during a bull run, in which investors resort to investing in relatively stable and high market capitalization cryptocurrency like Bitcoin. A drop in BTC dominance usually means that investors are moving their capital and/or profits to altcoins in a quest for higher returns, which usually triggers an explosion of altcoin rallies.
