Ripple Price Forecast: XRP Tumbles as US Economic Data Sparks Market Jitters

XRP takes a hit—just when you thought the Fed couldn't ruin another Wednesday.
Blood in the crypto water
Ripple's token slides alongside traditional markets after dismal US retail figures. Turns out inflation isn't the only party pooper—weak consumer spending's crashing the blockchain fiesta too.
The institutional shrug
While retail traders panic-sell, whales keep accumulating. Classic Wall Street playbook: buy when there's fear, sell when there's... more fear. Some things never change—whether you're trading stocks or magic internet money.
XRP's latest dip proves even 'decentralized' assets can't escape macroeconomic gravity. But hey—at least the SEC's not punching Ripple this week. Progress?
XRP uptrend falters as US PPI rises in July
The US Producer Price Index (PPI) data released by the Bureau of Labor Statistics (BLS) on Thursday showed that wholesale prices of goods and services were up 0.9% on a monthly basis in July and 3.3% on an annual basis. Thursday’s PPI figures significantly exceeded economists’ expectations that wholesale prices WOULD rise 0.2% in July and 2.5% annually.
Excluding food and energy, Core PPI increased 0.9%, accelerating the annual rate to 3.7%, its highest level since March.
The uptick in the PPI index suggests that inflation is gradually escalating in the US, with consumers likely to feel the pinch in the coming months. PPI data is used as a potential bellwether for the prices consumers may face in the NEAR future.
Investors in risk assets, including crypto, are on edge, concerned about the impact of higher prices of goods and services, which could drive inflation and further delay potential Federal Reserve (Fed) rate cuts, largely expected to begin in September.
Bitcoin (BTC) price led the correction after peaking at the new all-time high of $124,474 earlier in the day. ethereum (ETH) has trimmed part of the gains and tested support at $4,500 before reversing the trend slightly above $4,600.
XRP offers bearish signals in the daily timeframe amid a significant increase in liquidations. According to CoinGlass data, a total of $62 million has been wiped out over the past 24 hours, with long position traders bearing the biggest brunt. Approximately $57 million worth of long positions have been liquidated compared to about $5 million in shorts.
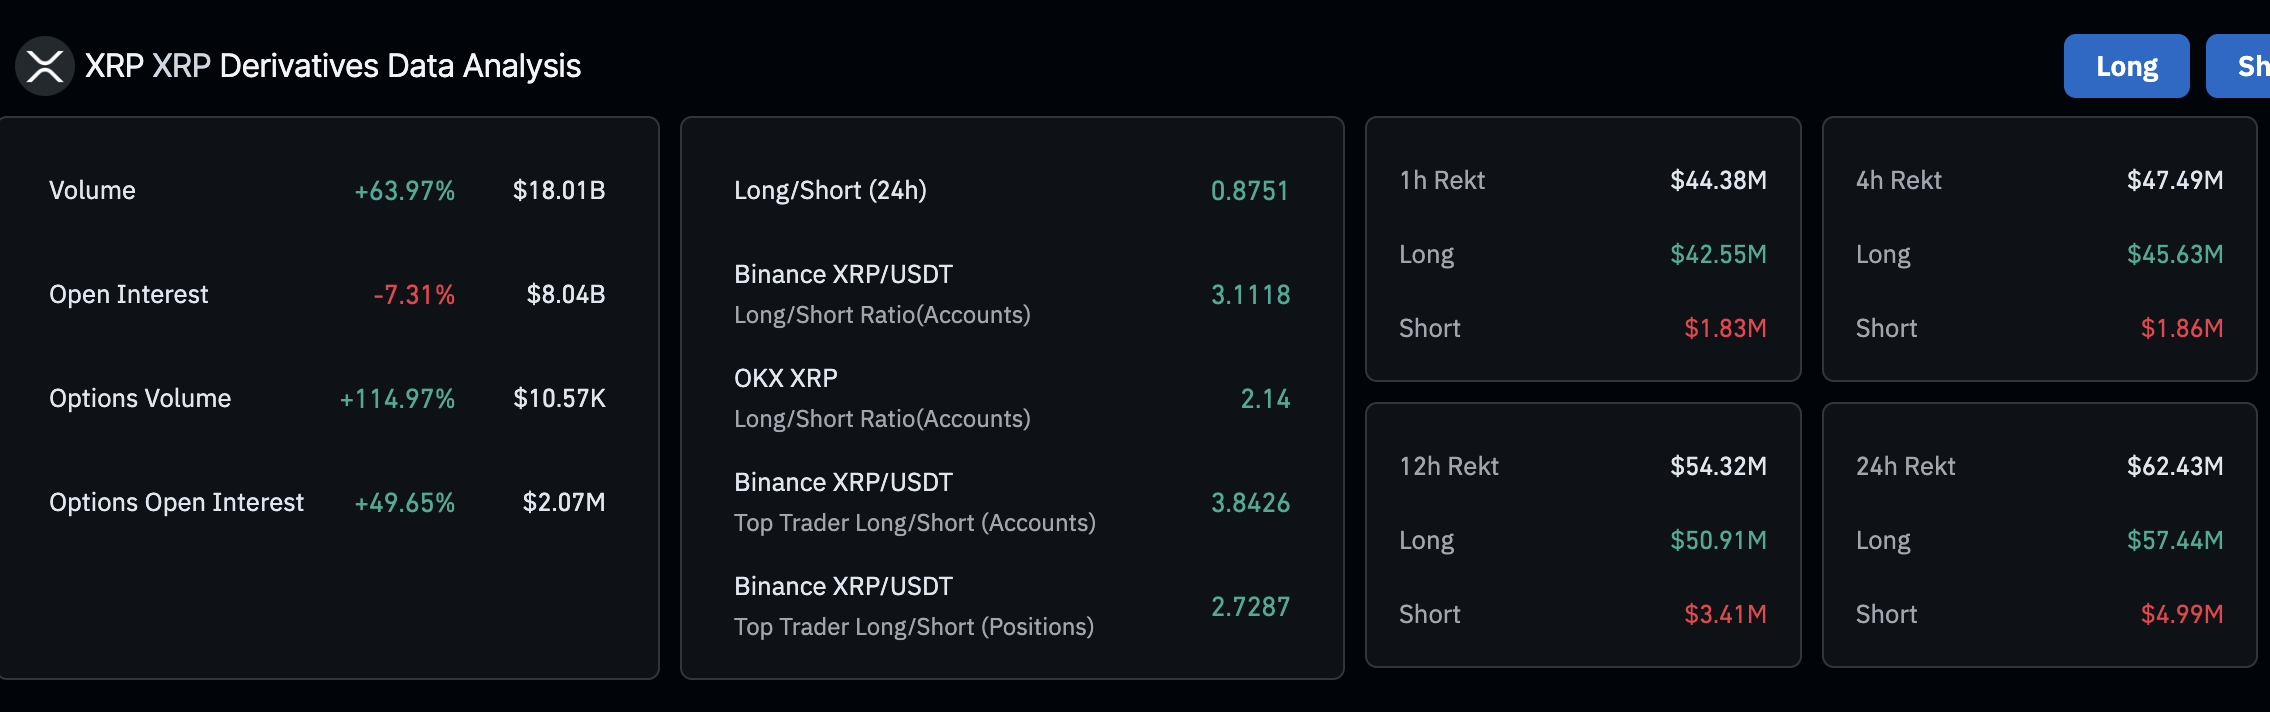
XRP derivatives market liquidations data | Source: CoinGlass
The surge in liquidations could lead to a short squeeze as traders buy XRP to cover long positions. Should the short-term support at $3.00 hold, interest in buying the dip may ramp up demand, driving the price of XRP higher.
Technical outlook: Can XRP bulls renew the uptrend?
XRP is trading above support $3.00 following the brief US economic data-driven sell-off. The downward-trending Relative Strength Index (RSI) underscores the slump in buying pressure. Suppose the RSI extends the decline below the midline. In that case, the path of least resistance will remain downward, increasing the chances of XRP sliding to test support provided by the 50-day Exponential Moving Average (EMA) at $2.92.
A sell signal maintained by the Moving Average Convergence Divergence (MACD) indicator since July 24 backs the bearish bias. Investors will consider reducing exposure as long as the MACD line in blue stays below the red signal line. The red histogram bars below the zero line indicate bearish momentum is building.
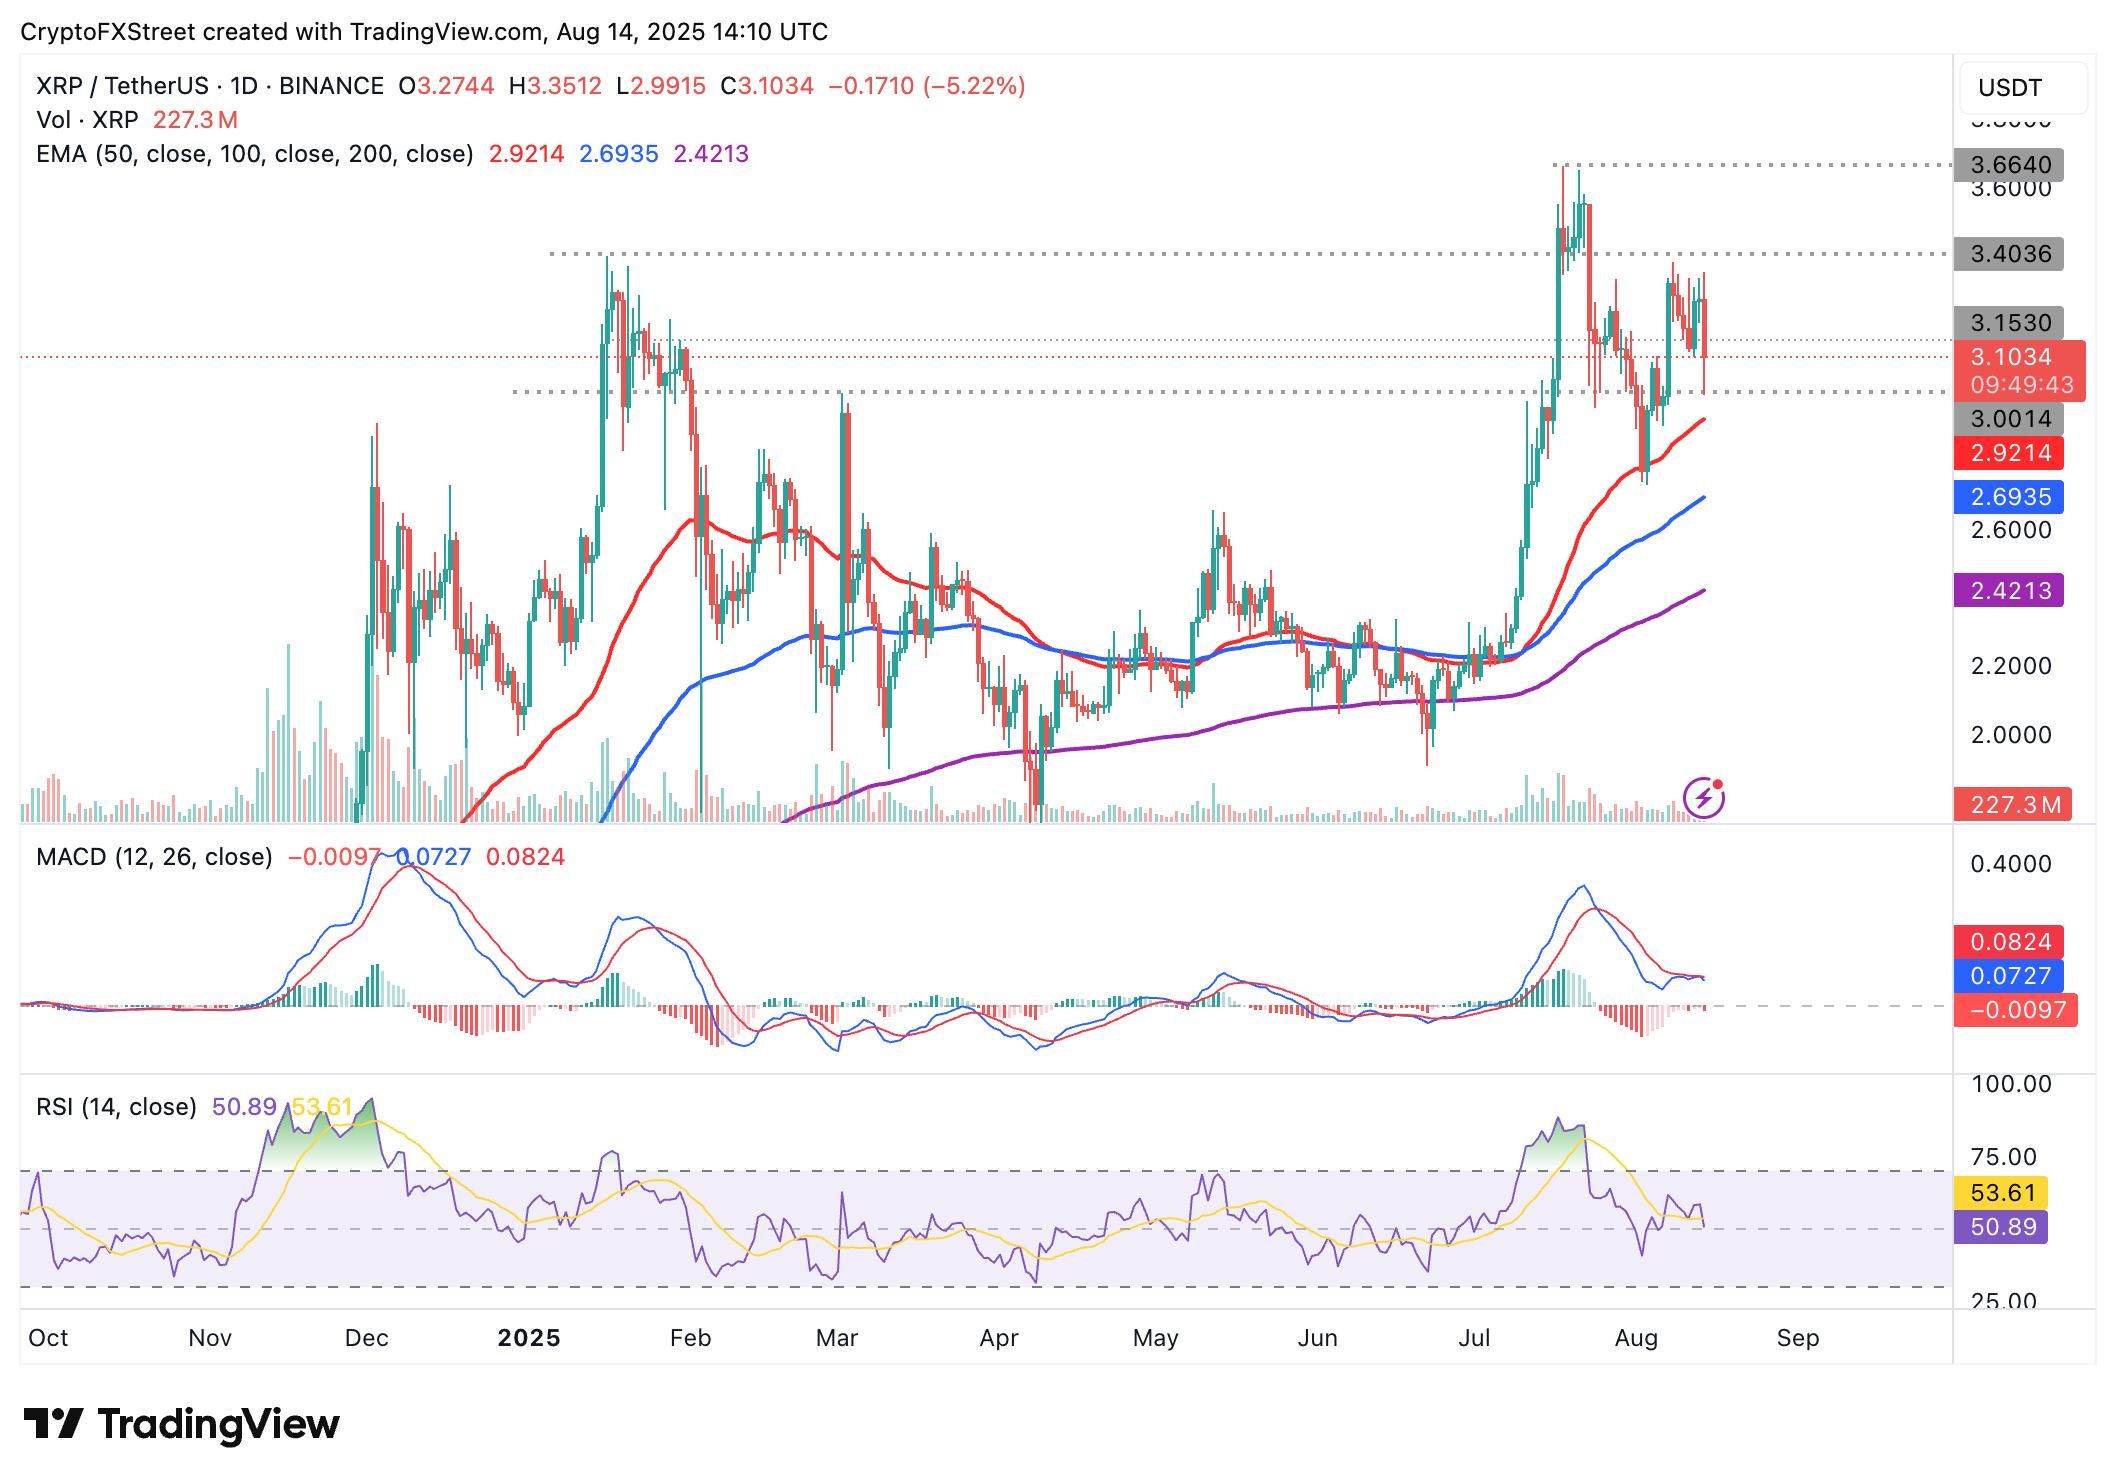
XRP/USDT daily chart
Still, key moving averages, including the 50-day EMA at $2.92, the 100-day EMA at $2.69 and the 200-day EMA at $2.42, are upward facing, which reinforces XRP’s bullish technical structure.
These levels will also serve as tentative support if the decline accelerates below $3.00. Other key areas of interest for traders are the seller congestion at around $3.40, tested on Friday and the record high of $3.66 reached on July 18.
Cryptocurrency prices FAQs
How do new token launches or listings affect cryptocurrency prices?
Token launches influence demand and adoption among market participants. Listings on crypto exchanges deepen the liquidity for an asset and add new participants to an asset’s network. This is typically bullish for a digital asset.
How do hacks affect cryptocurrency prices?
A hack is an event in which an attacker captures a large volume of the asset from a DeFi bridge or hot wallet of an exchange or any other crypto platform via exploits, bugs or other methods. The exploiter then transfers these tokens out of the exchange platforms to ultimately sell or swap the assets for other cryptocurrencies or stablecoins. Such events often involve an en masse panic triggering a sell-off in the affected assets.
How do macroeconomic releases and events affect cryptocurrency prices?
Macroeconomic events like the US Federal Reserve’s decision on interest rates influence crypto assets mainly through the direct impact they have on the US Dollar. An increase in interest rate typically negatively influences Bitcoin and altcoin prices, and vice versa. If the US Dollar index declines, risk assets and associated leverage for trading gets cheaper, in turn driving crypto prices higher.
How do major crypto upgrades like halvings, hard forks affect cryptocurrency prices?
Halvings are typically considered bullish events as they slash the block reward in half for miners, constricting the supply of the asset. At consistent demand if the supply reduces, the asset’s price climbs.
