Bonk Price Surge Ahead? BONK Defies Odds as Meme Coin Holds Critical Cup and Handle Support

Meme coin BONK isn’t just barking—it’s biting back. After weeks of volatility, the Solana-based token clings to a make-or-break technical pattern, hinting at a potential breakout.
The Setup: Cup and Handle or Last Gasp?
Traders are eyeing the neckline of BONK’s cup-and-handle formation—a classic bullish signal. Hold here, and the next leg up could ignite. Fail, and it’s back to meme coin purgatory.
Why This Matters
Unlike the usual vaporware promises flooding crypto, BONK’s price action shows actual trader conviction (or reckless gambling—take your pick). The token’s ability to defend key support suggests whales might be accumulating before the next hype cycle.
The Bottom Line
In a market where ‘fundamentals’ often mean Elon’s latest tweet, BONK’s technical resilience stands out. But let’s be real—this is crypto. Today’s chart masterpiece is tomorrow’s rug pull. Trade accordingly.
Bonk declines amid suppressed open interest
Bonk's derivatives market is on the back foot, characterised by the futures Open Interest (OI) shrinking to $38 million after peaking at approximately $73 million in July when the price hit a seven-month high of $0.00004074.
The persistent decline in OI, which refers to the notional value of outstanding futures or options contracts, implies low sentiment and interest in the Solana-based meme coin.
Still, with the futures-weighted sentiment remaining positive around 0.0101%, traders are increasingly leveraging long positions in BONK.
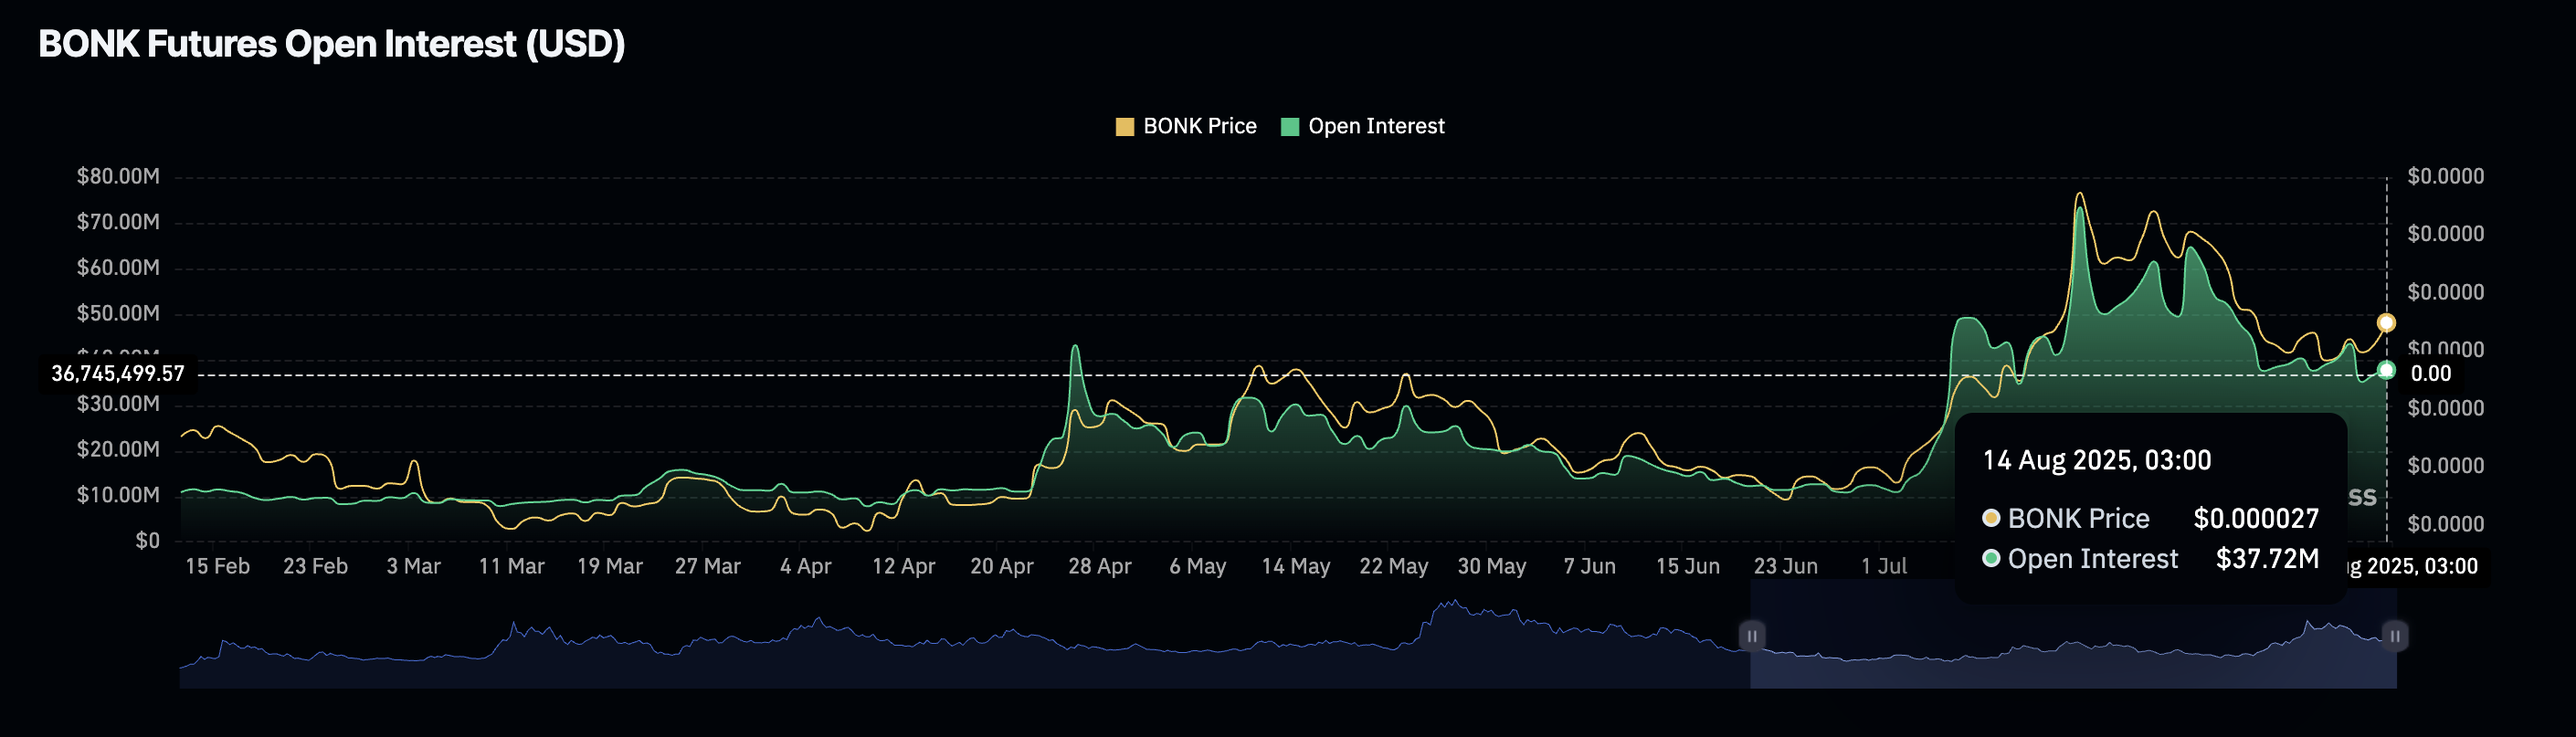
Bonk Futures Open Interest | Source: CoinGlass
Technical outlook: Bonk holds above key support
Bonk price upholds support at $0.00002563 provided by the 50-day Exponential Moving Average (EMA) as well as the Cup and Handle pattern's neckline resistance-turned-support at around $0.00002500.
The meme coin also sits significantly above the 100-day EMA at $0.00002306 and the 200-day EMA at $0.00002174, backing its subtle bullish picture. These levels will serve as tentative support if the decline extends below the neckline support.
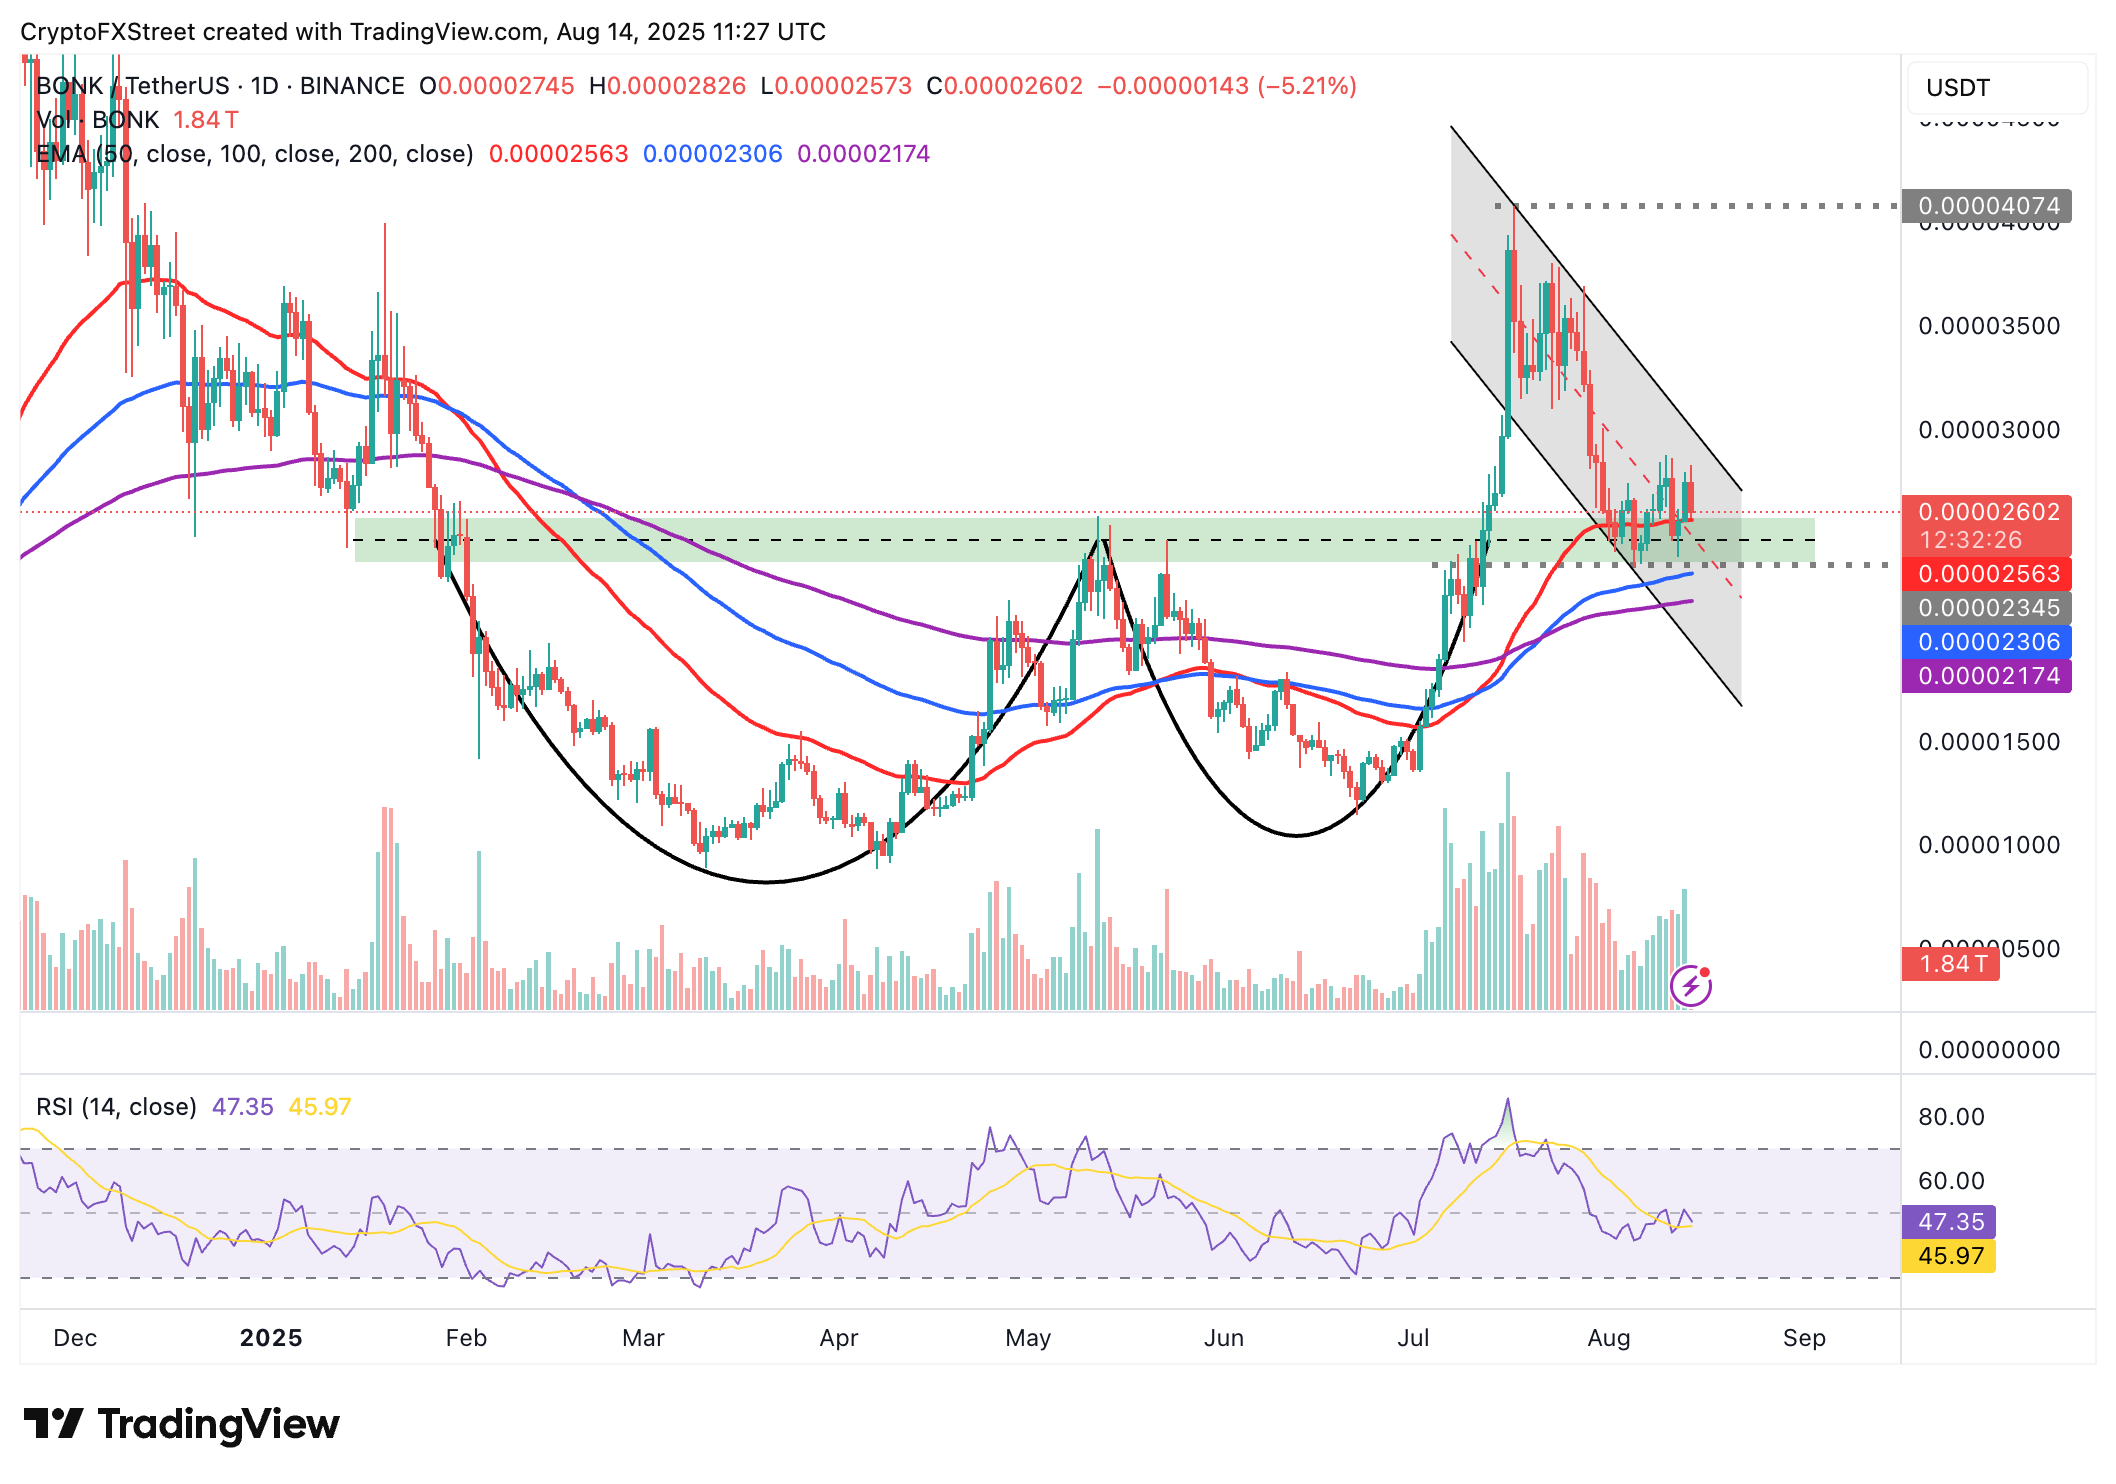
BONK/USDT daily chart
Two outcomes will likely follow Bonk's testing of the neckline support: A bullish breakout aiming for the July peak of $0.00004074 and the extension of the down leg if the same support level gives way.
Traders should also focus on the Relative Strength Index (RSI), which continues to decline below the midline, indicating a reduction in buying pressure.
Open Interest, funding rate FAQs
How does Open Interest affect cryptocurrency prices?
Higher Open Interest is associated with higher liquidity and new capital inflow to the market. This is considered the equivalent of increase in efficiency and the ongoing trend continues. When Open Interest decreases, it is considered a sign of liquidation in the market, investors are leaving and the overall demand for an asset is on a decline, fueling a bearish sentiment among investors.
How does Funding rates affect cryptocurrency prices?
Funding fees bridge the difference between spot prices and prices of futures contracts of an asset by increasing liquidation risks faced by traders. A consistently high and positive funding rate implies there is a bullish sentiment among market participants and there is an expectation of a price hike. A consistently negative funding rate for an asset implies a bearish sentiment, indicating that traders expect the cryptocurrency’s price to fall and a bearish trend reversal is likely to occur.
