🚀 Bitcoin Cash Soars to New Yearly High as BTC Shatters All-Time Records

Bitcoin Cash (BCH) just punched through its highest price in 12 months—riding the coattails of Bitcoin's historic rally. Meanwhile, BTC isn’t just breaking ceilings—it’s vaporizing them.
The BCH Surge: More Than Just a Sidekick Act?
While Bitcoin dominates headlines, BCH quietly notched a yearly peak. No fluke—this altcoin’s uptick mirrors renewed interest in scalable payment solutions (and maybe a little FOMO).
BTC’s Ruthless Rally
Bitcoin didn’t just hit an ATH—it treated resistance levels like speed bumps. Traders are either cheering or frantically recalculating their "short at the top" strategies (spoiler: that hasn’t worked since 2020).
The Cynic’s Corner
Wall Street analysts remain unimpressed—"It’s just code," they mutter, while secretly recoding their portfolios to 10% crypto. Again.
Bitcoin Cash on-chain and derivatives data show bullish bias
CryptoQuant data, as shown in The Graph below, highlights buying pressure on Bitcoin Cash. The Futures Taker CVD (Cumulative Volume Delta) for BCH has flipped positive on Sunday and has been constantly increasing so far this week. This metric measures the cumulative difference between market buy and sell volumes over 3 months. When the 90-day CVD is positive and increasing, it suggests the Taker Buy Dominant Phase, while a negative and decreasing value indicates the Taker Sell Dominant Phase.
%20(2)-1755142314666-1755142314668.png)
BCH Futures Taker CVD chart. Source: CryptoQuant
Adding to this optimism, CoinGlass’ data shows that the futures OI in Bitcoin Cash at exchanges reached the highest yearly level of $683.96 million on Wednesday, levels not seen since April 10, 2024. Rising OI represents new or additional money entering the market and new buying, which could fuel the current BCH price rally.
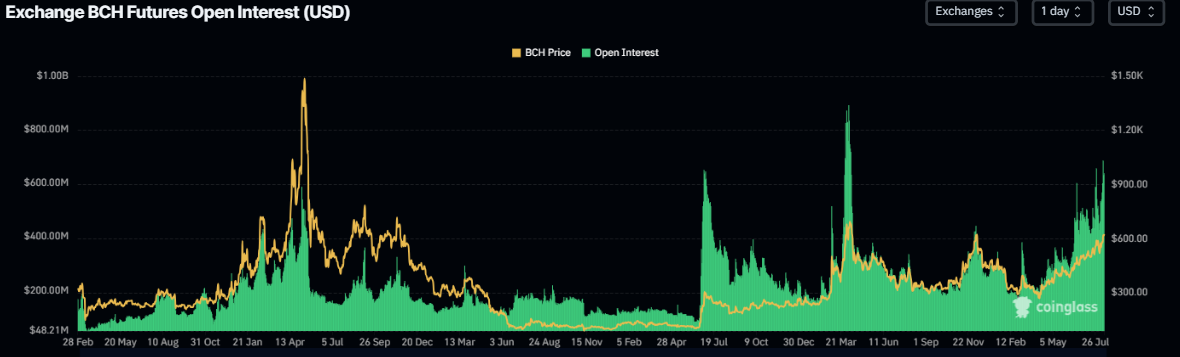
Bitcoin Cash Open Interest chart. Source: CoinGlass
Bitcoin Cash Price Forecast: Bulls aiming for levels beyond $700
Bitcoin Cash price reached a new yearly high of $634.3 on Wednesday, having rallied over 9% so far this week. At the time of writing on Thursday, it trades around $622, nearing its key resistance at $640.
If BCH continues its upward trend and closes above the $640 level on a daily basis, it could extend the gains toward its next resistance level at $719.5.
The Relative Strength Index (RSI) on the daily chart reads 64, above the neutral value of 50 and points upward, indicating bullish momentum. The Moving Average Convergence Divergence (MACD) showed a bullish crossover on Tuesday, generating buy signals and also showed rising green histogram bars above its neutral level, further supporting the bullish thesis.
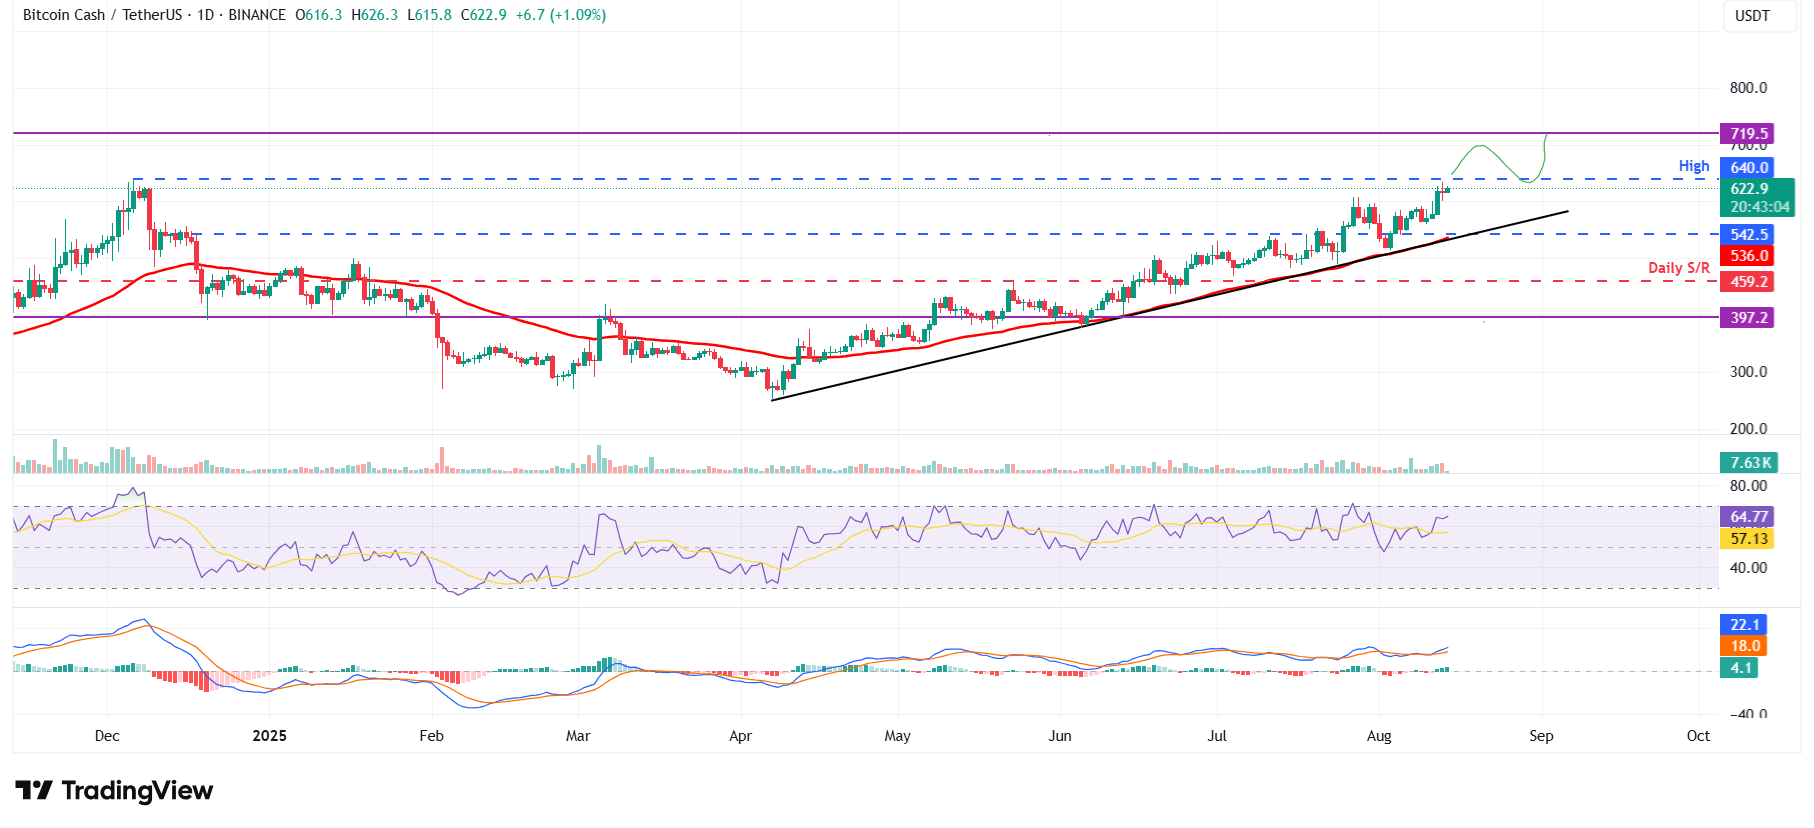
BCH/USDT daily chart
However, if BCH faces a correction, it could extend the decline to retest its daily support at $542.5.
