Pump.fun Price Outlook: PUMP Defies $12M Buyback Surge—What’s Next for the Token?

PUMP plays hard to get—even after a jaw-dropping $12 million buyback frenzy. The token’s lukewarm response has traders scratching their heads and whales recalculating their exit strategies.
Buyback bonanza? More like a temporary band-aid. Despite the heavy artillery of capital deployed, PUMP’s price action remains stubbornly muted. Classic crypto theater—where big moves meet even bigger skepticism.
Volatility alert: The market’s shrugging off the buyback like a bad NFT project. Is this a dip-buying opportunity or a trapdoor for overleveraged bulls? Only time will tell—but for now, the charts are whispering 'caution.'
Closing thought: In a world where 'tokenomics' often means 'exit liquidity,' PUMP’s latest saga fits right in. Stay sharp, stack wisely, and never trust a pump without a plan.
Pump.fun accelerates token buyback program
Pump.fun team accelerated its token buyback program with nearly $12 million worth of PUMP removed from circulation on Tuesday. According to the Decentralized Finance (DeFi) ecosystem tracking platform Dune, the single-day activity propelled the cumulative buybacks to 7.4 billion PUMP valued at $43.4 billion.
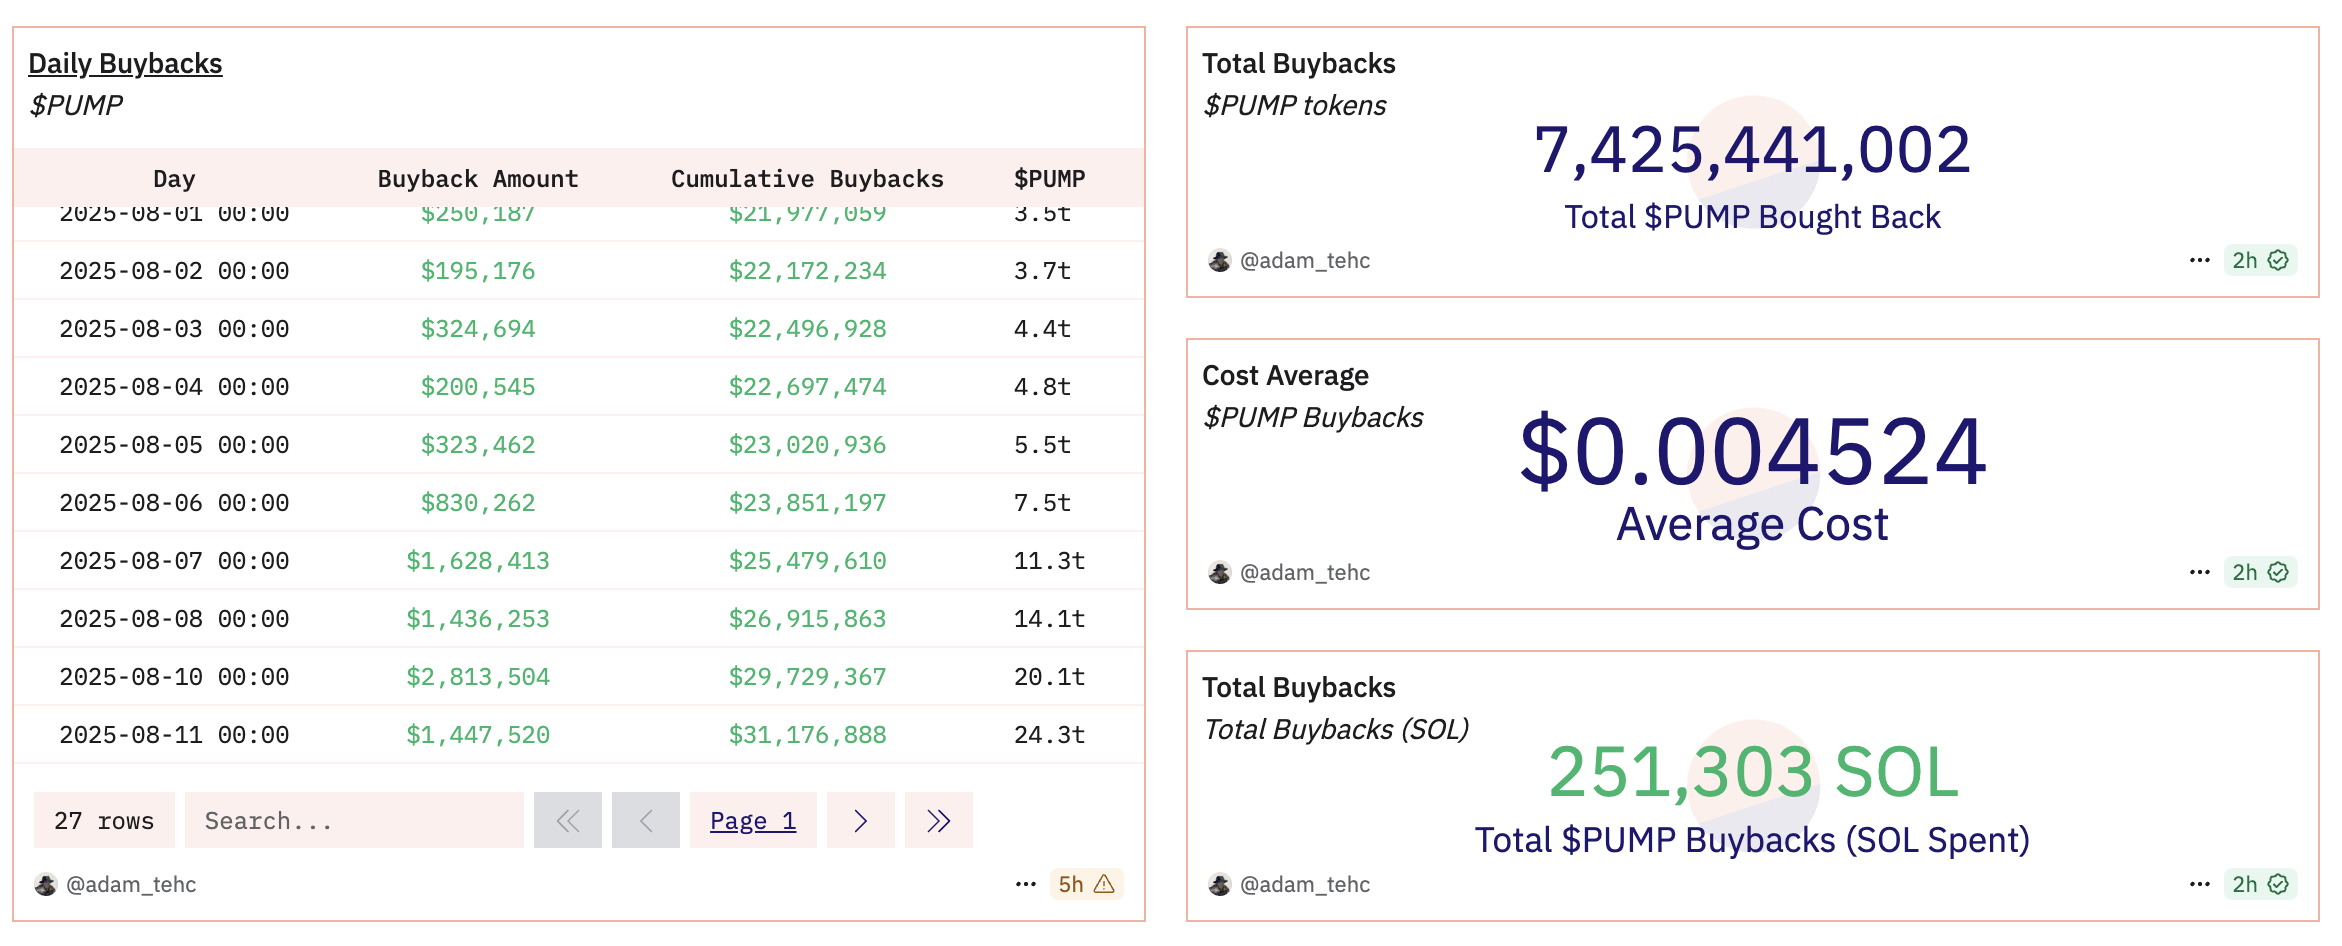
PUMP buyback stats | Source: Dune
The average cost of the buybacks is $0.0045, significantly higher than PUMP’s current market price of $0.0038. PUMP has a total supply of 1 trillion. Of this, 147.5 billion tokens were sold in the public sale, representing 14.8%.
Despite the correction in price, key metrics such as token Holder Growth are steadily rising. With over 66,000 unique wallets, speculative demand for PUMP could reinforce the bullish grip, paving the way for recovery above resistance at $0.0040.
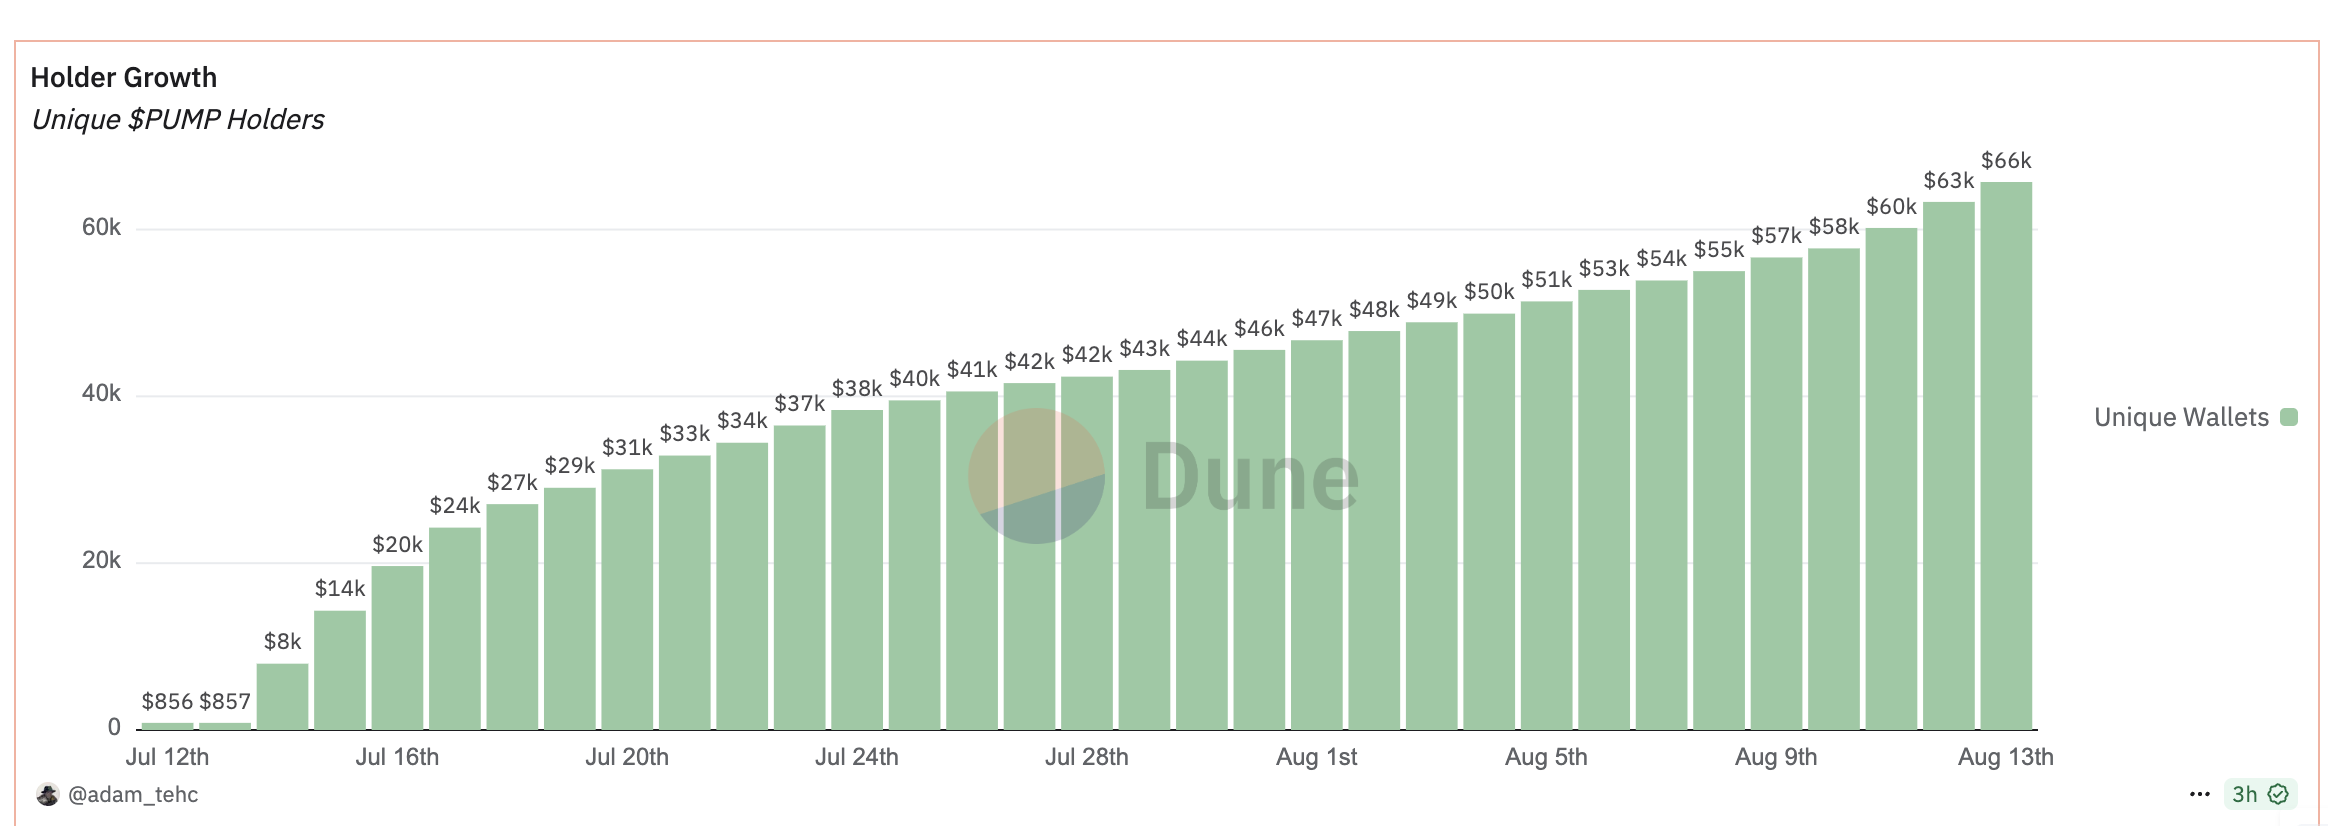
PUMP Holder Growth | Source: Dune
Technical outlook: PUMP holds key support
PUMP price shows signs of recovery after testing support at $0.0037, backed by a Golden Cross pattern that could be confirmed in upcoming sessions if speculative demand increases.
A Golden Cross is a bullish pattern that forms when a short-term moving average crosses above a long-term moving average. As observed on the 4-hour chart below, the 50-period Exponential Moving Average (EMA) is currently crossing above the 100-period EMA, indicating positive market sentiment.
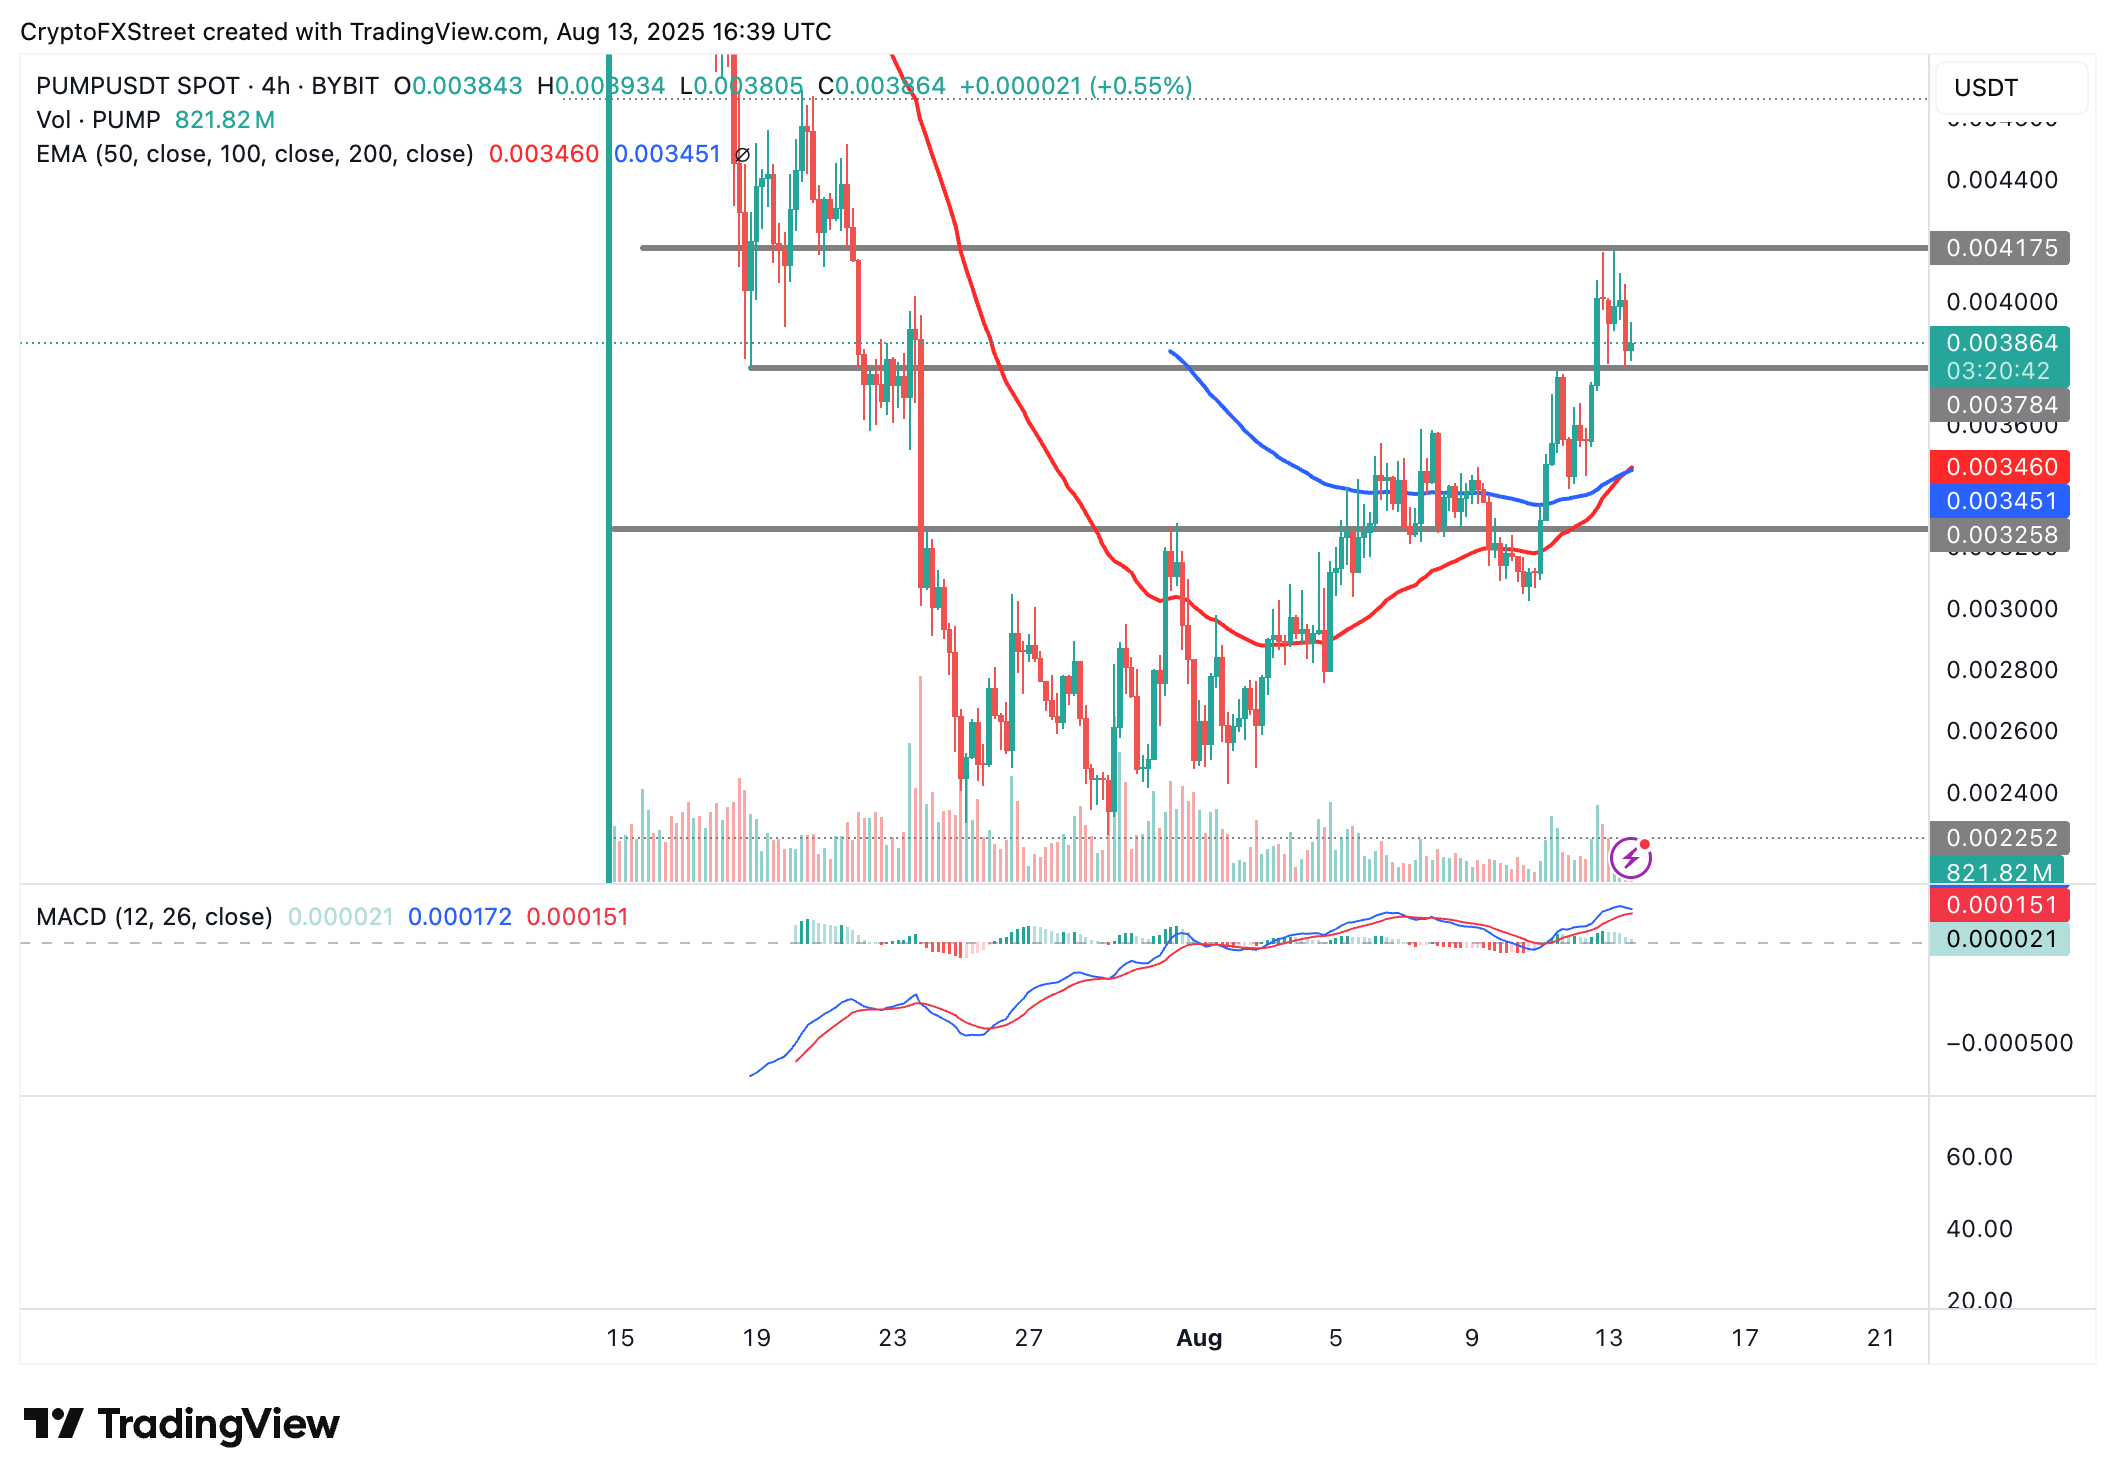
PUMP/USDT 4-hour chart
The Moving Average Convergence Divergence (MACD) indicator highlights a buy signal with the blue line holding above the red signal line.
Still, if the MACD line crosses below the red signal line as the indicator declines toward the midline, the path of least resistance could remain downward, raising the probability of PUMP dropping toward the confluence support formed by the 50-period EMA and the 200-period EMA at around $0.0034.
Cryptocurrency metrics FAQs
What is circulating supply?
The developer or creator of each cryptocurrency decides on the total number of tokens that can be minted or issued. Only a certain number of these assets can be minted by mining, staking or other mechanisms. This is defined by the algorithm of the underlying blockchain technology. On the other hand, circulating supply can also be decreased via actions such as burning tokens, or mistakenly sending assets to addresses of other incompatible blockchains.
What is market capitalization?
Market capitalization is the result of multiplying the circulating supply of a certain asset by the asset’s current market value.
What is trading volume?
Trading volume refers to the total number of tokens for a specific asset that has been transacted or exchanged between buyers and sellers within set trading hours, for example, 24 hours. It is used to gauge market sentiment, this metric combines all volumes on centralized exchanges and decentralized exchanges. Increasing trading volume often denotes the demand for a certain asset as more people are buying and selling the cryptocurrency.
What is the funding rate?
Funding rates are a concept designed to encourage traders to take positions and ensure perpetual contract prices match spot markets. It defines a mechanism by exchanges to ensure that future prices and index prices periodic payments regularly converge. When the funding rate is positive, the price of the perpetual contract is higher than the mark price. This means traders who are bullish and have opened long positions pay traders who are in short positions. On the other hand, a negative funding rate means perpetual prices are below the mark price, and hence traders with short positions pay traders who have opened long positions.
