Bitcoin at the Tipping Point: Is This the Breakout We’ve Been Waiting For?

After years of sideways action, Bitcoin is flirting with a historic breakout—but will it finally deliver?
The Bull Case: Macro Tailwinds and Institutional Adoption
With inflation fears lingering and traditional markets wobbling, crypto's poster child is seeing renewed interest from hedge funds and corporate treasuries. The 'digital gold' narrative is back in vogue.
Technical Signals Flash Green
Key resistance levels are being tested as trading volume spikes. Chartists point to a potential cup-and-handle formation—the same pattern that preceded Bitcoin's 2021 bull run.
Regulatory Wildcards Remain
While the SEC's recent ETF approvals helped, governments worldwide still can't decide whether to embrace crypto or strangle it in its crib. Typical bureaucratic indecision.
One thing's certain: Wall Street's late to the party as usual. Whether Bitcoin breaks out or crashes spectacularly, retail traders will be left holding the bag—just like always.
Uranium’s technical setup: Riding the upper bollinger band
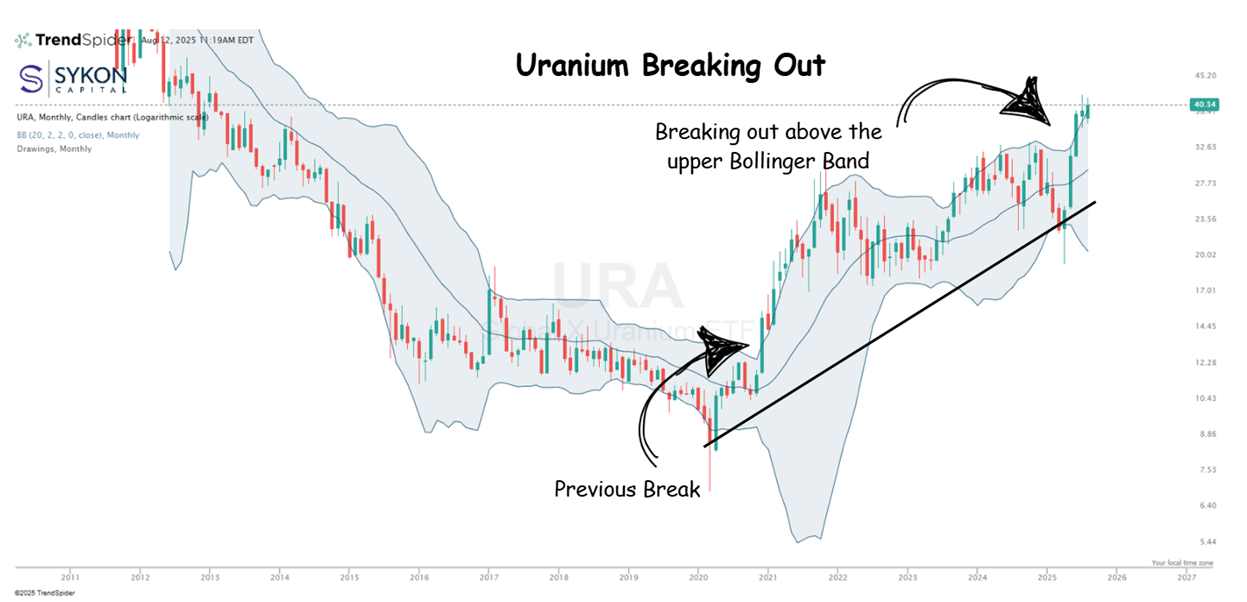
Back in June, I highlighted uranium’s breakout above the upper Bollinger Band as an early sign of sector strength. Since then, the MOVE hasn’t faded, uranium continues to ride that upper band, showing strong, persistent momentum. The Global X Uranium ETF (URA) is leading the charge, supported by recent executive actions promoting deregulation in nuclear energy and what some are calling a “nuclear renaissance.”
This setup is similar to 2020, when uranium broke above its upper band and stayed there for almost a year. Back then, URA moved from about $12 to $26 a share, marking a significant rally. Today’s move could be the start of another leg higher.
Trend continuation potential
-
Momentum: Three consecutive monthly green candles (June–August 2025), each larger than the last. Breakout cleared the 2023–2024 range with volume supporting the move.
-
Structure: A multi-year base from 2016–2020 preceded the 2020–2021 surge from $8.69 to $26.86 (209% gain). The current breakout has similar traits.
-
Bollinger Bands: Widening bands suggest the trend is strengthening, with no clear bearish divergences. Monthly candles have minimal upper wicks, signaling conviction.
Key considerations
-
Risk Management: URA’s rapid move from $25 to over $40 could prompt healthy consolidation. A monthly close below $32.50 would be the first warning sign.
-
Targets: Historical price action points to $50–$55 as a realistic upside zone if fundamentals stay supportive.
-
Long-Term: Despite the rally, URA remains well below its 2011 highs. The 2016–2020 base provides a strong foundation for further gains.
Bottom line
Uranium’s technical picture remains bullish. Riding the upper Bollinger Band like this is positive and, historically, has preceded extended rallies. While short-term pauses are likely after such a sharp move, momentum and sector fundamentals suggest the trend could carry significantly higher, as long as key support levels hold.
Can Bitcoin finally break out?
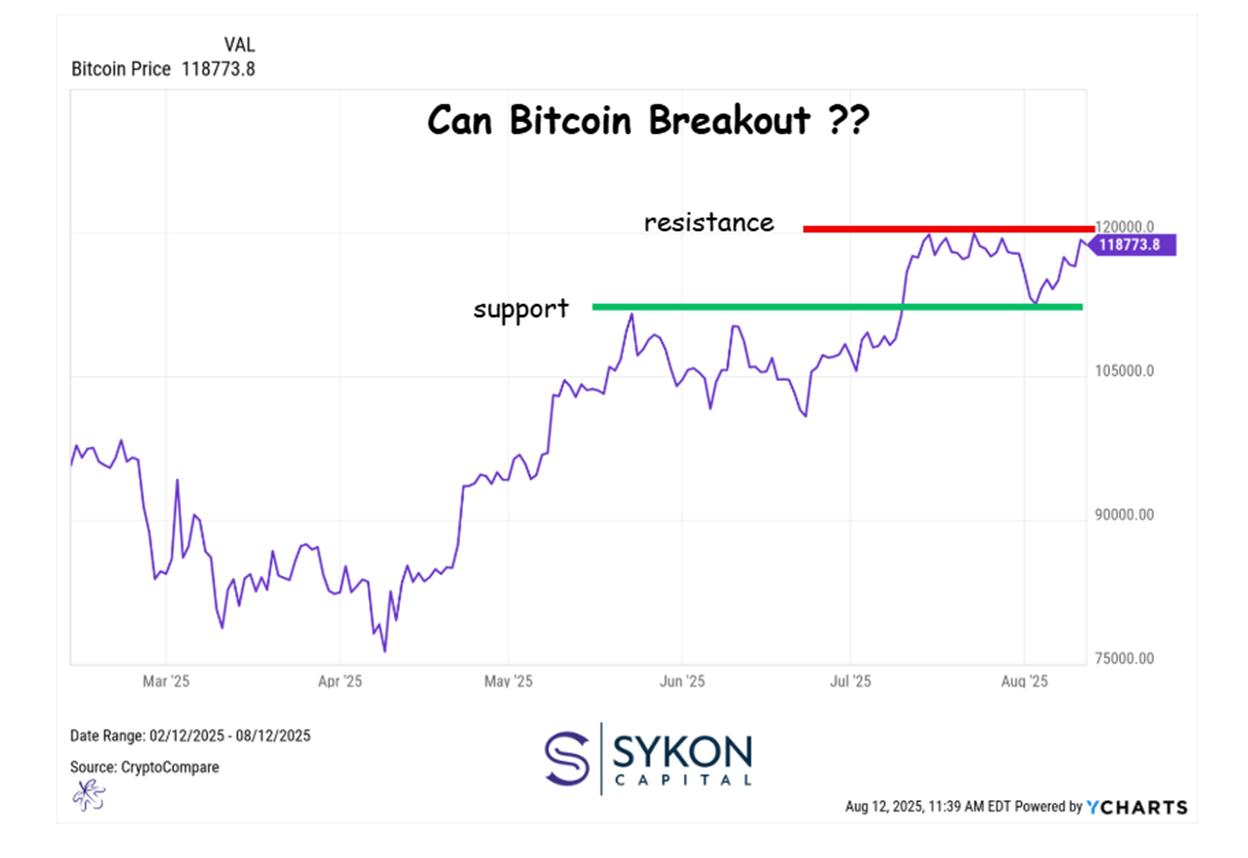
Over the past month, Bitcoin has tried to break above the $120,000 level two or three times. Each attempt has been met with selling pressure, pushing the price back down. At the same time, Bitcoin has found reliable support near $111,000, a level that served as resistance in May 2025 and was successfully retested as support in August.
This creates a clear trading range between $111K and $120K. Until one side breaks, we’re likely to see more back-and-forth inside these boundaries.
-
Resistance: $120K is now a well-defined ceiling. A clean break and hold above it would mark a major bullish development.
-
Support: $111K is proving to be a solid floor and could serve as the base for the next move higher.
-
Range-Bound Risk: The current setup suggests Bitcoin may continue consolidating between these levels in the near term.
The recent push higher has been supported by headlines around cryptocurrency deregulation and favorable legislation. That said, this may be a case of “buy the rumor, sell the news.” Markets often run up ahead of expected good news, then see profit-taking when the news becomes official. The real test will be whether this regulatory shift can provide enough fuel for Bitcoin to decisively clear resistance.
-
Watch for a weekly close above $120K.
-
That breakout needs to hold without quickly falling back into the range.
-
Failure to hold would risk another sharp rejection.
-
Patience is key. Forcing trades inside a range can lead to frustration.
-
If $120K breaks with conviction, new highs are possible.
-
If $111K fails, expect a deeper pullback before the next leg higher.
Bottom line: Bitcoin’s setup is constructive but unresolved. The levels are clear, the macro backdrop is improving, and the market is waiting for confirmation. When that comes, there should be plenty of opportunity to participate in the next big move, whichever direction it goes.
How low can the Dollar go??
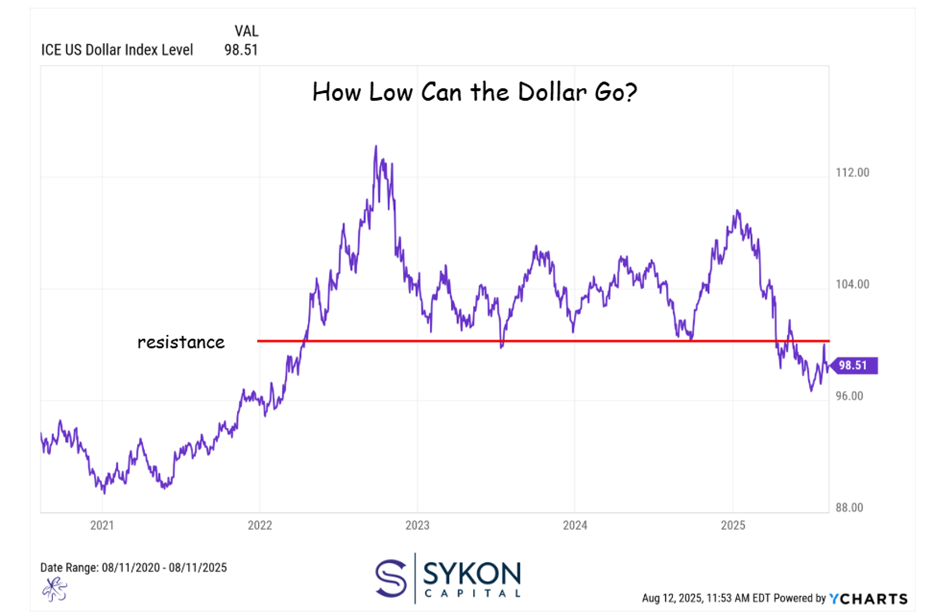
The weakening US Dollar: Investment implications
A key theme throughout 2025 has been the steady weakening of the U.S. dollar. After hitting multi-year highs, the dollar has slid to levels not seen since 2022, unwinding much of the strength that began with the breakout from the 2020–2021 lows.
The technical setup has shifted meaningfully. The round 100 level, once a critical support zone, has now flipped into overhead resistance. Until the dollar can reclaim and hold above that mark, the bias leans toward continued weakness.
-
Multi-Year Shift: The dollar’s move from highs to lows represents a complete reversal of the 2022–2024 uptrend.
-
Resistance at 100: Formerly strong support now acts as a ceiling. A break above would signal a potential trend change.
-
Lower Bias: Without a move back above 100, the path of least resistance remains to the downside.
From an investment perspective, a weaker U.S. dollar has broad implications across asset classes. When the dollar loses value, non U.S. dollar denominated assets often outperform as their local currency values strengthen relative to the dollar.
-
International Equities: Gains are amplified when foreign markets rise in their own currency and the dollar falls.
-
Non–USD Bonds: Foreign currency denominated fixed income sees additional return from currency appreciation.
-
Commodities: Many commodities are priced in U.S. dollars, so a weaker dollar often translates to higher prices in dollar terms.
This dynamic may already be influencing performance in 2025. International equities have been among the stronger performers this year, and several commodity markets have seen notable rallies. While global fundamentals play a role, the tailwind from currency weakness can’t be ignored.
-
A sustained break above 100 on the dollar index could shift the trend back to neutral or bullish.
-
Continued weakness could extend the run in international markets and commodities into 2026.
-
Any policy or rate shifts from the Federal Reserve could quickly change the currency backdrop.
Bottom line: The weakening dollar is more than just a currency story, it’s an investment theme that’s quietly shaping returns across multiple markets. As long as the dollar remains capped under 100, investors should keep positioning for assets that benefit from its decline.
![]()
Advisory Services offered through SYKON Capital LLC, a registered investment advisor with the U.S. Securities and Exchange Commission. This material is intended for informational purposes only. It should not be construed as legal or tax advice and is not intended to replace the advice of a qualified attorney or tax advisor. The information contained in this presentation has been compiled from third party sources and is believed to be reliable as of the date of this report. Past performance is not indicative of future returns and diversification neither assures a profit nor guarantees against loss in a declining market. Investments involve risk and are not guaranteed.
Unlock exclusive Gold and silver trading signals and updates that most investors don’t see. Join our free newsletter now!
