3 Altcoins Primed for a Breakout: AAVE, CRV, and ARB in the Spotlight

Crypto markets are buzzing—and these three altcoins are flashing bullish signals. Forget the Wall Street dinosaurs clinging to their spreadsheets; decentralized finance is rewriting the rules. Here’s what’s heating up this week.
AAVE: The DeFi Darling
Lending protocols are back in vogue, and AAVE’s liquidity pools are swelling. Watch for a volatility spike as institutional players dip toes into DeFi—ironic, given their past skepticism.
CRV: The Curveball
CRV’s governance token is defying bearish whispers. With stablecoin wars raging, Curve’s battle-tested AMM could see volume surges. Just don’t mention their last exploit—nobody’s perfect.
ARB: The Layer-2 Dark Horse
Arbitrum’s scaling solution is eating Ethereum’s lunch. As gas fees spike again, ARB’s tech could trigger a migration frenzy. Bonus: Traders love a good ‘Ethereum killer’ narrative—even if it’s exaggerated.
Bottom line: While traditional finance debates ‘blockchain viability,’ these tokens are busy building. Will they moon? Maybe. But they’re certainly out-innovating your bank’s 1999-era infrastructure.
Aave technical outlook suggests rally toward $400 as TVL hits record highs
Aave price found support around its 61.8% Fibonacci retracement level at $252.44 (drawn from the April 7 low of $114.05 to the July 18 high of $337.98) on August 3 and rallied nearly 30% in the next nine days until Tuesday.
This level roughly coincides with the ascending trendline (drawn by connecting multiple lows since early April), making it a key support zone. At the time of writing on Wednesday, it hovers around $321.
If AAVE continues its upward trend, it could rally toward its daily resistance at $367.11. A successful close above this level could extend gains toward the key psychological level $400.
The Relative Strength Index (RSI) reads 61, above its neutral level of 50 and pointing upward, indicating strong bullish momentum. The Moving Average Convergence Divergence (MACD) indicator also showed a bullish crossover on Saturday, giving a buy signal.
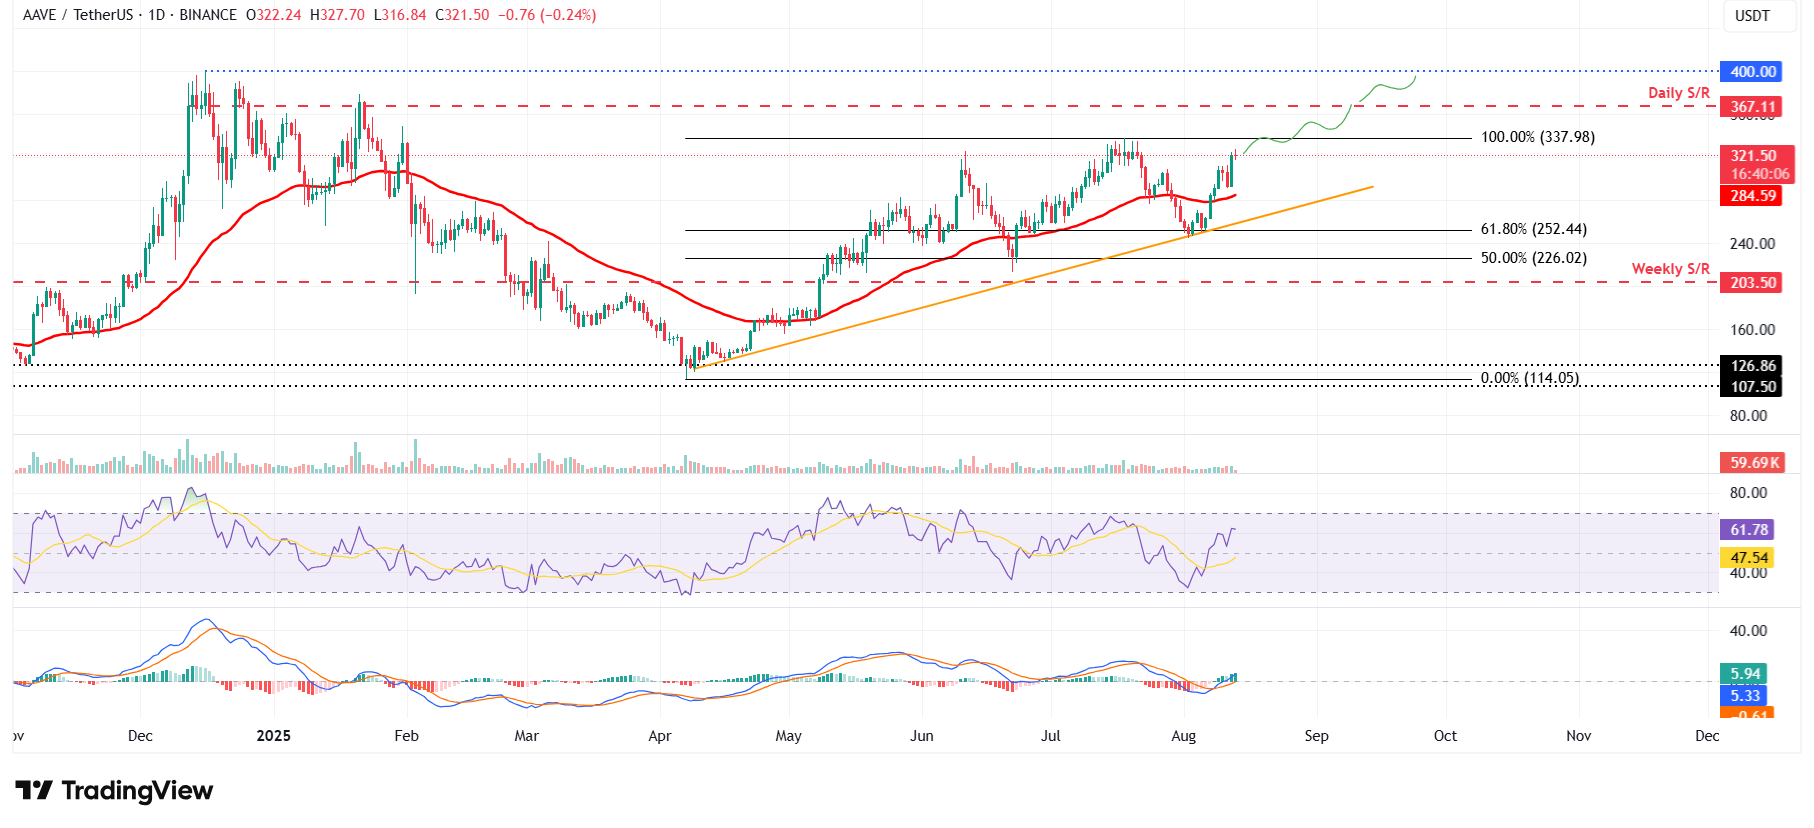
AAVE/USDT daily chart
DefiLlama data shows that AAVE’s Total Value Locked (TVL) reached a new all-time high (ATH) of $39.79 billion on Wednesday. This rise in TVL suggests growing activity and interest within Aave’s ecosystem, suggesting that more users are depositing or utilizing assets within AAVE-based protocols.
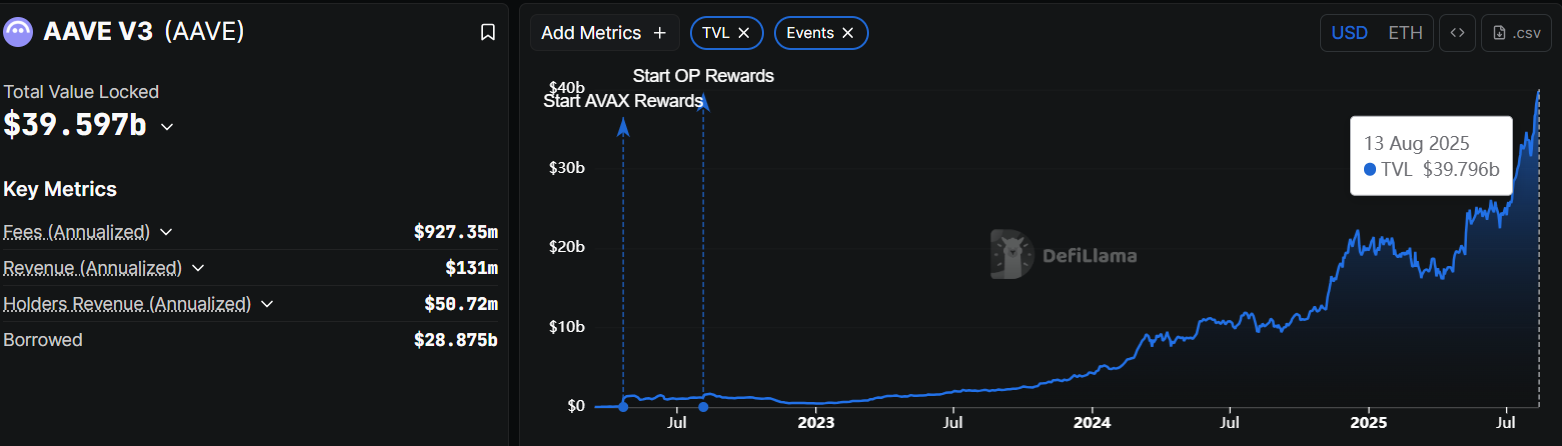
AAVE TVL chart. Source: DefiLlama
If Aave faces a correction, it could extend the decline to find support around its 50-day Exponential Moving Average (EMA) at $284.59.
Curve DAO shows bullish technicals, rising Open Interest
Curve DAO price found support around its 50% price retracement level at $0.84 (drawn from the December 7 high of $1.33 to the March 11 low of $0.34) on August 3 and ROSE over 13% until Tuesday. At the time of writing on Wednesday, it trades above $1.03.
CRV could extend the rally toward its daily resistance at $1.09. A decisive close above this level WOULD then shift the target to the December 7 high of $1.33.
The RSI reads above 61 and points upwards after bouncing above its neutral value of 50 on Monday, indicating that bullish momentum is gaining traction. The MACD lines are about to flip into a bullish crossover, and the falling red histogram bars suggest bearish momentum is fading.
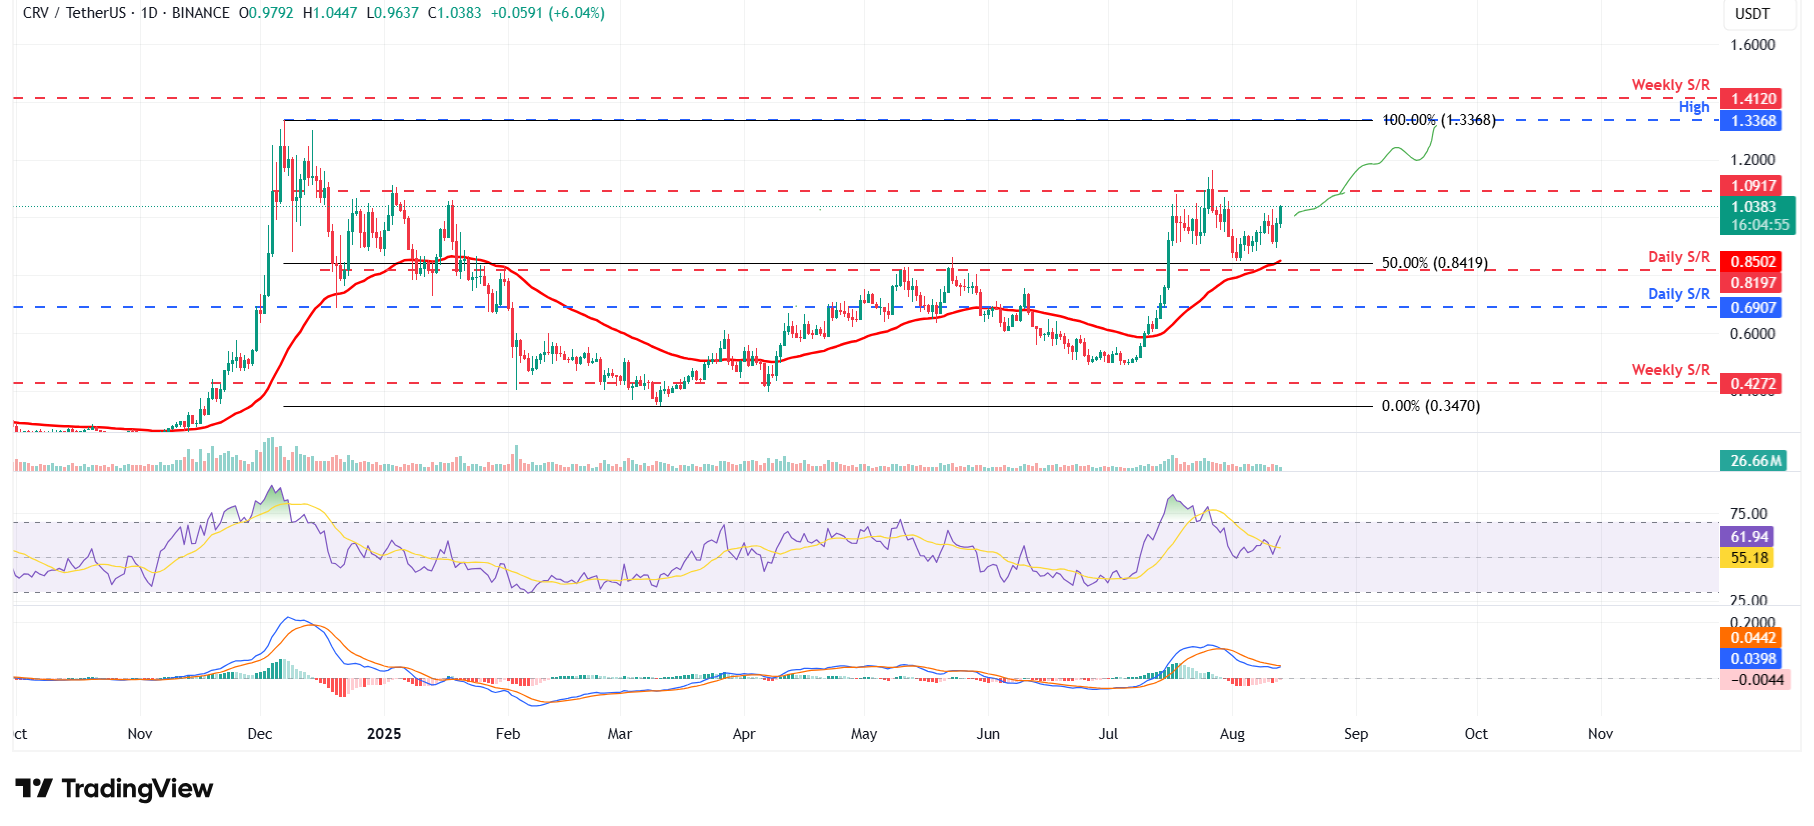
CRV/USDT daily chart
CoinGlass’s data indicates that the futures Open Interest (OI) in CRV at exchanges has risen to $406.99 million on Wednesday from $302.81 at the start of this month, closer to the record high of $458.55. Rising OI represents new or additional money entering the market and new buying, which could fuel the current CRV price rally.
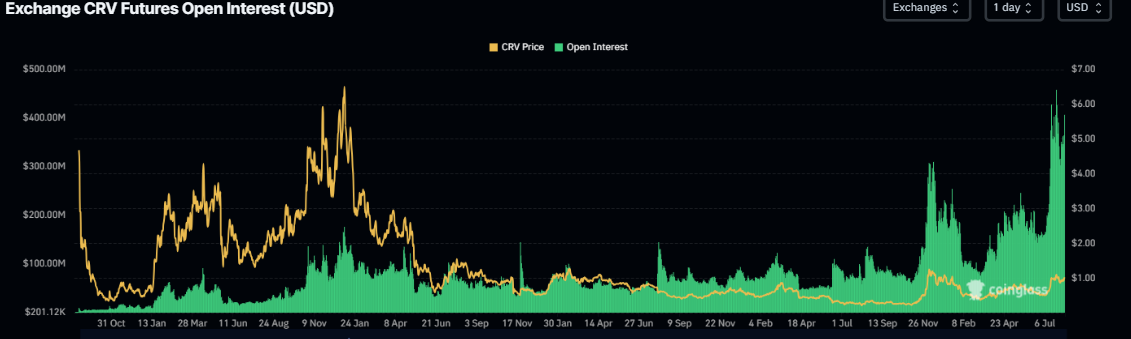
CRV Open Interest chart. Source: CoinGlass
On the other hand, if CRV faces a pullback, it could extend the decline toward its 50-day EMA at $0.85.
Arbitrum’s technical outlook suggests 20% gains
Arbitum price rebounded after finding support around its ascending trendline (drawn by connecting multiple lows since mid-June) on August 3 and rallied 25% until Tuesday. At the time of writing on Wednesday, it approaches its daily resistance at $0.49.
If ARB breaks above its daily resistance at $0.49 on a daily basis, it could rally a further 20% toward its next daily resistance at $0.60.
Similar to Aave's case, ARB’s RSI and MACD also support the bullish thesis.
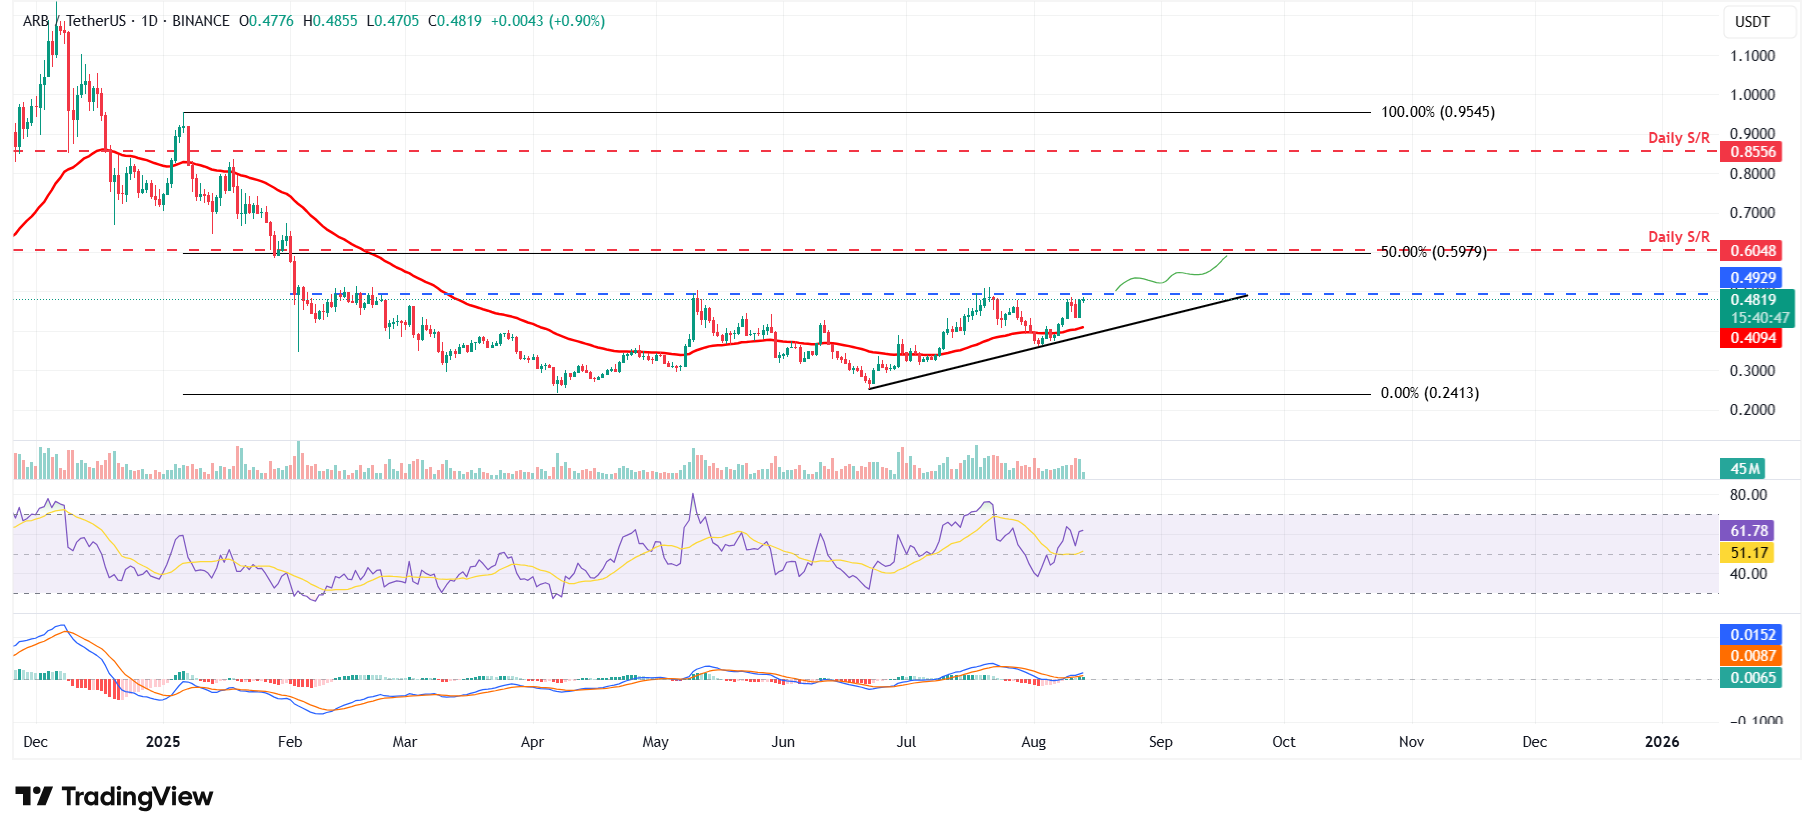
ARB/USDT daily chart
ARB’s TVL has been rising steadily since early August, reaching $3.31 billion on Wednesday and nearing its record high of $3.49 billion.
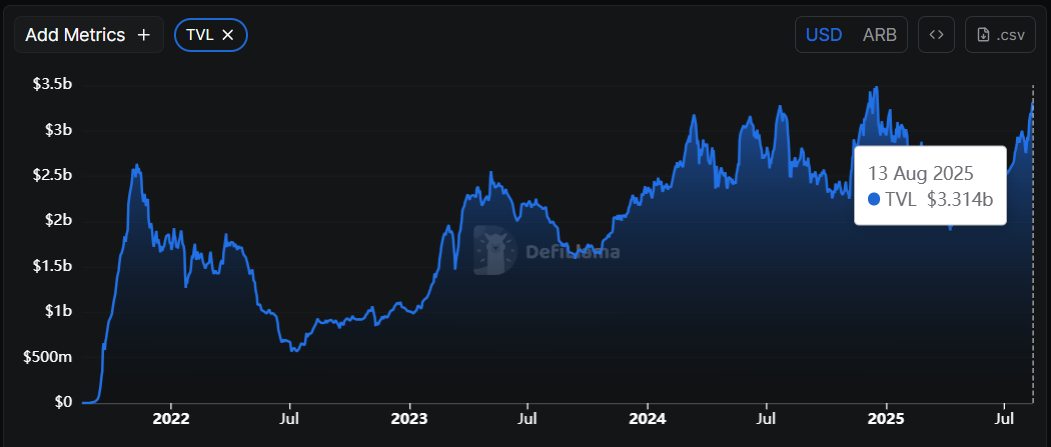
ARB TVL chart. Source: DefiLlama
If ARB faces a correction, it could extend the decline toward its 50-day EMA at $0.40.
