🚀 Litecoin Price Surge: LTC Shatters Bullish Pattern, Eyes $170 as Next Target

Litecoin just pulled a classic crypto breakout—smashing through a bullish technical formation like it's 2021 all over again. Here's why traders are flipping bullish.
The chart that woke the bulls
LTC's price action just completed a textbook-perfect ascending triangle breakout on the daily timeframe. No fancy indicators needed—just pure supply-demand imbalance screaming 'higher prices ahead.'
Road to $170?
The measured move target lands squarely at $170, which would mark a 30% climb from current levels. Of course, in crypto-land, 'measured moves' sometimes turn into moonshot rallies—or get rug-pulled by whales before lunch.
Silver to Bitcoin's gold?
Litecoin's latest move comes as Bitcoin dominance wobbles—because nothing makes altcoin traders more excitable than sniffing a potential rotation play. Just don't mention the 14 competing 'Bitcoin killers' launching this week.
One cynical take? The pattern's clean enough—but remember last month when every analyst swore Dogecoin would 'definitely' hit $1 after its breakout? Exactly.
Litecoin’s Open Interest hits a record high of $1.27 billion
CoinGlass’ data shows that the futures OI in Litecoin at exchanges rises to a new all-time high of $1.2 billion on Wednesday from $832 million in early August. Rising OI represents new or additional money entering the market and new buying, which could fuel the current LTC price rally.
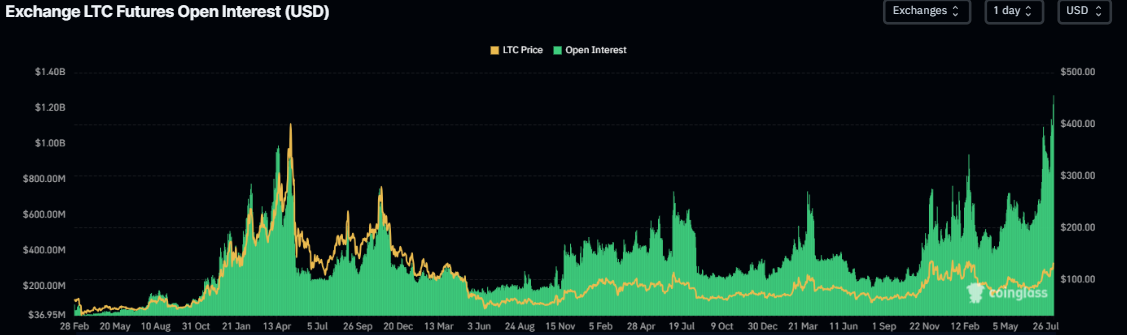
Litecoin Open Interest chart. Source: CoinGlass
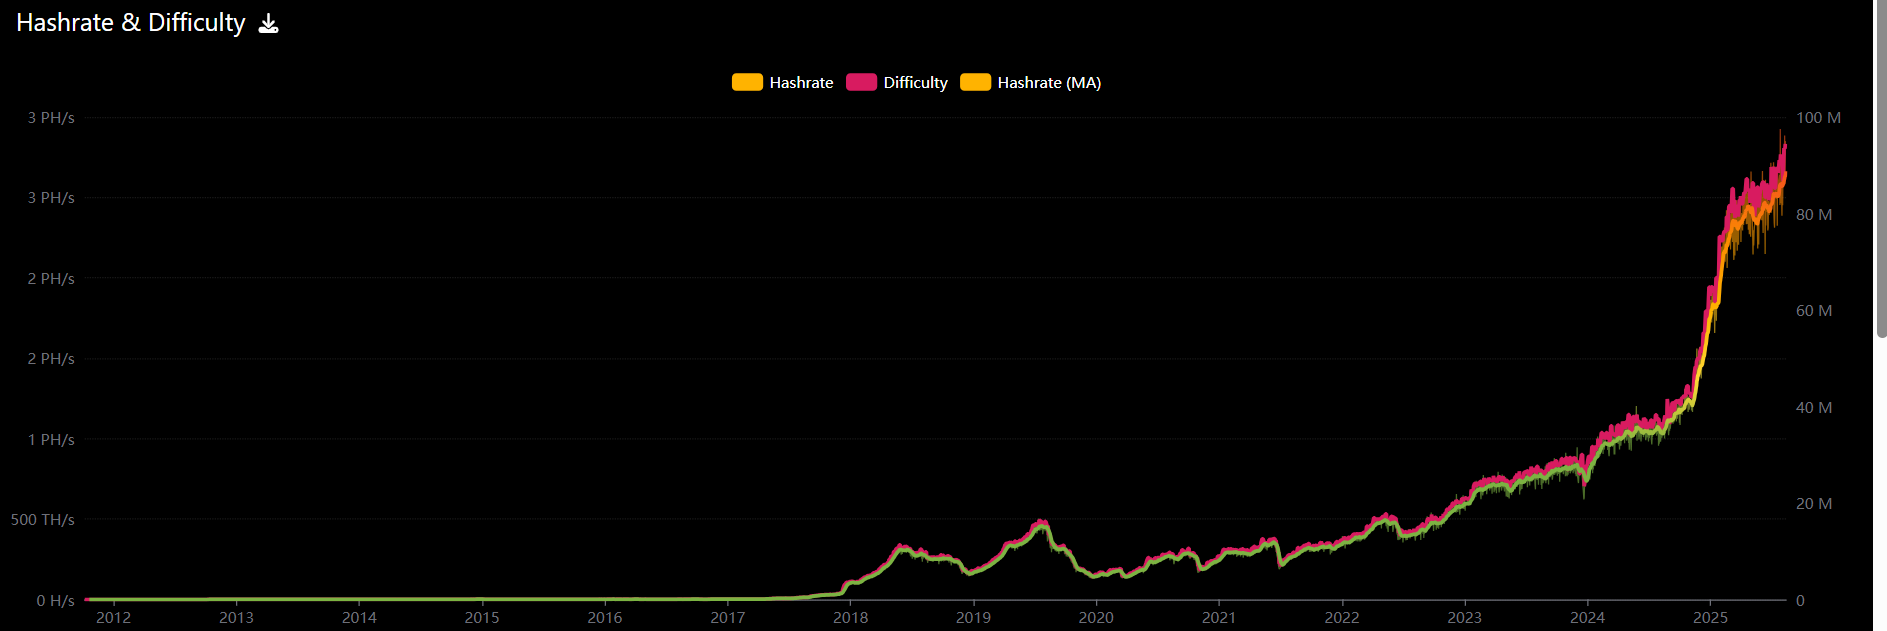
Litecoin’s hashrate has been constantly rising, as shown in The Graph below, indicating a significant increase in mining power and network security since its launch, which has boosted investors’ confidence in the LTC network.
Adding to this positive narrative is the rising bullish bets among LTC traders. Coinglass’s long-to-short ratio data for LTC reads 1.08, the highest level over a month.
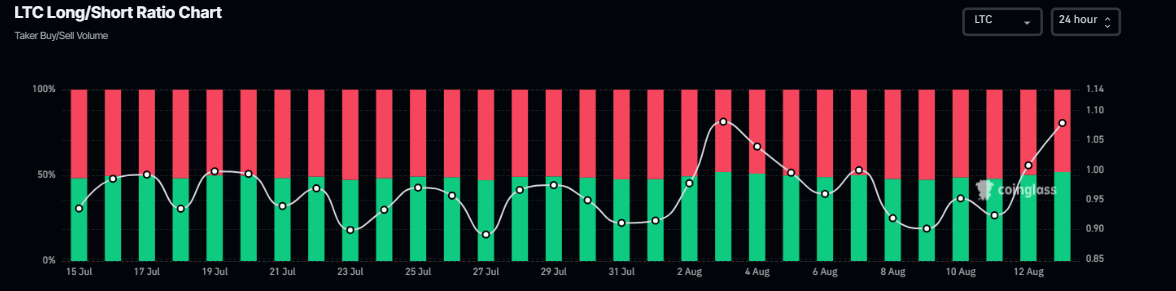
Litecoin long-to-short ratio. Source: CoinGlass
Litecoin Price Forecast: Bulls aiming for $170 mark
Litecoin price closed above the ascending parallel channel pattern (drawn by connecting multiple highs and lows with two trendlines since mid-March) on Tuesday. The breakout of this pattern favors the bulls, with a technical target often projected as the channel’s height from the breakout point. At the time of writing on Wednesday, it continues to trade higher above $133.
If LTC continues its upward trend, it could extend the rally toward its technical target of $170.30. Investors should be cautious of this theoretical move, as any upside MOVE could encounter resistance at the December 5 high at $147.06, where traders could book some profits.
The Relative Strength Index (RSI) on the daily chart read 70, moving upward toward its overbought condition, indicating strong bullish momentum. The MACD showed a bullish crossover on August 5 and also shows rising green histogram bars, further supporting the bullish thesis.
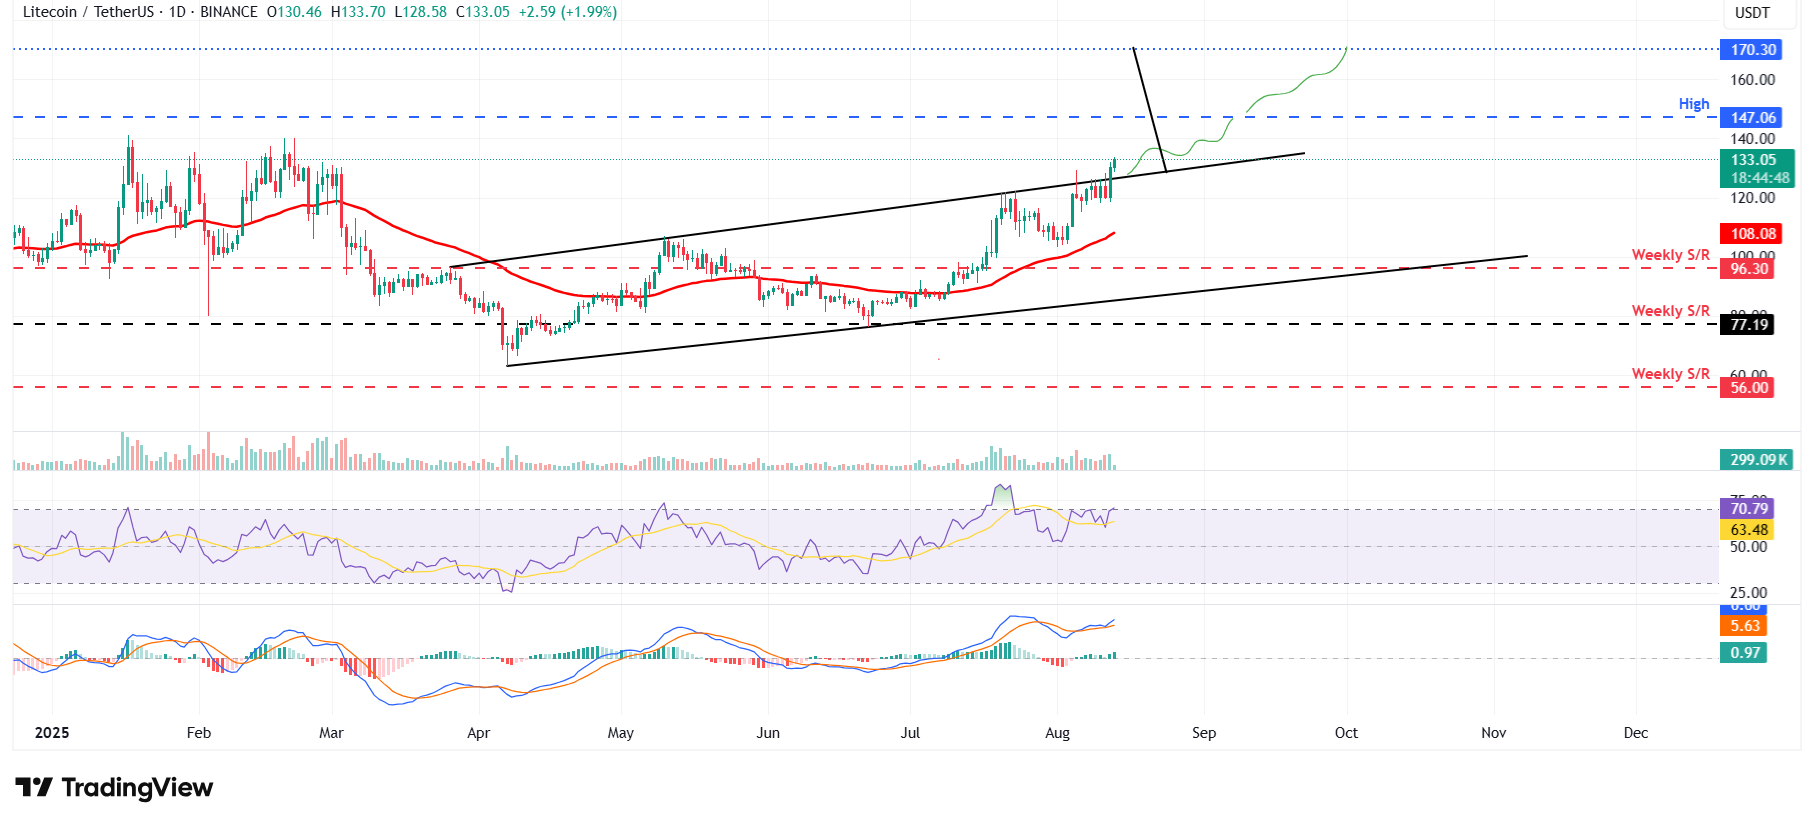
LTC/USDT daily chart
However, if LTC faces a correction, it could find support at the upper channel trendline boundary at $125.
