Bitcoin Nears ATH Again: Shorts Get Obliterated as BTC Charges Toward Record Highs

Bitcoin's bull run just turned into a bloodbath for bears.
The king of crypto is knocking on the door of its all-time high—and leaving a trail of liquidated short positions in its wake. Traders betting against BTC are getting steamrolled as the digital asset defies gravity (and Wall Street skepticism).
Market wipeout: The shorts never saw it coming
This isn't just a rally—it's a full-scale demolition of bearish sentiment. The same skeptics who called Bitcoin 'digital tulips' are now scrambling to cover positions as price action turns parabolic.
Funny how quickly 'overpriced' becomes 'undervalued' when FOMO kicks in.
Next stop: Price discovery
With resistance levels crumbling like a stale cookie, BTC's path to new highs looks clearer than a banker's conscience (which isn't saying much). The real question isn't if we'll break ATH—but how violently we'll pump when it happens.
One thing's certain: The market's about to separate the diamond hands from the margin-called tourists.
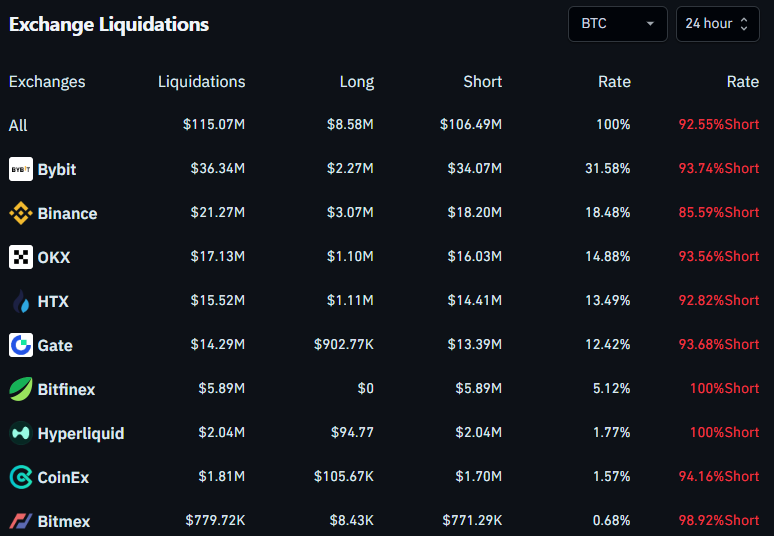
Bitcoin surpasses $120,000, liquidates 92.55% shorts
Bitcoin price surged above $120,000 on Monday during the Asian trading session and is trading above $121,400 during the European session. This price rise comes amid hopes that a meeting between US and Russian presidents, Donald TRUMP and Vladimir Putin, will end the war in Ukraine. The short squeeze has wiped out 92.55% of BTC short positions in the last 24 hours.
As BTC is now nearing its all-time high of $123,218 set on July 14, surpassing this level to reach around $123,500 WOULD trigger another short squeeze scenario, potentially leading to short liquidation worth $1.14 billion, according to Coinglass data.
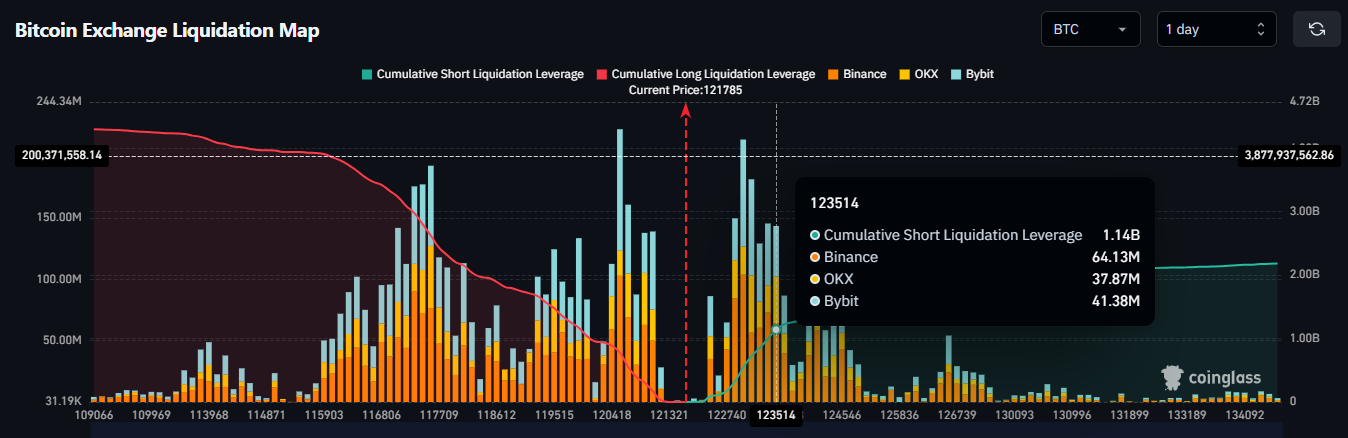
Bitcoin Exchange Liquidation Map chart. Source: Coinglass
Institutional demand for BTC resumes
Institutional demand for Bitcoin supported its price rise as it rose nearly 5% last week. According to SoSoValue data, Bitcoin spot Exchange Traded Fund (ETF) recorded an inflow of $246.75 million last week, after recording an outflow of $643.04 million the previous week.
This weekly inflow indicates that demand for BTC is resuming, but the value of the FLOW is way below compared to the levels seen during mid-July, when BTC reached record highs.
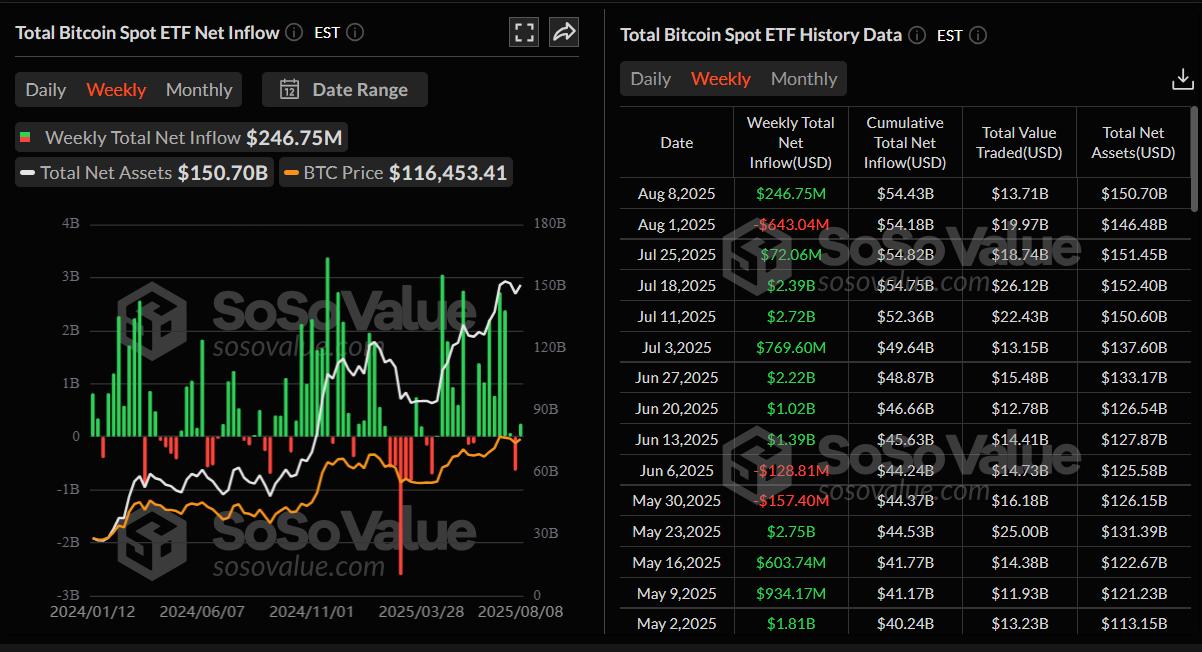
QCP Capital reported on Monday that institutional demand and spot ETF flows will be key to watch as BTC approaches its record highs.
Regulation clarity alongside Trump’s supporting policies for Bitcoin
The US announcements and policies supported Bitcoin’s price surge last week. US President Donald Trump signed an executive order on Thursday that aims to allow cryptocurrency, private equity, and real estate in 401(k)s.
On Tuesday, the US Securities and Exchange Commission (SEC) announced that crypto liquid staking activities do not constitute a securities offering, marking a step toward clearer digital asset regulation.
Market participants await a key US macroeconomic data release on Tuesday, July’s Consumer Price Index (CPI) data, which provides information regarding inflation and thus can influence chances of upcoming interest-rate cuts by the US Federal Reserve (Fed).. In the meantime, fresh headlines surrounding the US-China trade talks ahead of the August 12 deadline for a deal could add volatility to riskier assets such as Bitcoin.
“With prices at critical resistance, some profit-taking is probable ahead of CPI,” says QCP’s Capital analyst.
The analyst continued that the market’s ability to absorb recent “OG whale” sell-offs without losing momentum reinforces the structurally bullish outlook.
Bitcoin Price Forecast: BTC nears new record high
Bitcoin price found support around its previous all-time high of $111,980 on August 3 and rallied 6% until Sunday. At the time of writing on Monday, it trades above its psychological level at $120,000.
If BTC continues its upward trend, it could extend the rally toward its record high of $123,218. If a successful close above this level occurs, BTC would enter price discovery mode with bulls targeting the psychological level of $125,000.
The Relative Strength Index (RSI) on the daily chart reads 65, above its neutral level of 50, indicating strong bullish momentum. The Moving Average Convergence Divergence (MACD) shows a bullish crossover on Monday, giving a buy signal.
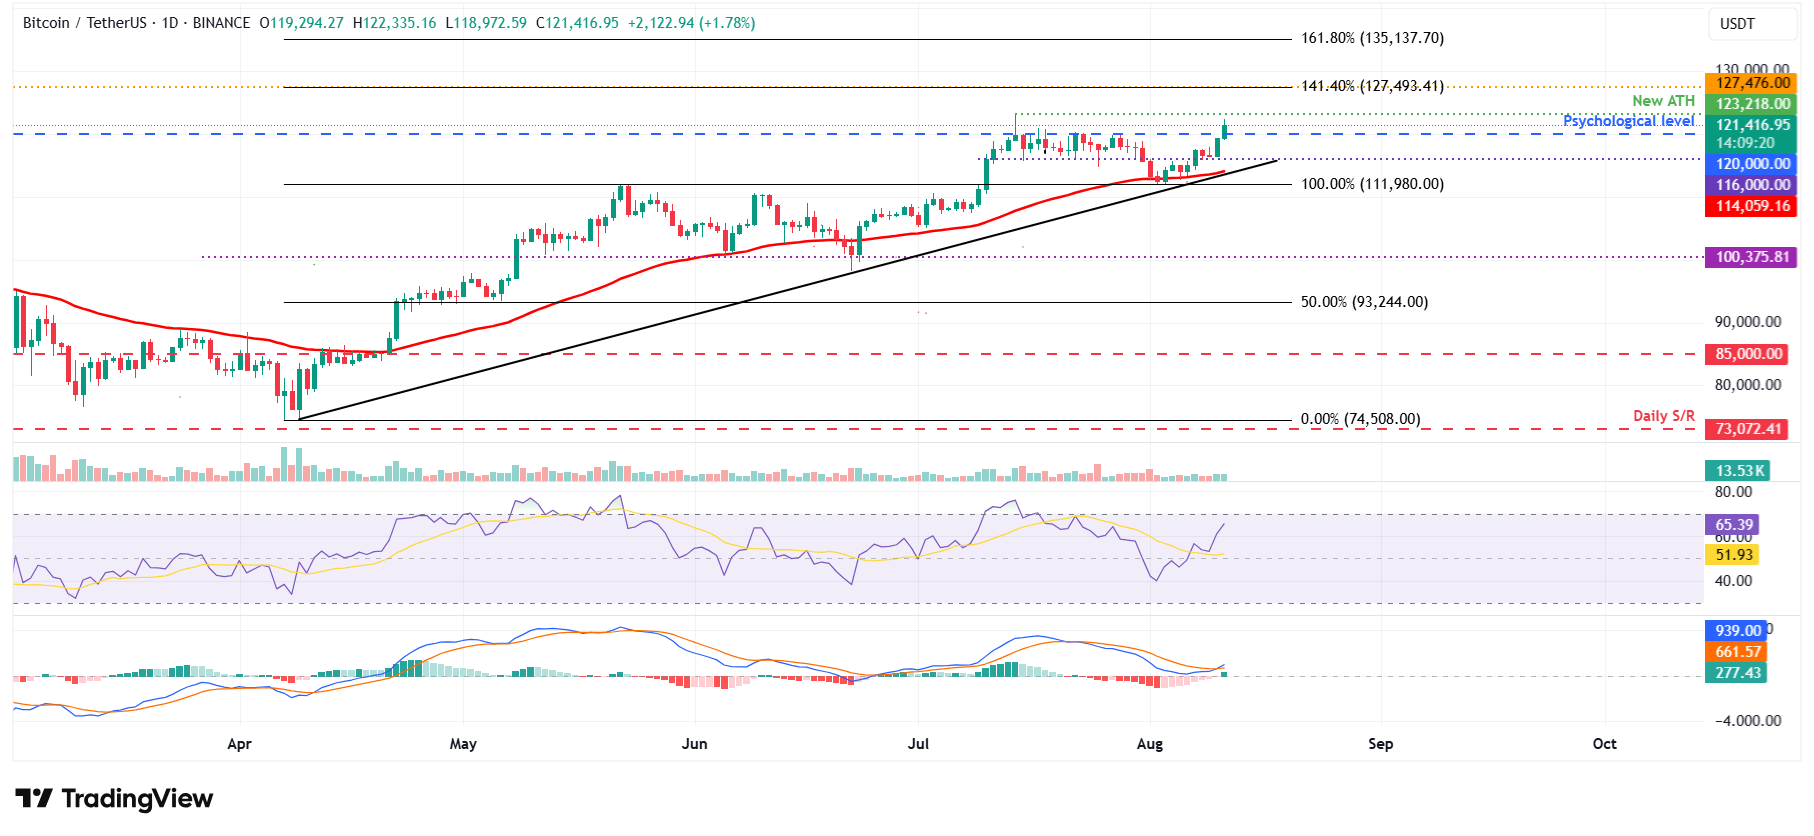
BTC/USDT daily chart
If BTC faces a correction, it could extend the decline to find support around the daily level at $116,000.
Cryptocurrency metrics FAQs
What is circulating supply?
The developer or creator of each cryptocurrency decides on the total number of tokens that can be minted or issued. Only a certain number of these assets can be minted by mining, staking or other mechanisms. This is defined by the algorithm of the underlying blockchain technology. On the other hand, circulating supply can also be decreased via actions such as burning tokens, or mistakenly sending assets to addresses of other incompatible blockchains.
What is market capitalization?
Market capitalization is the result of multiplying the circulating supply of a certain asset by the asset’s current market value.
What is trading volume?
Trading volume refers to the total number of tokens for a specific asset that has been transacted or exchanged between buyers and sellers within set trading hours, for example, 24 hours. It is used to gauge market sentiment, this metric combines all volumes on centralized exchanges and decentralized exchanges. Increasing trading volume often denotes the demand for a certain asset as more people are buying and selling the cryptocurrency.
What is the funding rate?
Funding rates are a concept designed to encourage traders to take positions and ensure perpetual contract prices match spot markets. It defines a mechanism by exchanges to ensure that future prices and index prices periodic payments regularly converge. When the funding rate is positive, the price of the perpetual contract is higher than the mark price. This means traders who are bullish and have opened long positions pay traders who are in short positions. On the other hand, a negative funding rate means perpetual prices are below the mark price, and hence traders with short positions pay traders who have opened long positions.
