🚀 Bitcoin, Ethereum, Ripple Surge as Trump Greenlights Crypto in 401(k)s – Top 3 Price Predictions for BTC, ETH, XRP

Crypto markets ignite as regulatory shackles loosen—Trump's 401(k) pivot sends BTC, ETH, and XRP skyrocketing. Here's where the smart money bets they're headed next.
The Bitcoin Effect: Institutional Floodgates Open
BTC smashes resistance levels as retirement funds get a backdoor to crypto—Wall Street's favorite hedge just got a government stamp.
Ethereum's DeFi Dominance Pays Off
ETH rallies on infrastructure demand—because nothing says 'retirement plan' like gas fees and yield farming (ask your financial advisor—if they've heard of it).
Ripple's Revenge Tour Continues
XRP defies SEC ghosts with 30% weekly gains—apparently lawsuits make for great buying opportunities when politicians need blockchain votes.
Bullish? Obviously. Sustainable? Ask the Fed. One thing's clear: your 401(k) just got more interesting than your broker's golf handicap.
Bitcoin heads towards the $120,000 mark
Bitcoin price closed above the $116,000 resistance level on Thursday after finding support around its 50-day Exponential Moving Average (EMA) at around $113,000 earlier this week. At the time of writing on Friday, it hovers at around $116,700.
If $116,000 holds as support, BTC could extend the rally toward its key psychological level at $120,000.
The Relative Strength Index (RSI) moved above its neutral level of 50 on Thursday and currently reads 53, indicating fading bearish momentum. For the bullish momentum to be sustained, the RSI must continue moving upward. The Moving Average Convergence Divergence (MACD) lines are nearing each other on the daily chart. The red histogram bar below the neutral level is also decreasing, indicating fading bearish momentum.
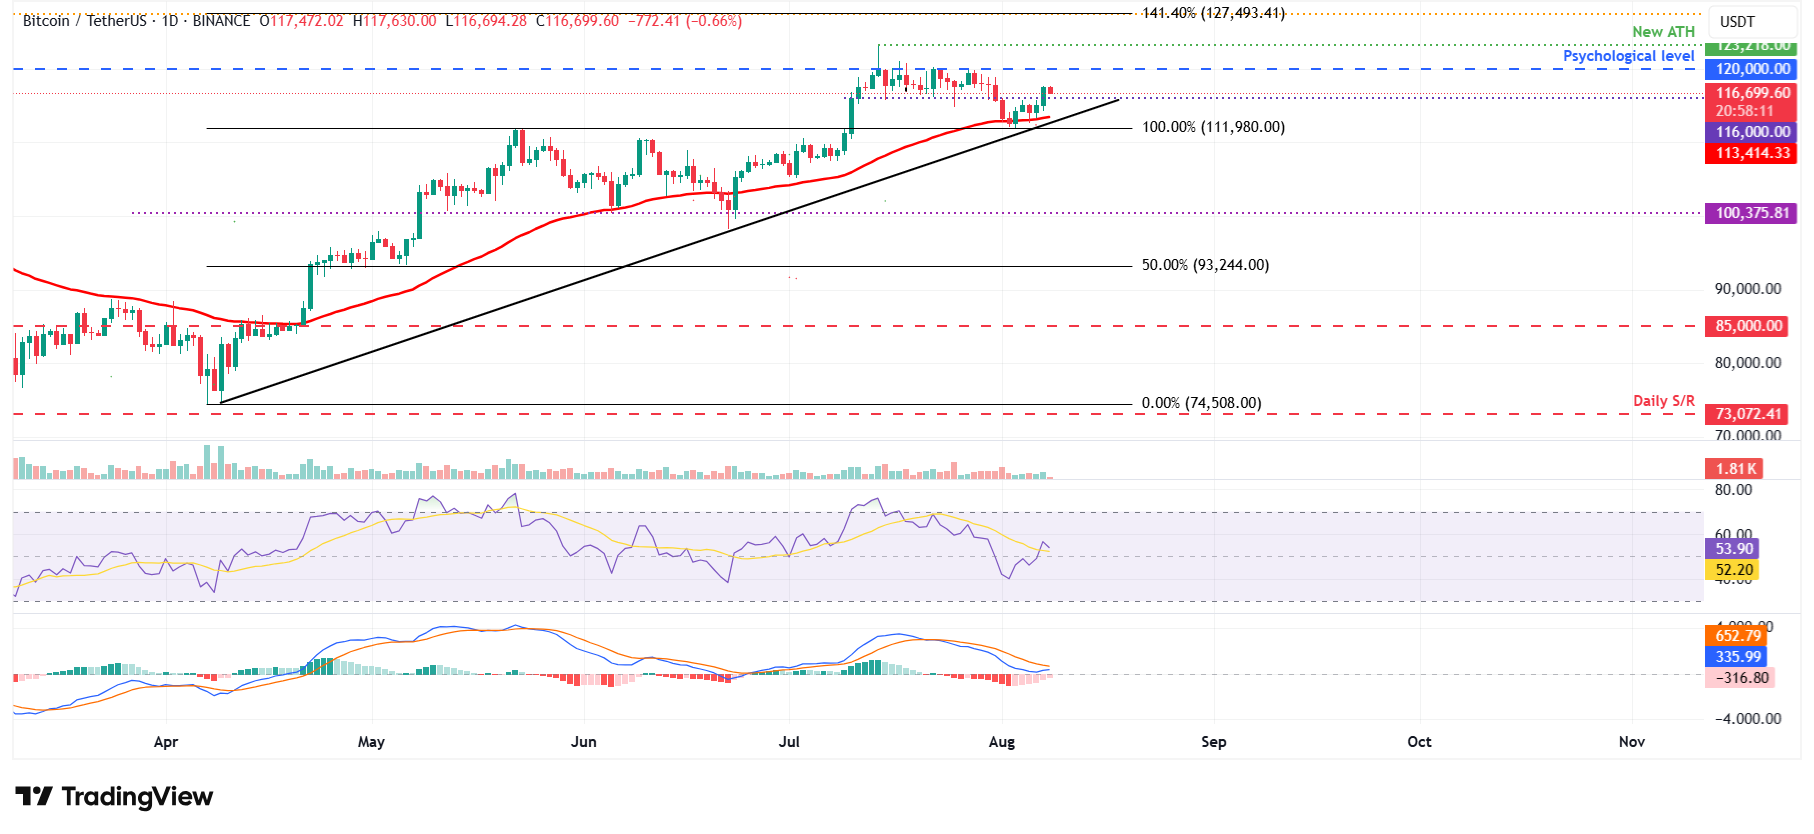
BTC/USDT daily chart
However, if BTC fails to find support around the $116,000 and closes below, it could extend the decline toward its 50-day EMA at $113,414.
Ethereum bulls aiming for levels above $4,000
Ethereum price found support around its 78.60% Fibonacci retracement level at $3,397 on Sunday and rallied over 16%, closing above the daily resistance at $3,730 on Thursday. At the time of writing on Friday, it nears its key psychological level at $4,000.
If ETH breaks and closes above the $4,000 level, it could extend the rally toward the December 9, 2021, high of $4,488.
The RSI on the daily chart reads 65, above its neutral level of 50, indicating bullish momentum. Like Bitcoin, Ethereum’s MACD lines are nearing each other on the daily chart. The red histogram bar below the neutral level is also decreasing, indicating fading bearish momentum.
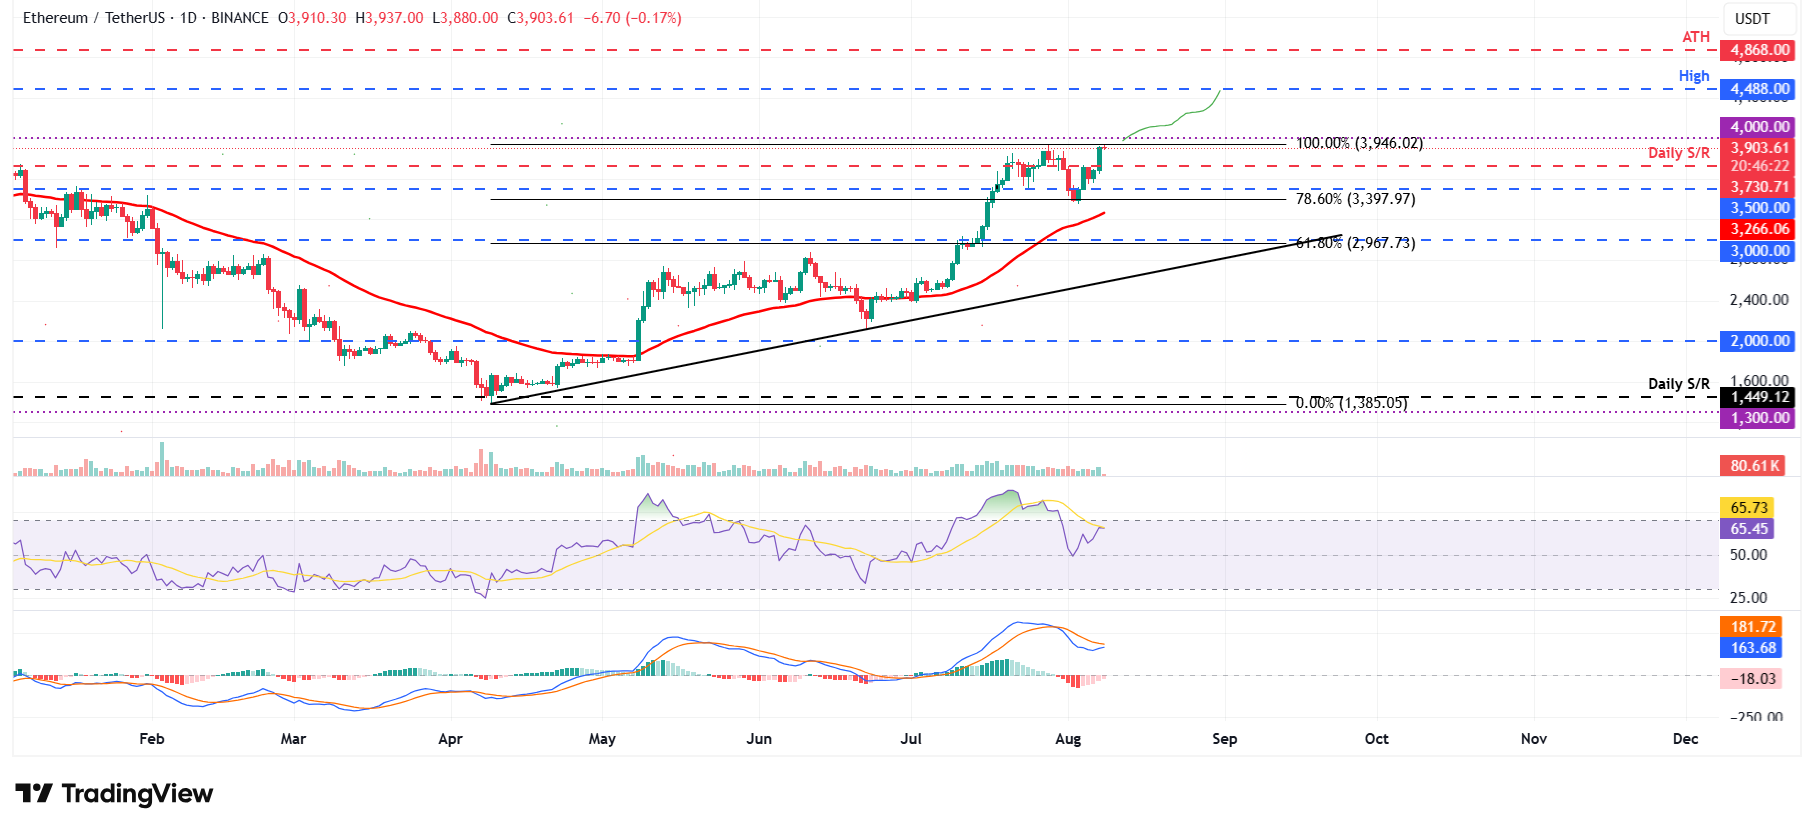
ETH/USDT daily chart
On the other hand, if ETH faces a correction, it could extend the decline to find support around its daily level at $3,730.
XRP could rally toward record high if it closes above $3.40 resistance
XRP price found support around the 50-day EMA at $2.84 on Sunday and recovered nearly 11% by Monday. This 50-day EMA roughly coincides with the daily level at $2.72 and the 50% Fibonacci level at $2.78, making it a key support zone. XRP continued its recovery mid-week, reaching a high of $3.33 on Thursday. At the time of writing on Friday, it continues its rally, approaching its key resistance at $3.40.
If XRP closes above the $3.40 resistance, it could fuel the rally toward record highs at $3.66.
The RSI on the daily chart reads 62, above its neutral level of 50 and pointing upward, indicating strong bullish momentum. Like BTC and ETH, Ripple’s MACD is also indicating a fading bearish momentum.
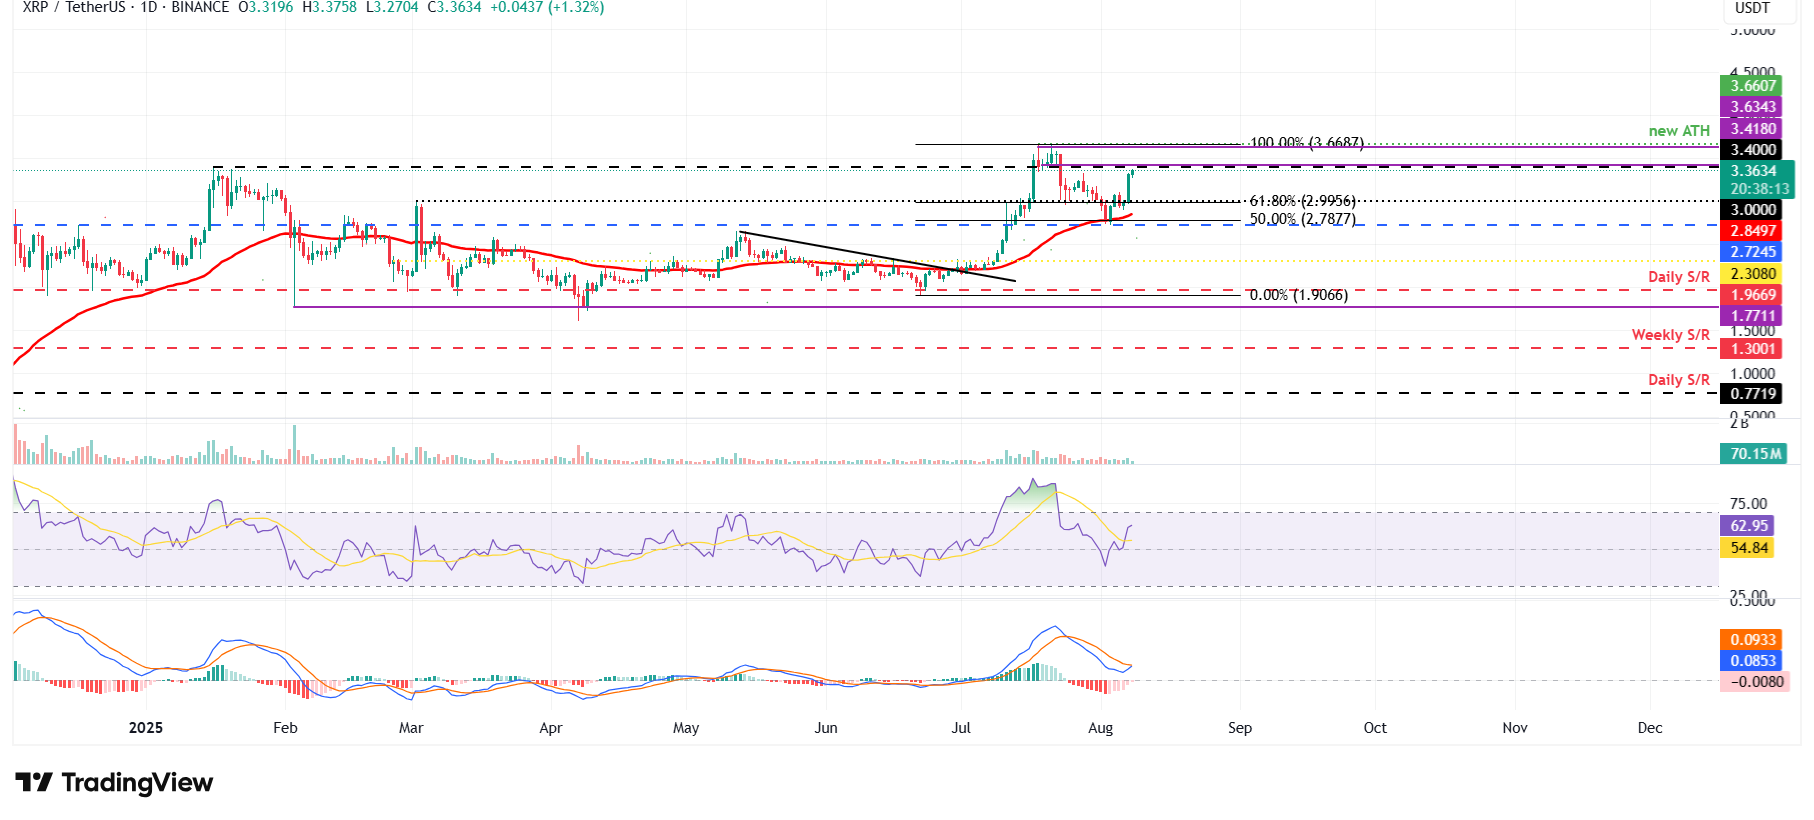
XRP/USDT daily chart
Conversely, if XRP fails to close above the $3.40 resistance and faces a correction, it could extend the pullback toward its 50-day EMA at $2.84.
Cryptocurrency metrics FAQs
What is circulating supply?
The developer or creator of each cryptocurrency decides on the total number of tokens that can be minted or issued. Only a certain number of these assets can be minted by mining, staking or other mechanisms. This is defined by the algorithm of the underlying blockchain technology. On the other hand, circulating supply can also be decreased via actions such as burning tokens, or mistakenly sending assets to addresses of other incompatible blockchains.
What is market capitalization?
Market capitalization is the result of multiplying the circulating supply of a certain asset by the asset’s current market value.
What is trading volume?
Trading volume refers to the total number of tokens for a specific asset that has been transacted or exchanged between buyers and sellers within set trading hours, for example, 24 hours. It is used to gauge market sentiment, this metric combines all volumes on centralized exchanges and decentralized exchanges. Increasing trading volume often denotes the demand for a certain asset as more people are buying and selling the cryptocurrency.
What is the funding rate?
Funding rates are a concept designed to encourage traders to take positions and ensure perpetual contract prices match spot markets. It defines a mechanism by exchanges to ensure that future prices and index prices periodic payments regularly converge. When the funding rate is positive, the price of the perpetual contract is higher than the mark price. This means traders who are bullish and have opened long positions pay traders who are in short positions. On the other hand, a negative funding rate means perpetual prices are below the mark price, and hence traders with short positions pay traders who have opened long positions.
