Ethereum’s Path to $6,000+ Looks Unstoppable – Here’s Why

Ethereum isn’t just climbing—it’s gearing up to smash past $6,000, and the charts aren’t lying.
The Bull Case Is Stronger Than Ever
With institutional money flooding in and DeFi protocols locking up ETH like digital Fort Knox, supply shock is real. The Merge was just the warm-up act.
Macro Tailwinds? Or Just Crypto Doing Crypto?
Traditional finance still doesn’t get it—while they debate rate cuts, Ethereum’s network burns fees faster than a hedge fund burns investor capital.
Short Sellers Beware
The $6K target isn’t hopium. It’s simple math: adoption + scarcity = boom. And yes, Wall Street will FOMO in late, as usual.
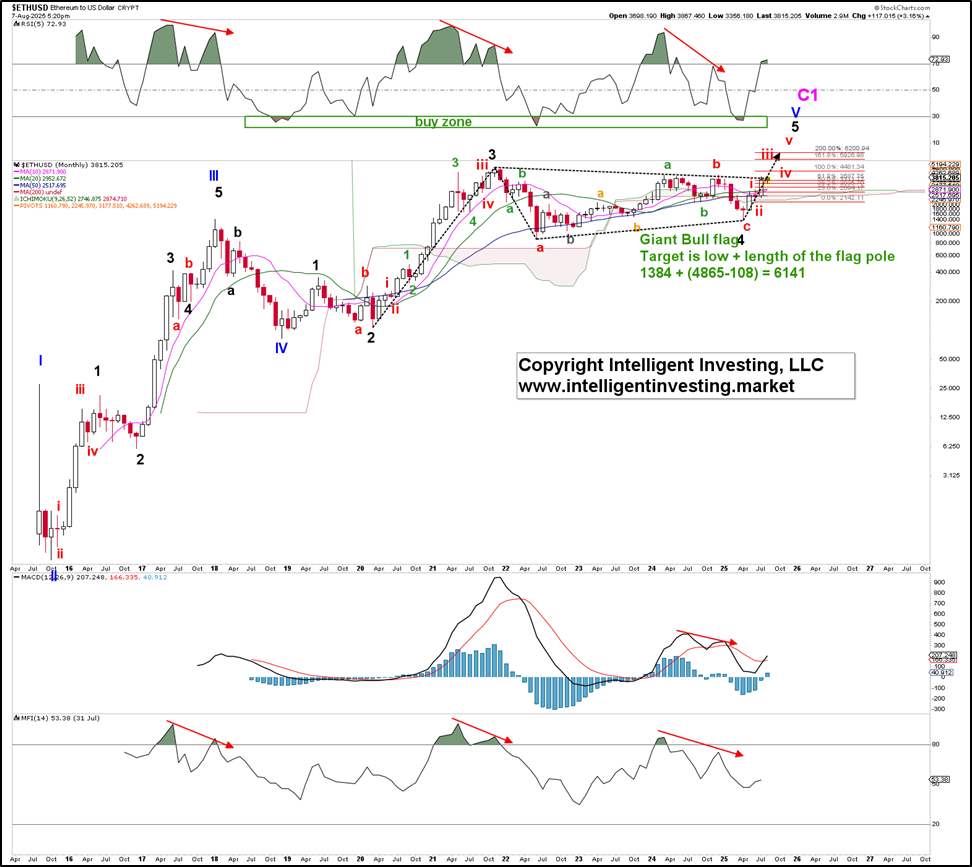
Figure 1. Our preferred short-term EW count for Ethereum
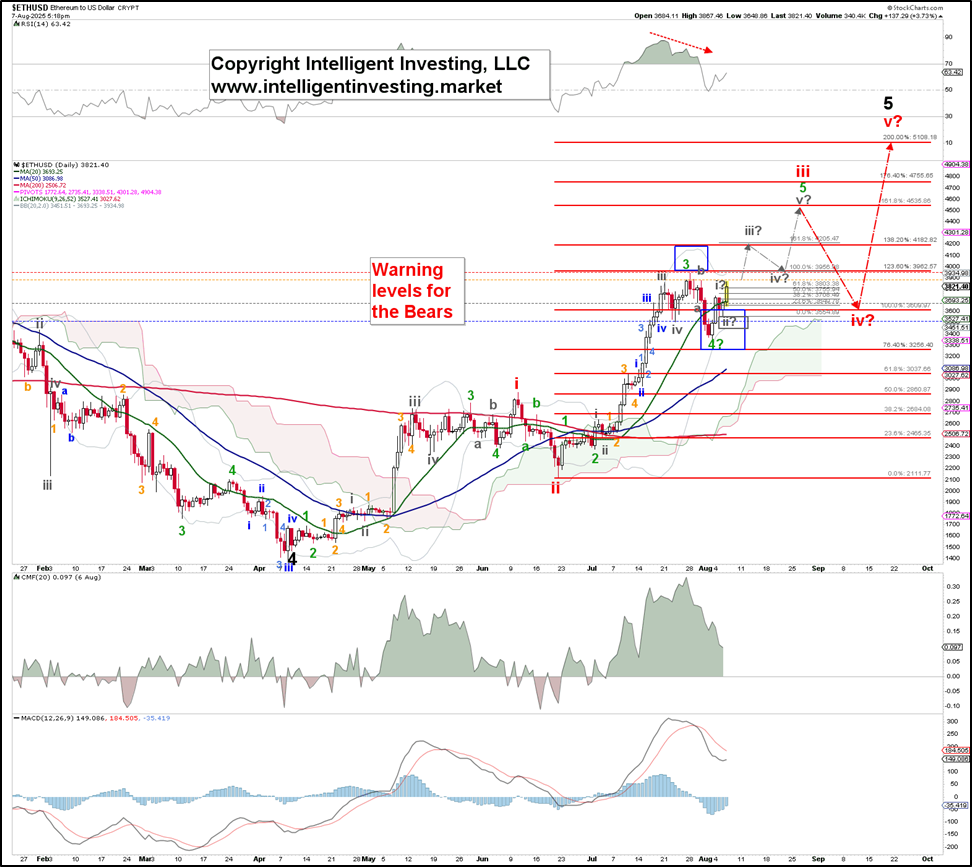
Assuming Sunday’s $3356 low marked the end of the green W-4, we can then set up the gray W-i, ii as shown in Figure 1 above. The ideal W-ii target zone is $3450-$ 3555, so Tuesday’s low at $3546 got close enough. Now, Ethereum is breaking above Monday’s $3737 high, strongly suggesting the gray W-iii of the green W-5 is underway, with confirmation above $3878. Thus, although the warning levels for the Bears are still shown, because W-5 has not yet been confirmed, those for the Bulls are now set at: 1st at $ 3737, 2nd at $ 3648, 3rd at $ 3546, and 4th at $ 3356.
Note that the ideal red W-v target at the red 200% extension of roughly $5100 is significantly below the breakout/symmetry target of about $6140. See Figure 2 below. Therefore, we may see an extended fifth wave, which is quite common for cryptocurrencies. Additionally, the 200% log-based Fibonacci extension indicates a target of around $6200, while a linear-scaled 300% Fibonacci extension targets the $6190s. All of these align.
Figure 2. Our preferred long-term EW count for Ethereum