Sui Price Alert: SUI Derivatives and On-Chain Data Signal Bearish Storm Ahead

Brace for impact—Sui's market dynamics are flashing red. Derivatives traders and blockchain sleuths spot trouble brewing.
Derivatives bleed bearish
Open interest nosedives as leveraged positions unwind. The smart money's hedging hard—and retail hasn't noticed the lifeboats yet.
On-chain tells the real story
Whale wallets moving like glaciers before an avalanche. Exchange inflows spike while staking contracts thin out. Classic distribution pattern.
Meanwhile, the usual crypto influencers keep shilling 'accumulation zones' between margarita pours. The market's pricing in reality while Twitter's still drunk on hopium.
SUI bearish bets reach a monthly high
Sui derivatives data show a bearish outlook. CoinGlass’s long-to-short ratio reads 0.63 on Thursday, marking the lowest level in over a month. A ratio below one suggests bearish sentiment in the market as traders are betting that Sui’s price will fall.
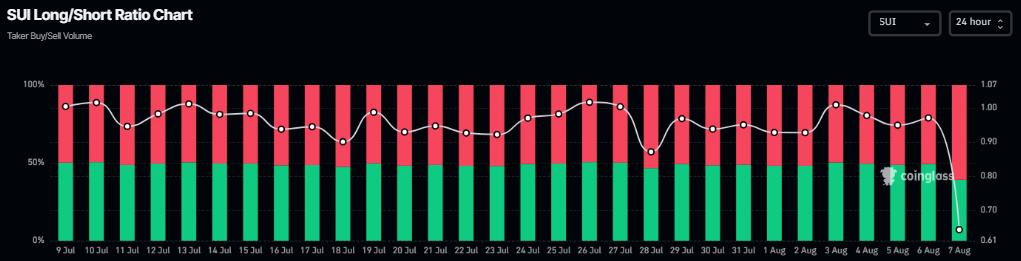
Sui long-to-short ratio chart. Source: CoinGlass
Looking at the on-chain data adds more credence to the rising selling pressure on SUI. CryptoQuant’s Taker CVD (Cumulative Volume Delta) for sui is negative, and its value has been steadily decreasing since mid-July.
This metric measures the cumulative difference between market buy and sell volumes over three months. When the three-month CVD is positive and increasing, it suggests the Taker Buy Dominant Phase. A negative and decreasing value, as it is currently happening, indicates the Taker Sell Dominant Phase.
%20(1)-1754531884980-1754531884981.png)
Sui Spot Taker CVD chart. Source: CryptoQuant
Sui Price Forecast: SUI momentum indicators show weakness
Sui price closed below its ascending trendline (drawn by joining multiple lows since June 22) last week on Friday and declined nearly 4% the next day. However, SUI recovered after finding support around the 200-day Exponential Moving Average (EMA) at $3.35 on Sunday, retesting its broken trendline the following day. This broken trendline roughly coincides with the daily resistance level at $3.65 and the 61.8% Fibonacci retracement level at $3.62, making it a key resistance zone. On Tuesday, it failed to close above this resistance zone, declined slightly, but found support the next day around its 200-day EMA. At the time of writing on Thursday, it hovers at around $3.50.
If SUI closes below the 200-day EMA at $3.35 on a daily basis, it could extend the correction toward its next daily support at $2.90.
The Relative Strength Index (RSI) indicator and Awesome Oscillator (AO) on the daily chart are trading below the neutral levels of 50 and zero, respectively. These momentum indicators strongly indicate bearish dominance. The Moving Average Convergence Divergence (MACD) showed a bearish crossover on July 29 that still holds, also indicating bearish momentum.
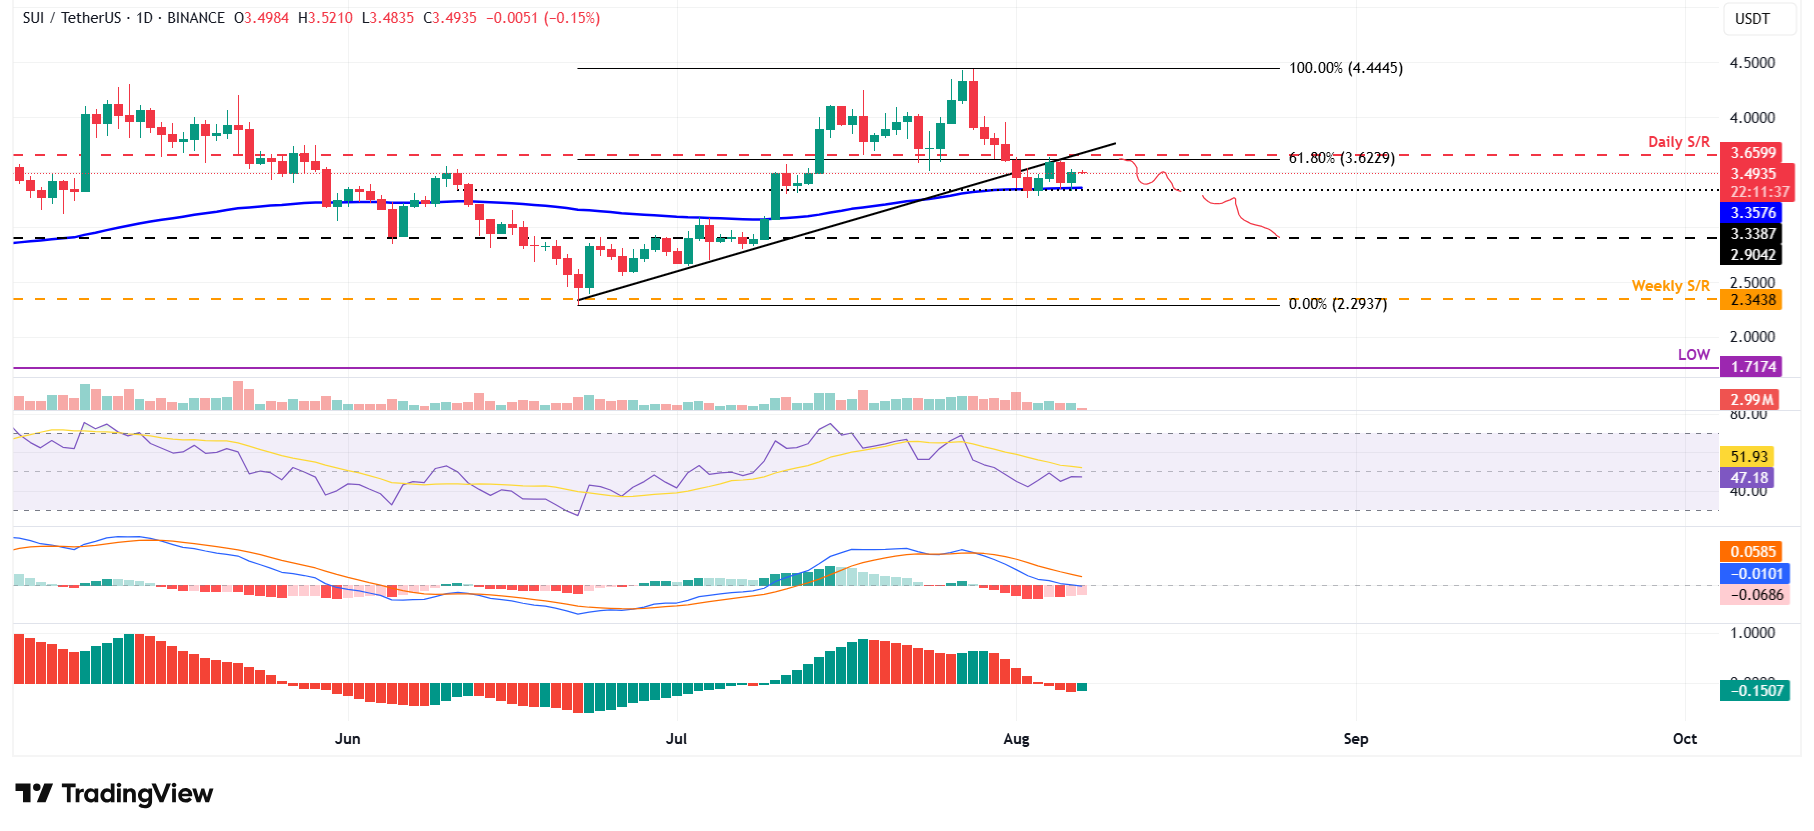
SUI/USDT daily chart
However, if SUI closes above the daily resistance at $3.65, it could extend the rally toward its July 28 high of $4.44.
