Stellar (XLM) Price Alert: Bearish Storm Intensifies as Shorts Pile On

Stellar's XLM is getting crushed under the weight of rising bearish bets—and traders aren't expecting relief anytime soon.
Why the gloom? The altcoin's charts are flashing red, with sellers overwhelming every attempted bounce. Market sentiment's turned toxic, and even die-hard XLM bulls are hitting the exits.
Wall Street's usual 'buy the dip' crowd? Suspiciously quiet. Maybe they're too busy explaining their last 'sure thing' altcoin pick to angry limited partners.
One thing's clear: Until XLM bulls retake control, this descent could get uglier. Strap in.
XLM traders bet against recovery as Open Interest declines
Investors are losing confidence in stellar as capital outflows surge from the XLM derivatives market amid the broader market pullback.
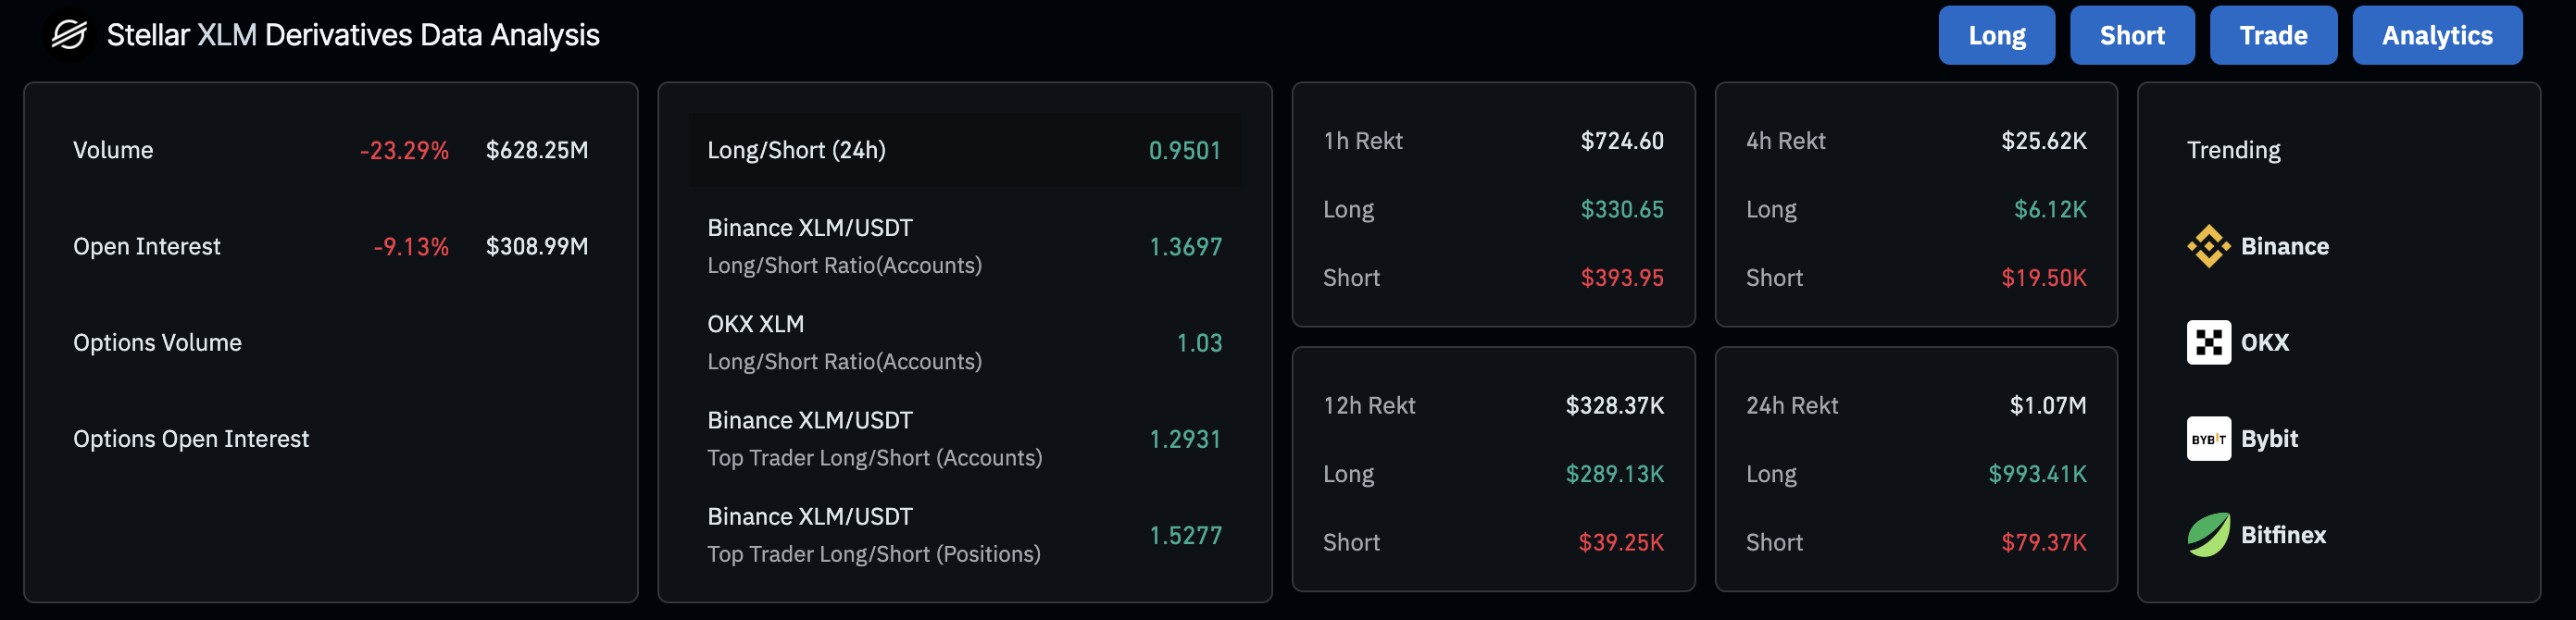
CoinGlass data shows that Open Interest (OI) has decreased by 9% over the last 24 hours, reaching $308.99 million. A pullback in OI reflects capital outflow from the futures and options, suggesting investors are adopting a wait-and-see approach to avoid losses.
XLM Open Interest. Source: Coinglass
Traders with a higher risk appetite are betting against the XLM recovery chances by holding bearish positions. According to the XLM long-to-short ratio chart, short positions have increased to 54.26% from 51.81% on Tuesday.
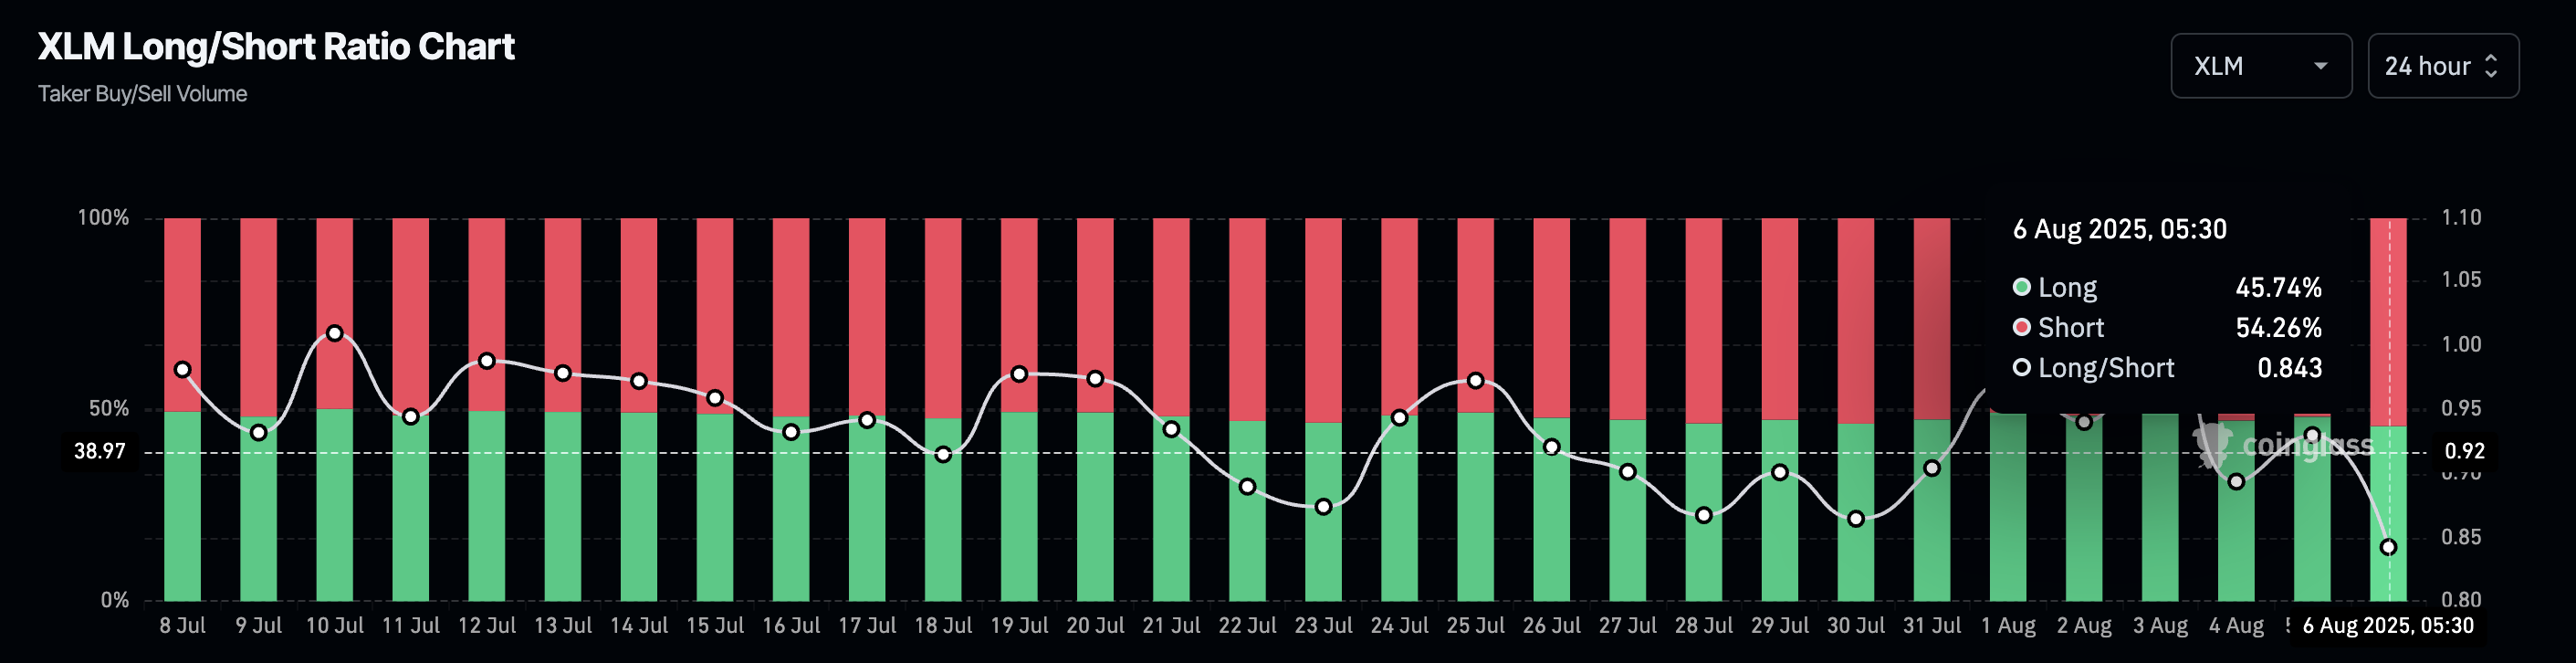
XLM long/short ratio chart. Source: Coinglass
Stellar risks 11% pullback within falling channel
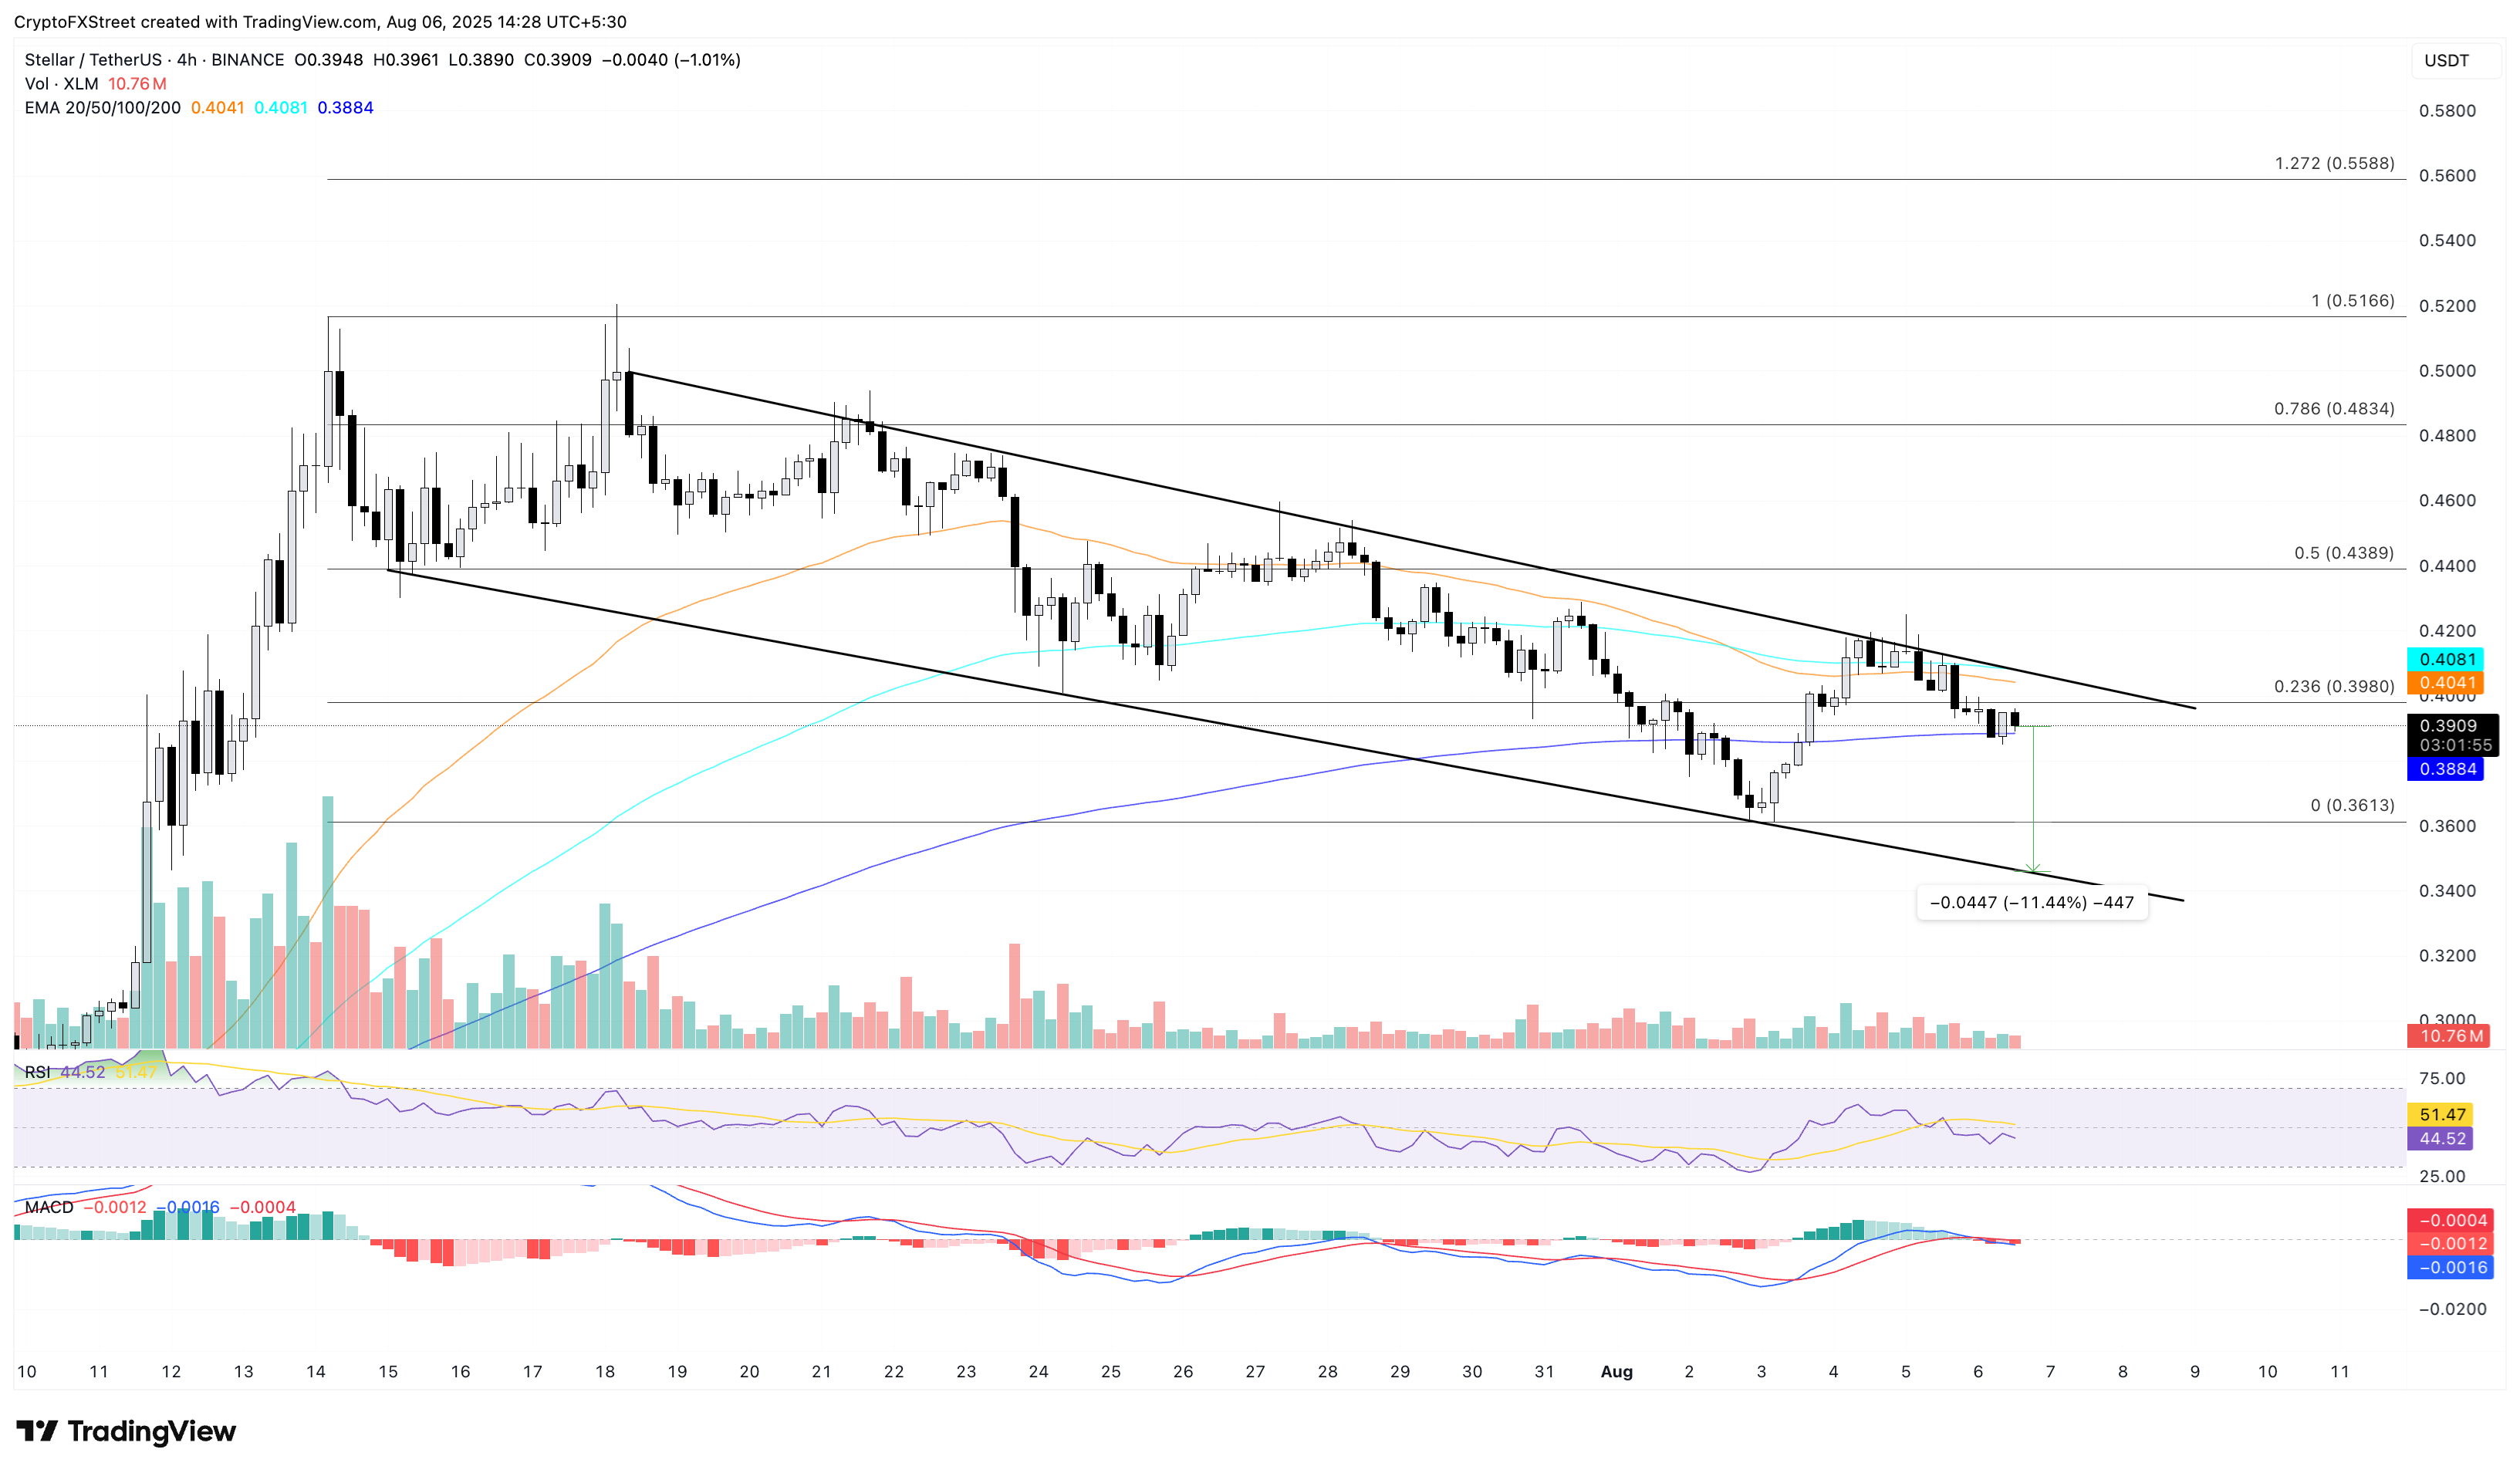
Stellar tests the 200-period Exponential Moving Average (EMA) at $0.3884 on the 4-hour chart, extending the 4.30% drop from the previous day. The declining trend steps below the 23.6% Fibonacci level at $0.3980, drawn from the $0.5166 peak on July 14 to the 0.3613 low on Sunday.
A decisive close below the said dynamic support could extend the decline to the $0.3613 support.
However, the bearish pattern highlights the risk of XLM retesting the lower support trendline near $0.3460. This pullback WOULD account for an 11% drop from the current market price.
The technical indicators maintain a neutral stance as the Moving Average Convergence Divergence (MACD) line crossed below its signal line, but moves sideways closely, indicating low momentum.
A decline in buying pressure causes the Relative Strength Index (RSI) to drop to 44 on the 4-hour chart, below the halfway line. If RSI extends the declining trend, it could increase the chances of a double-digit fall.
XLM/USDT daily price chart.
On the contrary, if XLM bounces off the 200-period EMA, it should surpass the 100-period EMA at $0.4082 at the overhead trendline, to reinforce an uptrend. In such a case, Stellar could extend the rally to the 50% retracement level at $0.4389.
