Hyperliquid Under Siege: Short Sellers Target Sub-$30 Crash as Bearish Bets Mount

Bears are circling Hyperliquid like sharks smelling blood—short interest surges as traders bet against the token's survival below $30.
Who needs fundamentals when you've got leverage? The crypto casino rolls on, with speculators doubling down on Hyperliquid's demise. Technicals suggest a breakdown, but in this market, even 'sure things' tend to surprise.
Remember: Wall Street calls it 'hedging'—crypto traders call it Friday. Either way, someone's about to get rekt.
Hyperliquid on-chain, derivatives metrics turn bearish
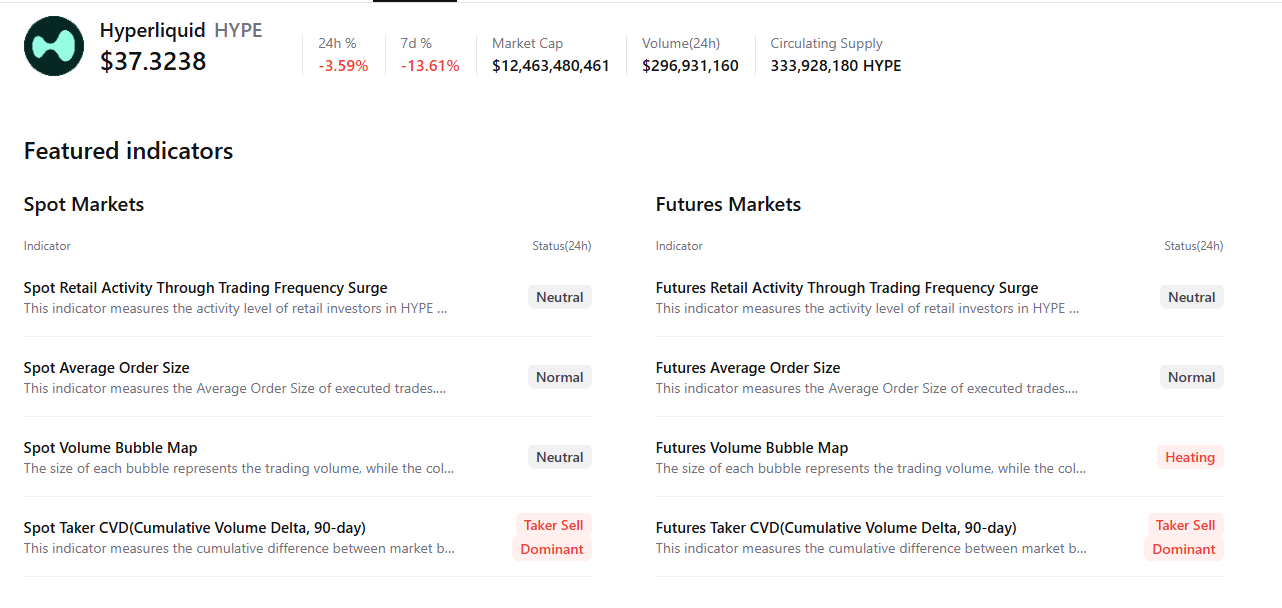
CryptoQuant data highlights the rising selling pressure on Hyperliquid. The Taker CVD (Cumulative Volume Delta) for HYPE is negative, and its value has been steadily decreasing since mid-July. This metric measures the cumulative difference between market buy and sell volumes over three months. When the three-month CVD is positive and increasing, it suggests the Taker Buy Dominant Phase, while a negative and decreasing value, as it is currently happening, indicates the Taker Sell Dominant Phase.
-1754467775031-1754467775043.png)
Hyperliquid Spot Taker CVD chart. Source: CryptoQuant
CryptoQuant’s summary data also indicates that Hyperliquid’s futures market activity is heating up as more traders are opening Leveraged positions alongside negative Spot Taker CVD, signaling a potential correction ahead.
The bearish outlook is further supported by Coinglass' long-to-short ratio, which stands at 0.77 on Wednesday, marking the lowest level in over a month. A ratio below one suggests bearish sentiment in the market as traders are betting that the asset price will fall.
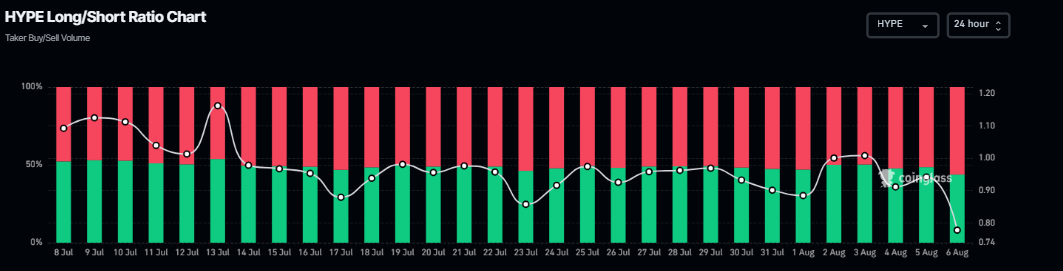
HYPE long-to-short ratio chart. Source: CoinGlass
Hyperliquid Price Forecast: Bears targeting levels below $30
Hyperliquid price broke below the ascending trendline (drawn by connecting multiple lows since early April) on Thursday and declined 10.34%, closing below the daily support at $38.87 in the next two days.
However, HYPE recovered slightly from Sunday to Monday but failed to close above its daily resistance at $38.87 and declined slightly the next day. At the time of writing on Wednesday, it continues to trade down around $37.64.
If HYPE continues its downward trend, it could retest its 61.80% Fibonacci retracement level at $34.40 (drawn from April's low of $9.32 to July's all-time high of $49.88). A successful close below this level could extend the loss to retest its weekly level at $27.49.
The Relative Strength Index (RSI) on the daily chart reads 39, below its neutral value of 50, indicating strong bearish momentum. The Moving Average Convergence Divergence (MACD) showed a bearish crossover on July 23 that still holds, also indicating bearish momentum.
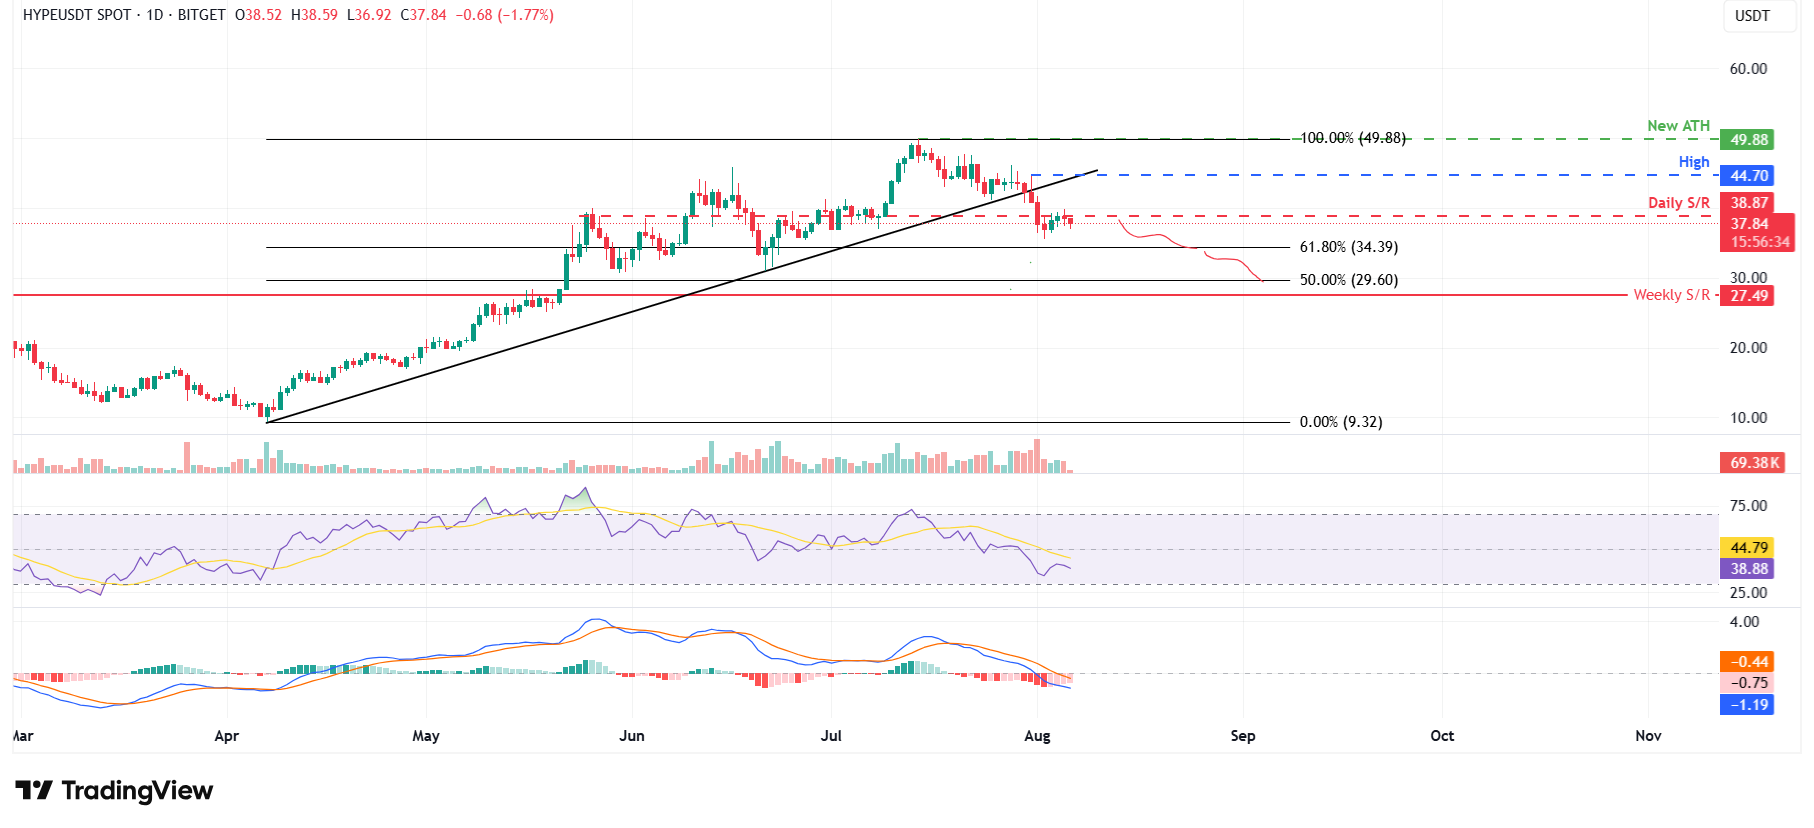
HYPE/USDT daily chart
If HYPE closes above the daily resistance at $38.87, it could extend the recovery toward the July 31 high of $44.70.
