🚀 PUMP.fun Primed for Explosive Rally: 4-Day Surge Signals Breakout Potential
Memecoin mania refuses to die—and PUMP.fun's token is loading the rocket fuel. After clawing back gains for four straight days, the degen favorite shows unsettling resemblance to pre-pump patterns that left bagholders crying (and a few Lambo shopping).
Chart Whisperers See Green
No fancy indicators needed here—just a textbook consolidation above support with volume creeping in. The last time PUMP held this level? A 300% tear that vaporized shorts faster than a Celsius withdrawal request.
Liquidity Hunting Season
Market makers appear to be baiting stops below $0.0042 while eyeing the illiquid zone near $0.0078. Retail FOMO could trigger the classic 'up only' algo reaction—assuming Bitcoin doesn't do its usual party-pooper routine.
Bottom Line
This either moons hard or becomes another 'wen refund' meme. But let's be real—since when has rationality stopped crypto traders? Just remember: those gain porn screenshots never show the leverage liquidation that came after.
Whale bets big on PUMP as revenue stabilizes
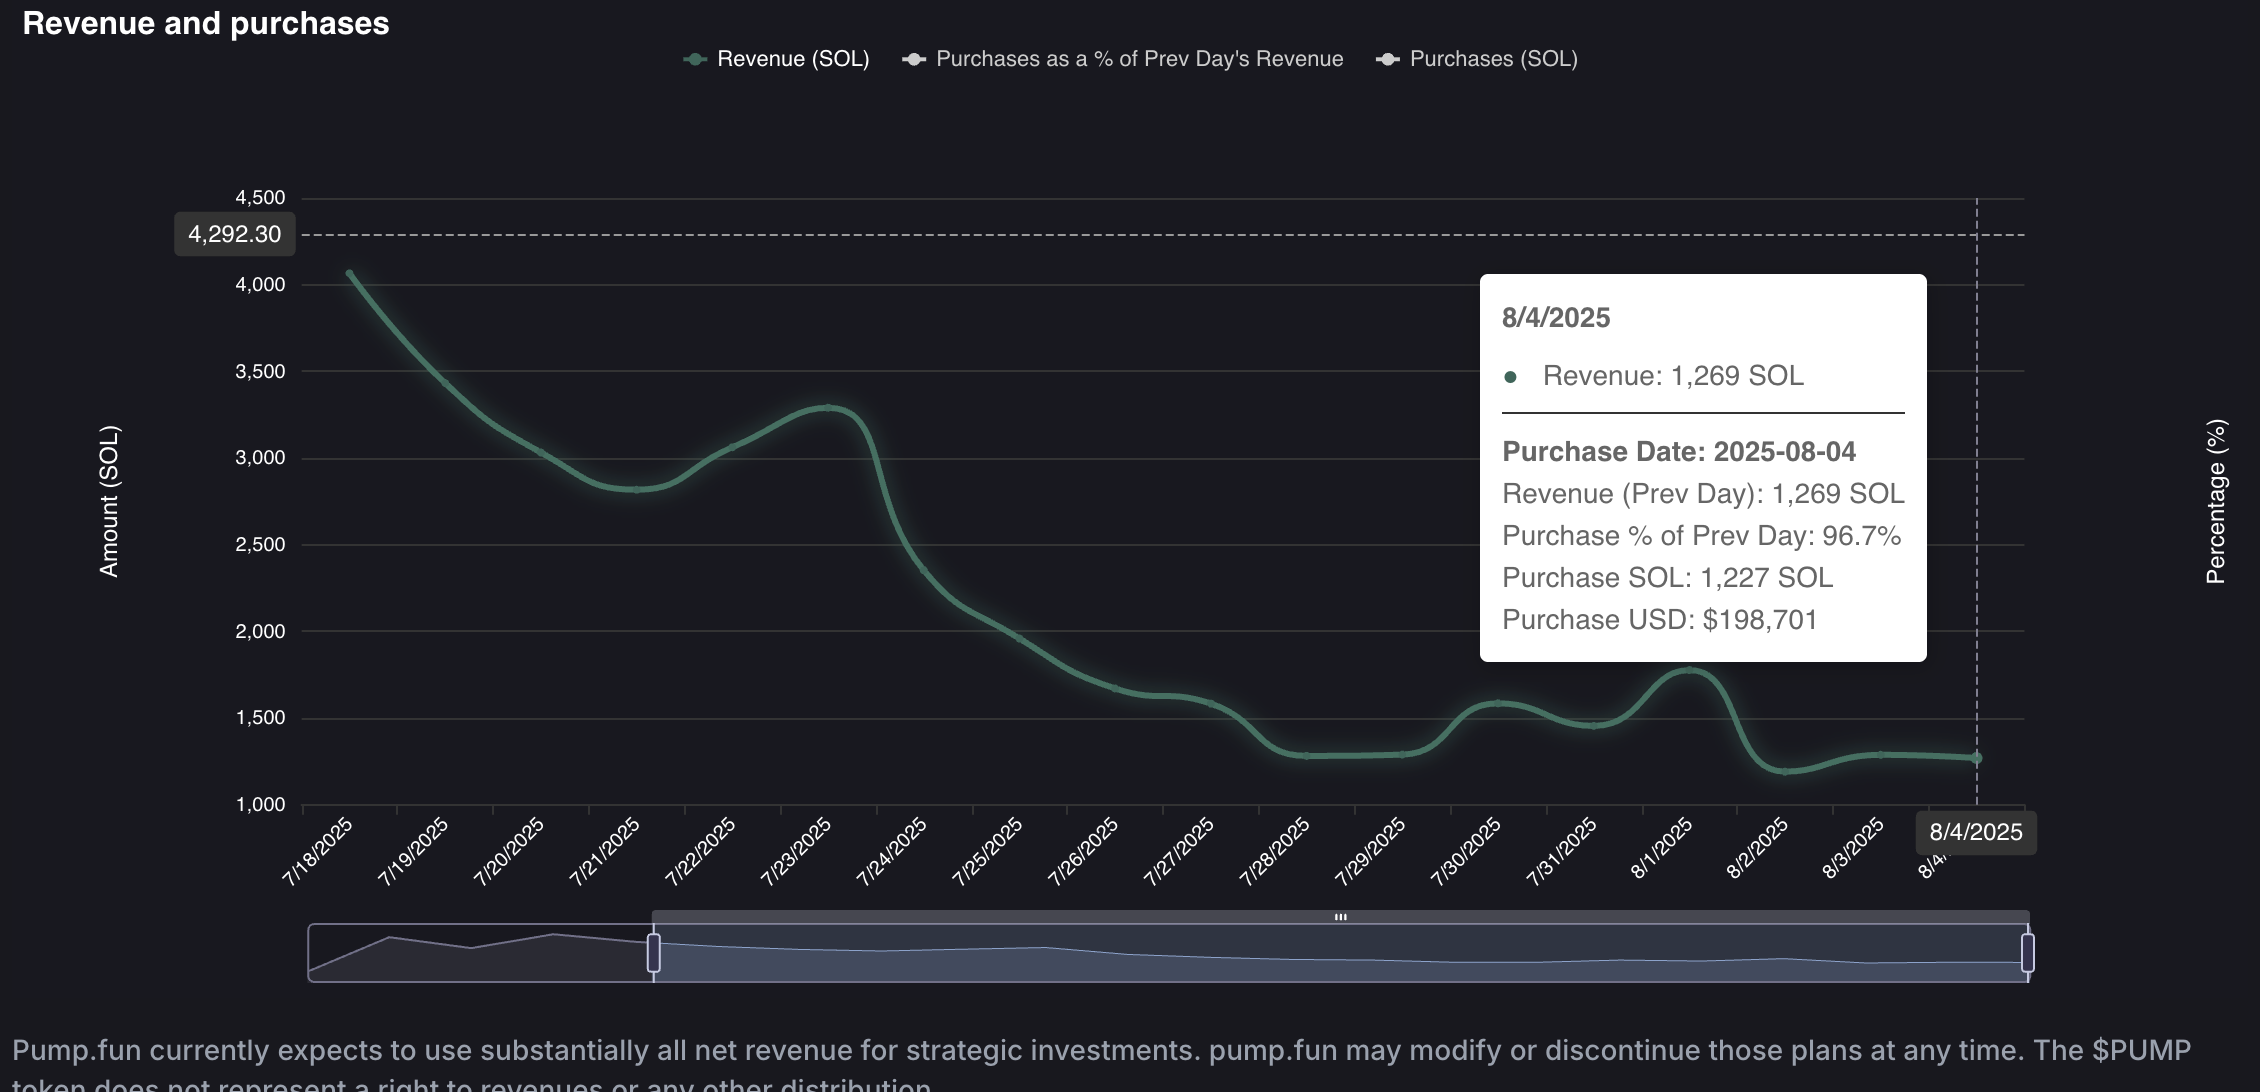
Pump. Fun’s revenue dashboard reflects a broadly stable revenue, as it moves flat at 1,269 SOL. Still, investors may consider the meme coin HYPE is fading, as revenue has tanked from the 5,091 SOL seen on July 17.

Pump.fun revenue. Source: fees.pump
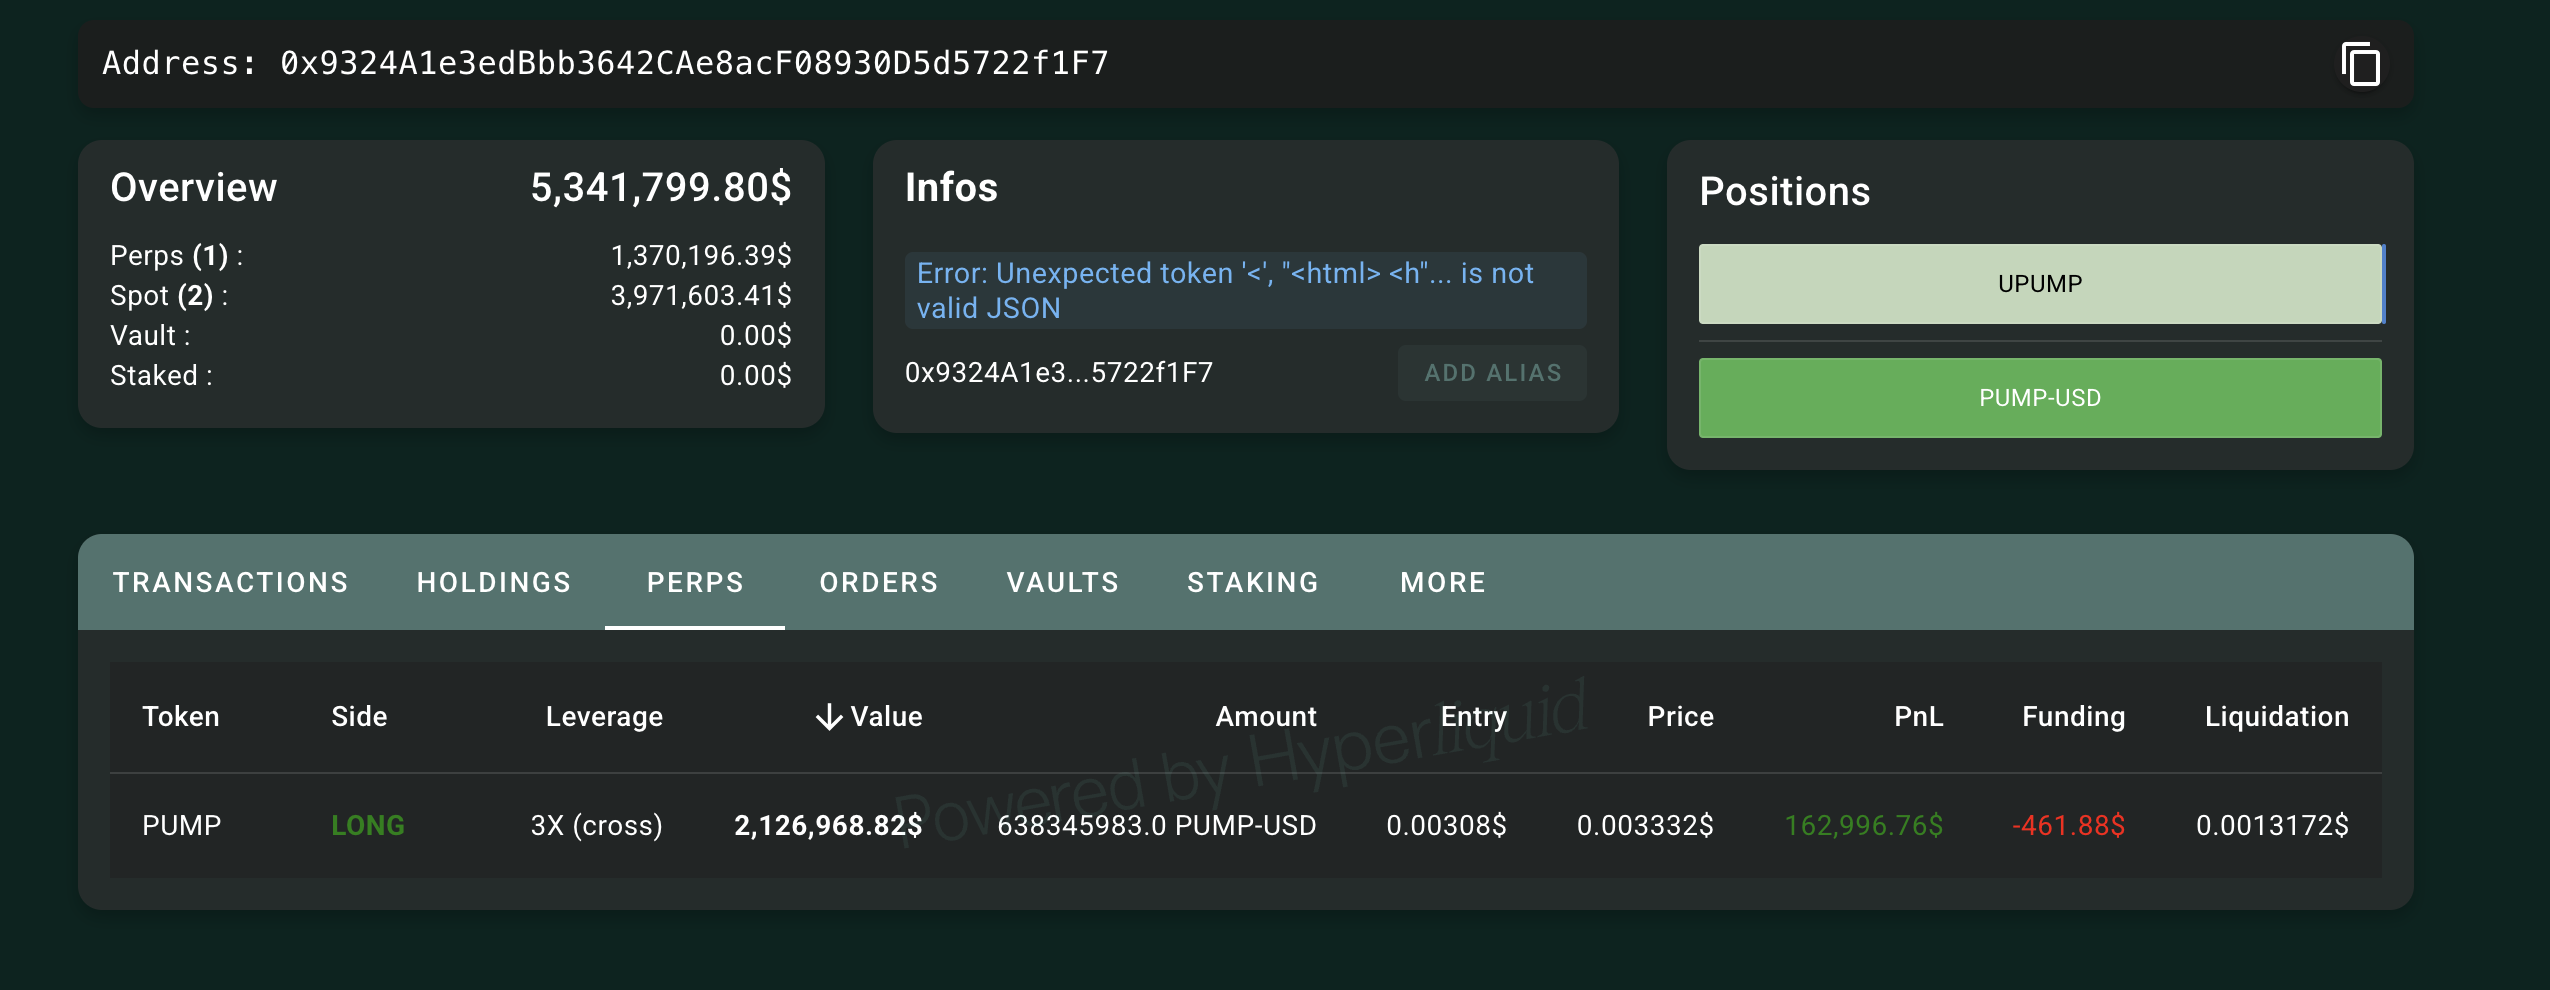
Despite the broadly stable revenue, a whale anticipating a reversal run has opened a long position of 594 million PUMP tokens Leveraged by 3x on Hyperliquid, worth $1.83 million. The whale acquired 1.06 billion PUMP tokens from the spot market.

Whale holding. Source: HypurrScan
At present, the whale holds over $160,000 in profits.

Perp holding. Source: HypurrScan
PUMP eyes extended gains with range breakout
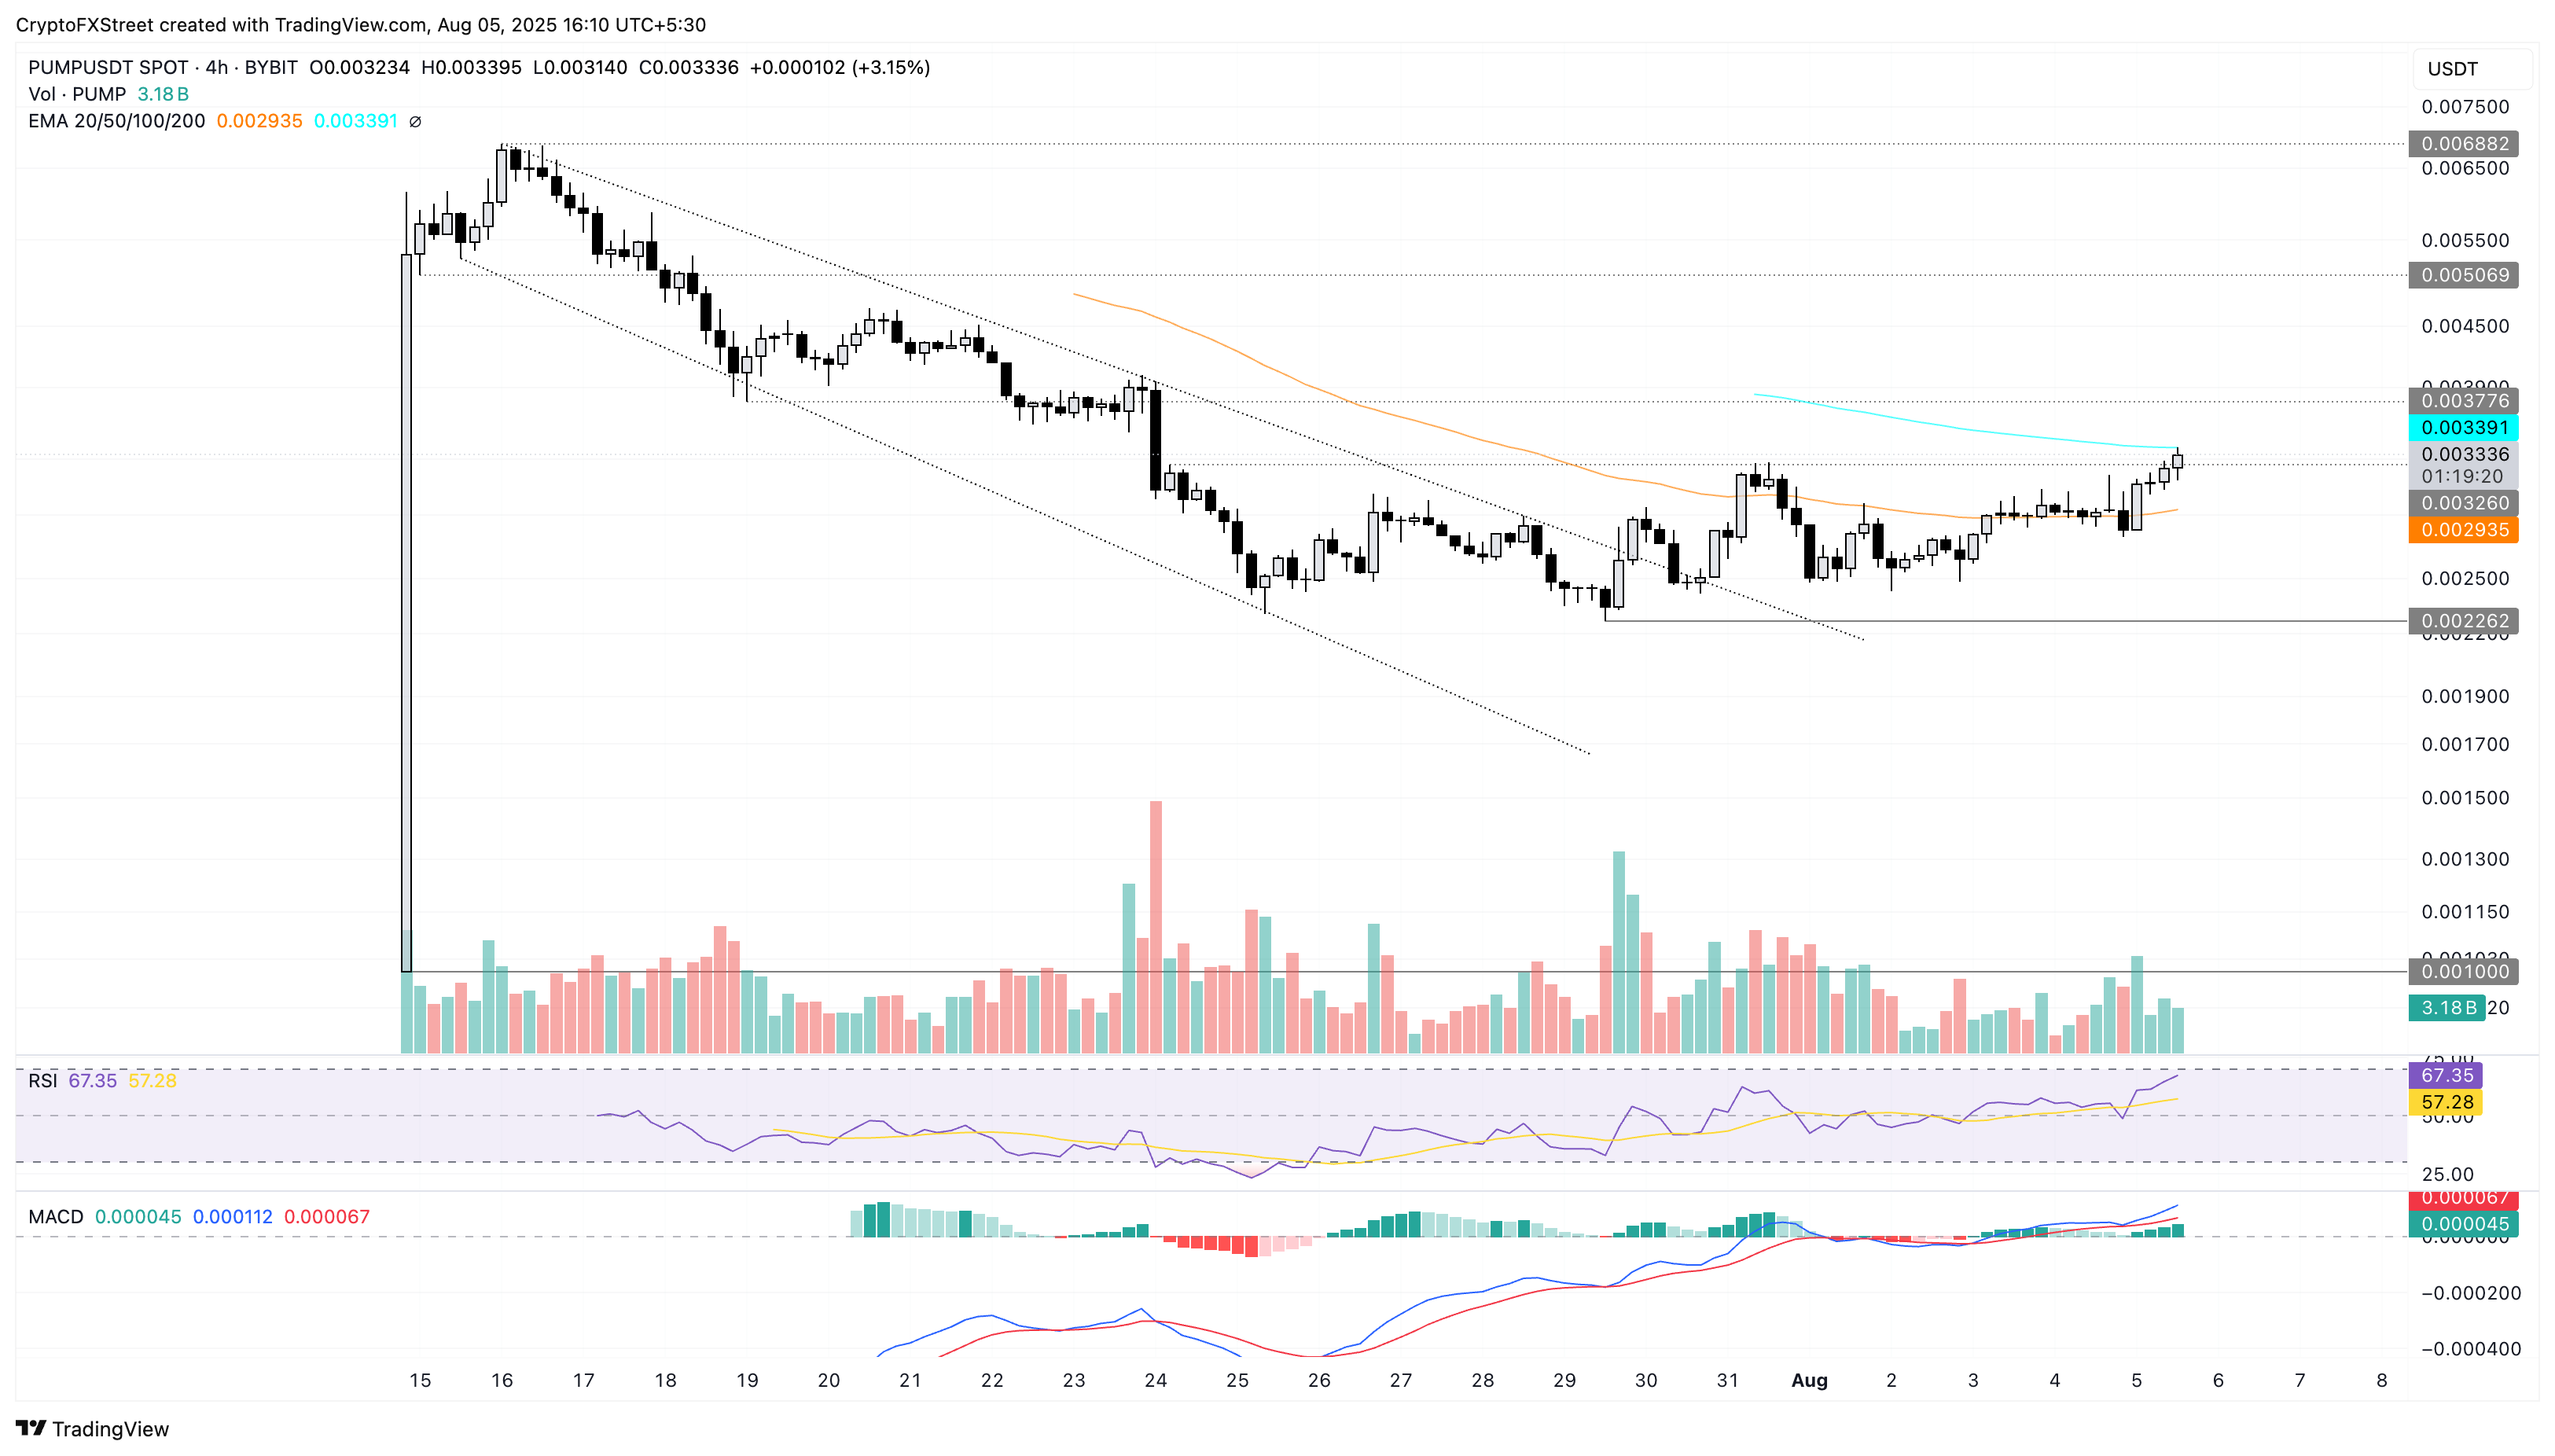
PUMP recovery run surpasses the $0.003260 resistance level on the 4-hour chart, last tested on Thursday, signaling a potential range breakout. Prices should mark a decisive candle close above this level to support the uptrend.
In such a case, the PUMP token price could test the $0.003776 level, which aligns with the low of July 19. That WOULD represent a near 14% surge from current price levels.
Technical indicators maintain a bullish bias. The Relative Strength Index (RSI) reads 67 on the 4-hour chart, indicating heightened buying pressure.
The Moving Average Convergence Divergence (MACD) and its signal line sustain an uptrend above the zero line, suggesting rising bullish momentum.

PUMP/USDT daily price chart.
Looking down, a reversal under the $0.003260 level would nullify the breakout chances, potentially testing the $0.002262 support floor.

