🚀 MemeCore Ignites Crypto Surge: Mantle & Litecoin Eye Breakout as Market Roars Back | August 2025

Meme coins lead charge as crypto bulls awaken
The 'dumb money' rally has legs—MemeCore's 72% weekly surge drags altcoins higher while Bitcoin holds $42K. Meanwhile, layer-2 darkhorse Mantle flips three resistance levels in 48 hours.
Litecoin's halving hype builds (again)
LTC's 18% monthly gain smells like 2023's pre-halving pump—but this time, miners are actually hodling. Watch the $95 resistance like a hawk.
Institutional FOMO meets trader skepticism
BlackRock's ETF inflows hit $200M daily... just as retail traders YOLO into Dogwifhat futures. Some things never change—except maybe your portfolio balance.
MemeCore rally risks overbought conditions
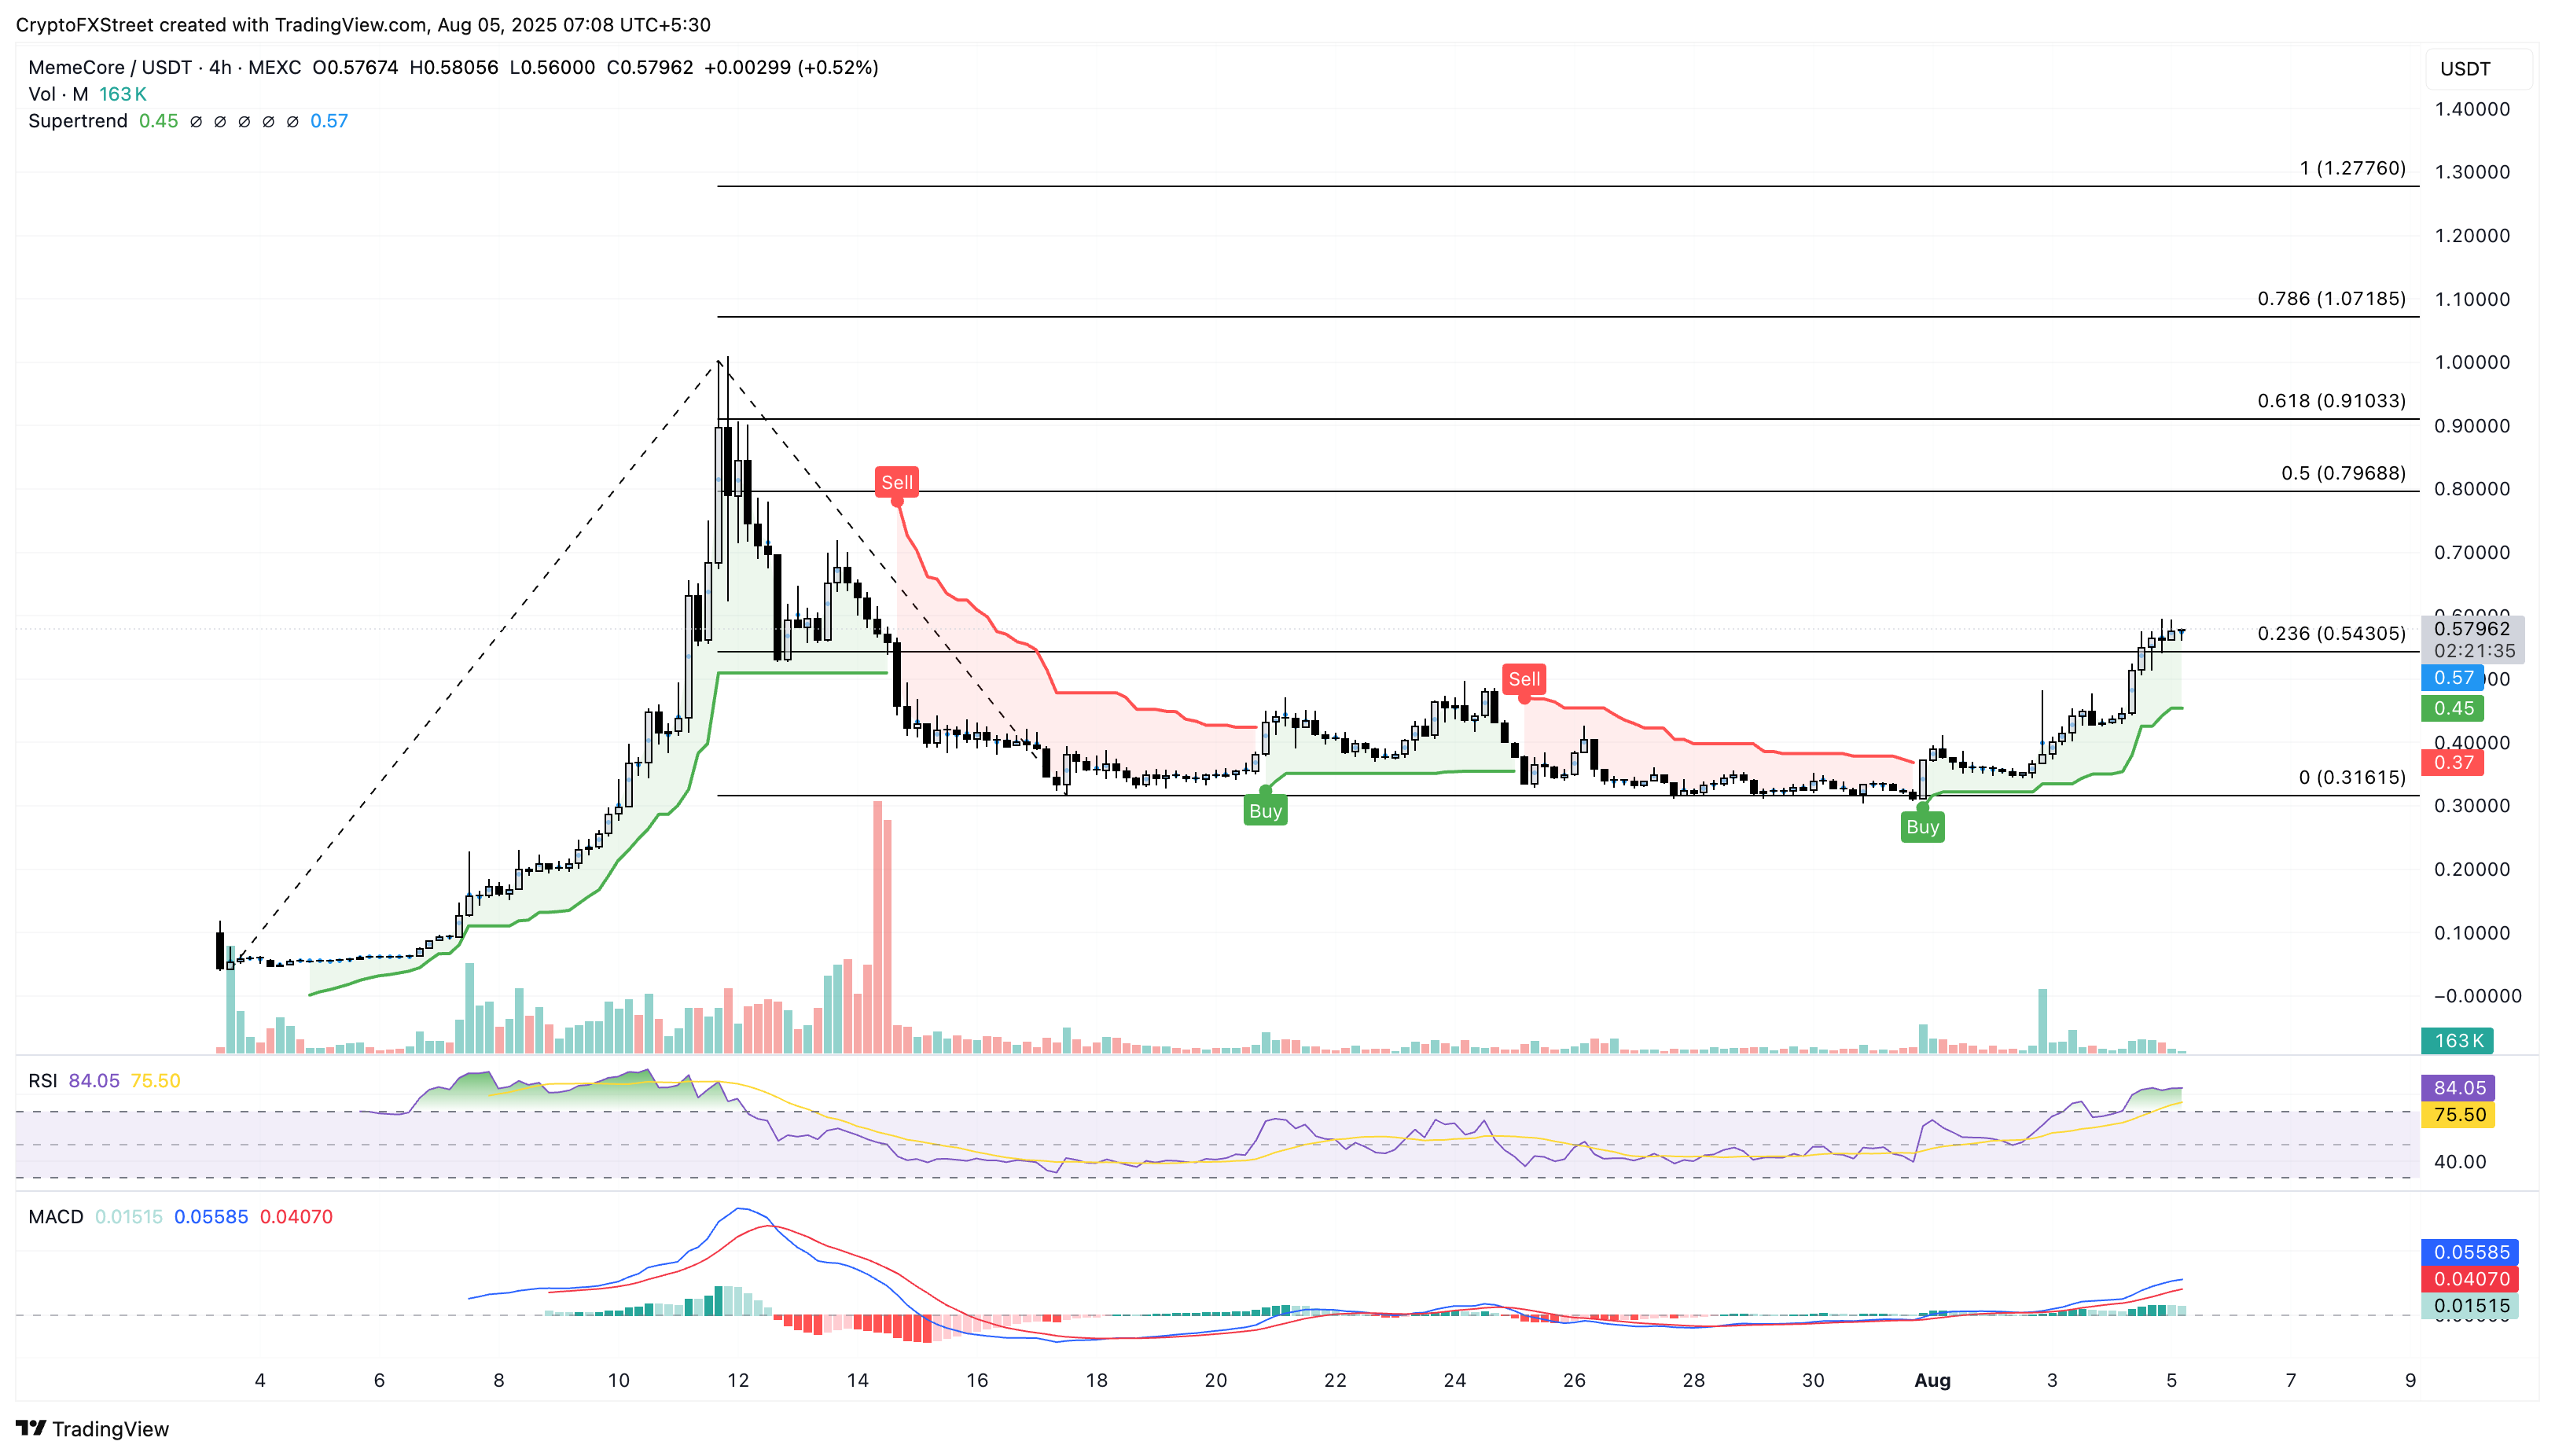
MemeCore loses steam by over 2% at press time on Tuesday following the 31% gains from the previous day. The uptrend surpassed the 23.6% trend-based Fibonacci level at $0.5430, with bulls targeting the 50% retracement level at $0.7968.
However, investors should exercise caution, as the Relative Strength Index (RSI) reads 84 on the 4-hour chart, indicating overbought conditions that may signal a sudden exhaustion in buying pressure.
The Moving Average Convergence Divergence (MACD) line maintains an uptrend with its signal line reflecting a steady growth in bullish momentum.
M/USDT daily price chart.
On the downside, a reversal below the $0.5430 level could extend the decline to $0.5000 support level.
Mantle eyes breakout rally as bullish momentum recovers
Mantle displays a massive rebound on the daily chart with a 19% jump on Monday, extending the 3% from Sunday. At the time of writing, MNT has edged lower by 2% so far on Tuesday, trading below the 50% retracement level at $0.8856, drawn from $1.41 on January 6 to $0.55 on July 1.
Investors may consider the Golden Cross between the 50 and 100-day Exponential Moving Averages (EMAs) as a buy signal, indicating that the short-term recovery has outpaced the medium-term trend.
The momentum indicators point to a bullish tilt on the daily chart as the RSI upticks to 60 with room for growth, and the MACD line manifests a crossover above its signal line.
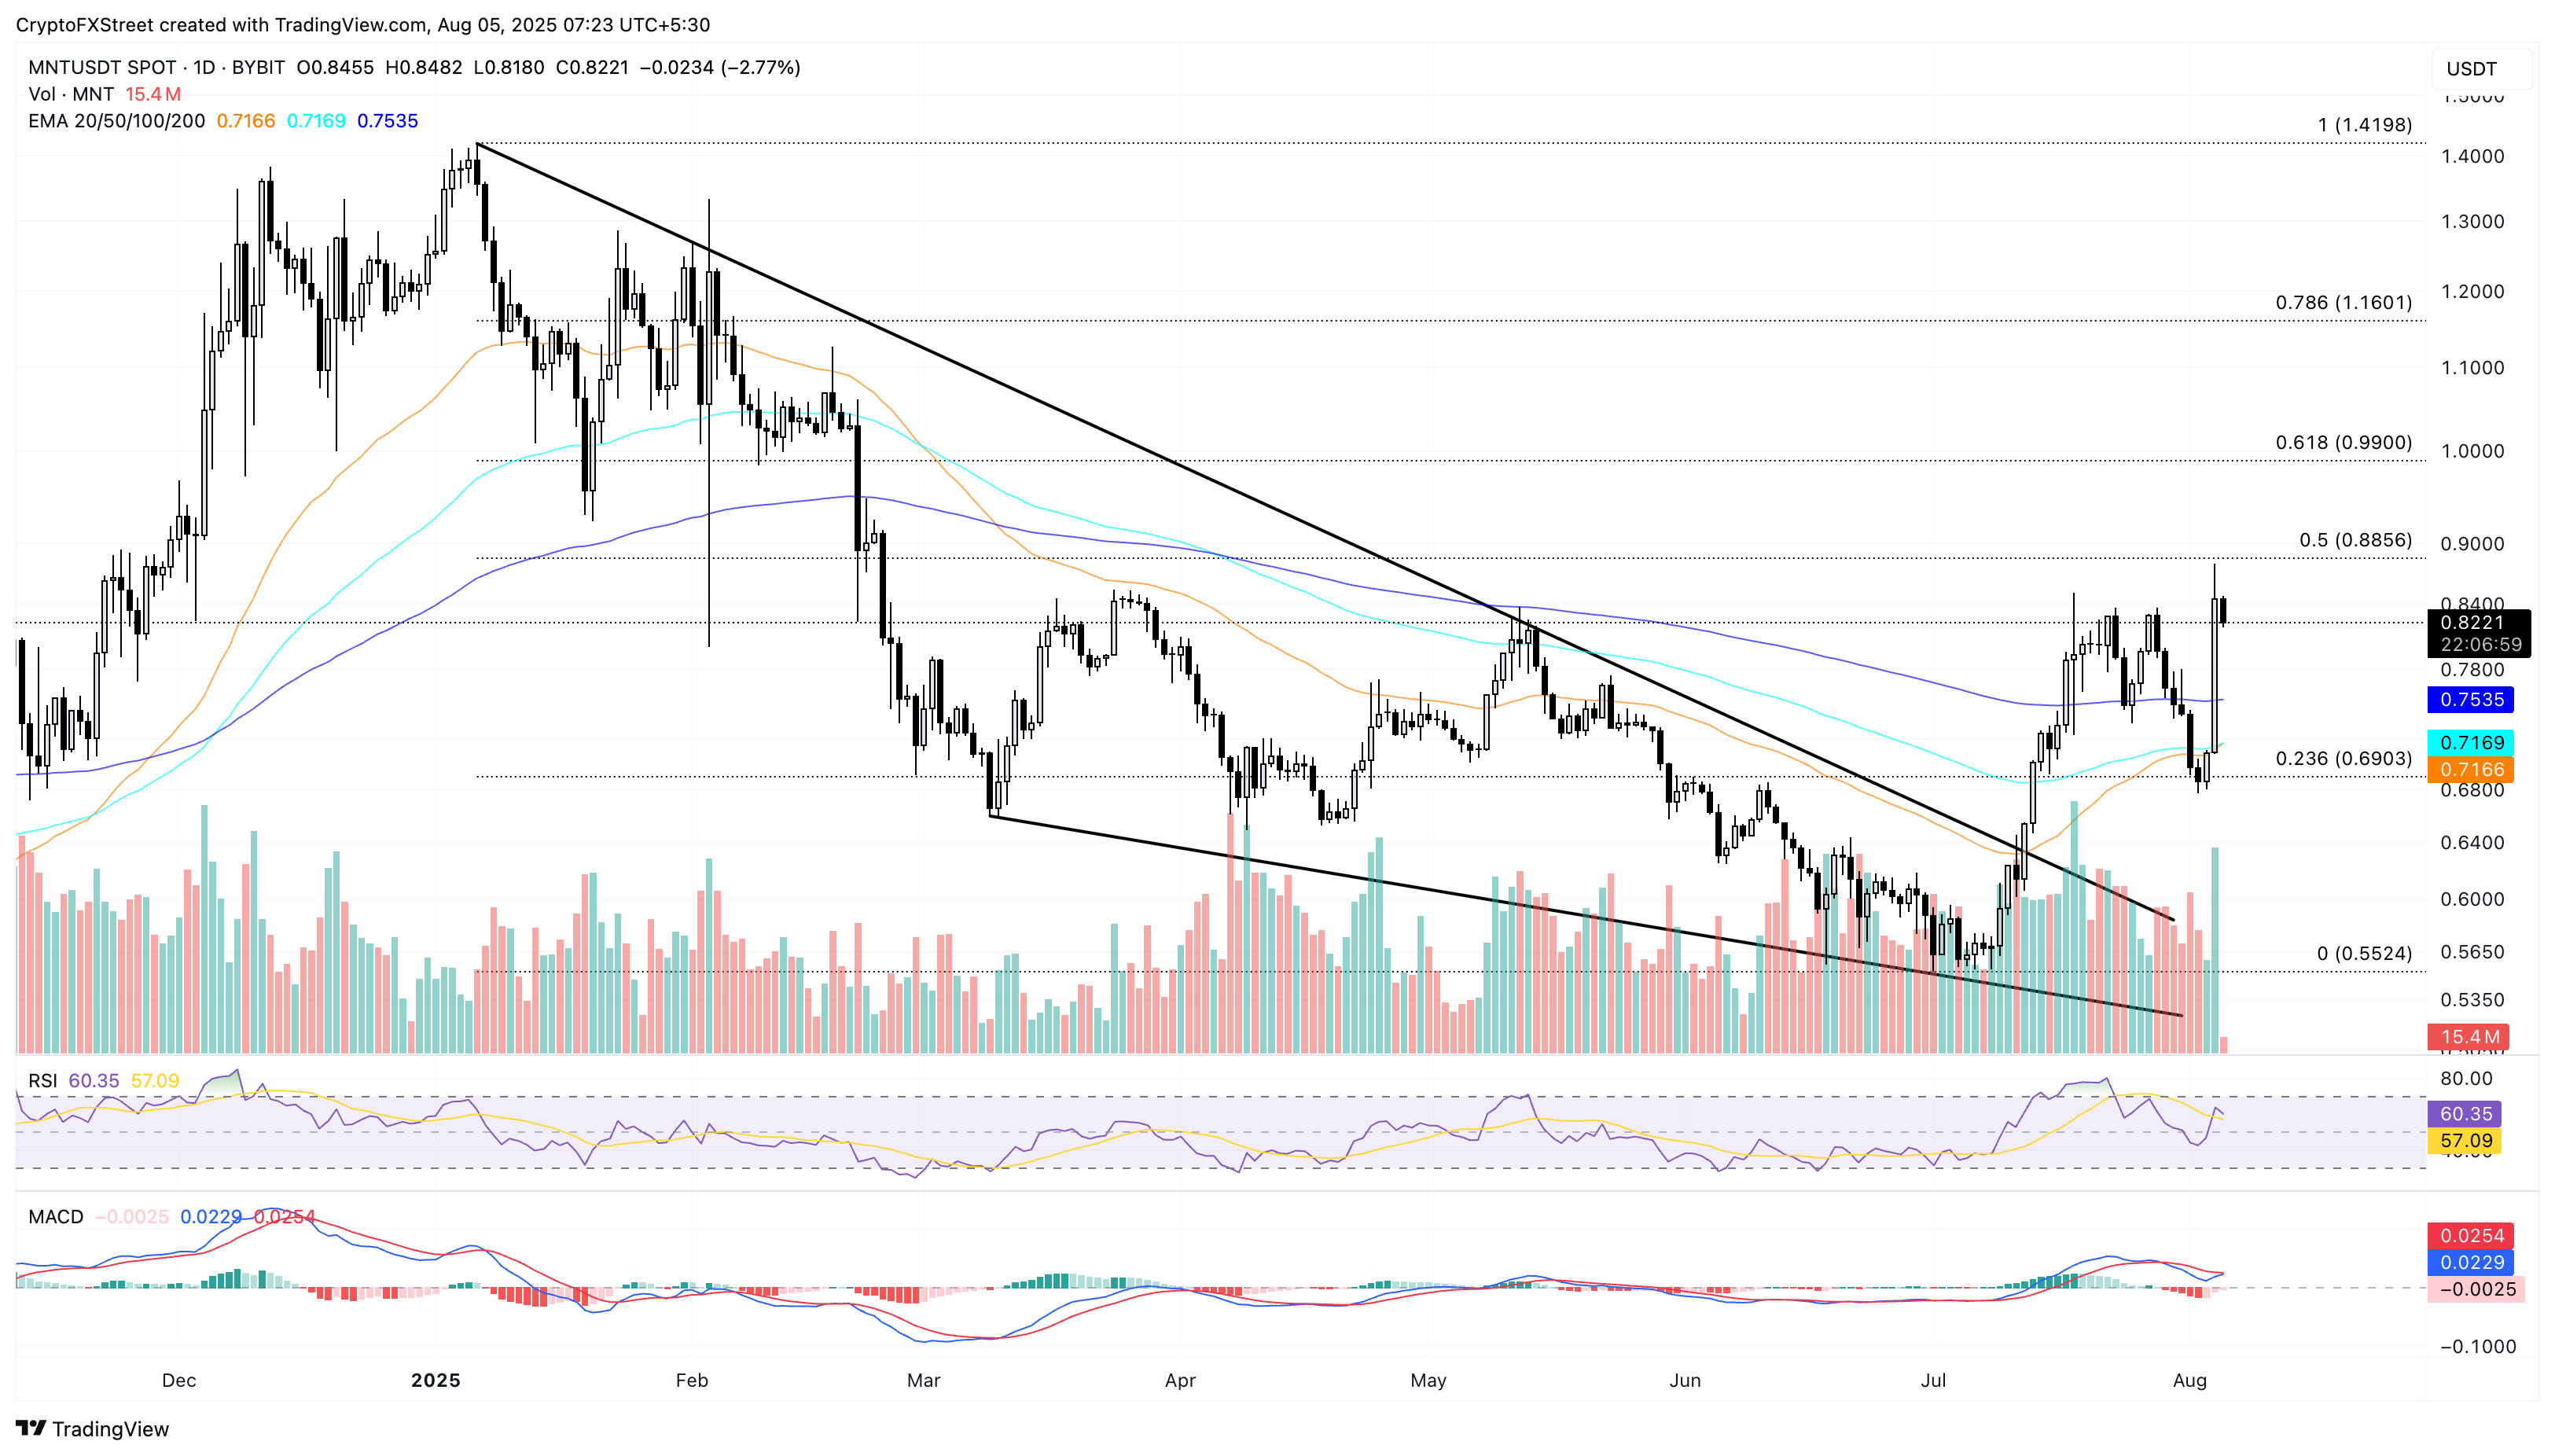
MNT/USDT daily price chart.
Looking down, a reversal in Mantle could extend the decline to the 200-day EMA at $0.75.
Litecoin hits five-month high, targeting $146
Litecoin edges higher by nearly 2% at press time on Tuesday, extending the nearly 10% gains from Monday. The reversal rally hits the highest level since March 3, surpassing the 78.6% Fibonacci level at $122 drawn from $146 on December 5 to $63 on April 7.
Investors could increase their exposure to LTC with a decisive close above $122, potentially extending the rally to the $147 peak. Furthermore, the MACD and signal line are on the verge of giving a crossover, which WOULD flash another buy signal.
Still, the RSI on the daily chart reads 70, indicating that it has reached the overbought boundary, which risks a potential reversal as buying pressure nears saturation.
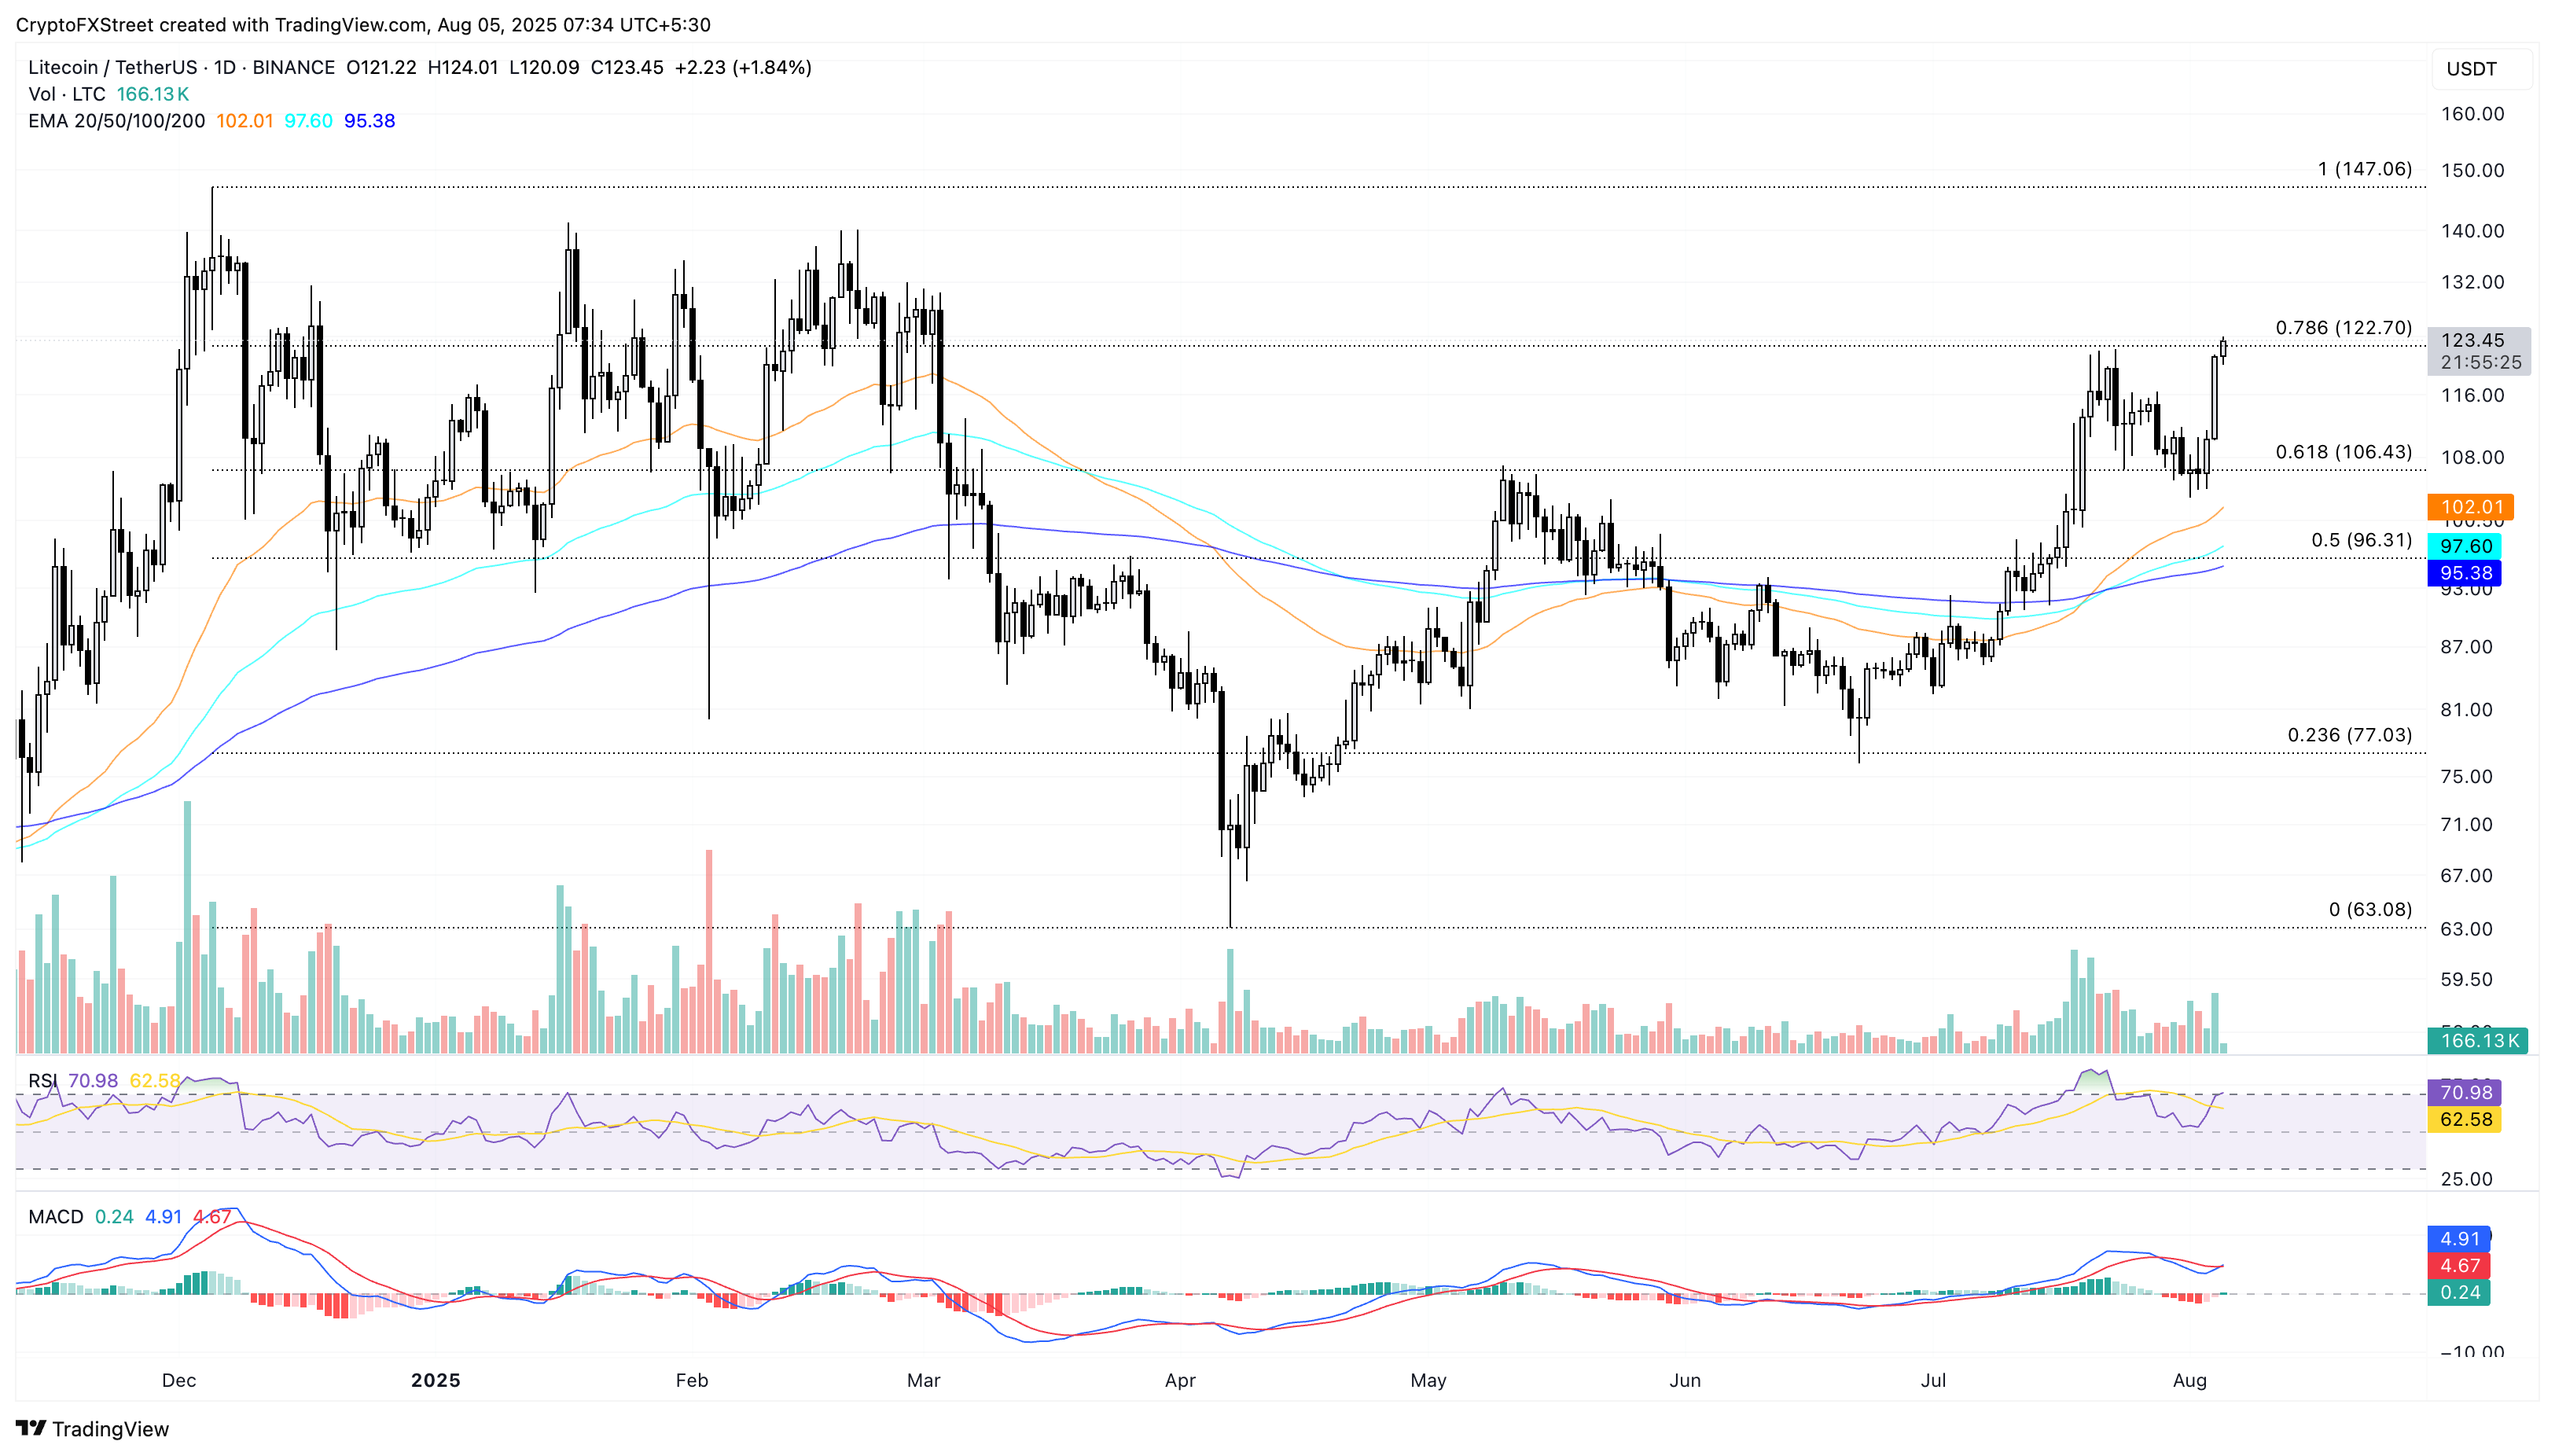
LTC/USDT daily price chart.
On the flipside, a reversal from the overhead resistance risks losing the recent gains with a retest of the 61.8% Fibonacci level at $106.
